Significance
To date, poor temporal resolution of response measurement has obscured the complex initiation of receptor tyrosine kinase (RTK) signaling that governs cellular response to stimulation. To address this deficiency, we have performed a systems-level characterization of the phosphorylation changes that occur in the immediate period after growth factor stimulation with 10-s resolution. We treated MCF-10A cells with EGF and measured tyrosine phosphorylation levels from 0 to 80 s on hundreds of sites in the cell. Examining phosphorylation dynamics on this timescale reveals patterns that were not observable with slower sampling rates. We further explore the roles of negative and positive feedback, providing further insight into systems-level behaviors of the EGF receptor (EGFR) signaling network.
Keywords: signal transduction, tyrosine phosphorylation, epidermal growth factor receptor, mass spectrometry
Abstract
Despite extensive study of the EGF receptor (EGFR) signaling network, the immediate posttranslational changes that occur in response to growth factor stimulation remain poorly characterized; as a result, the biological mechanisms underlying signaling initiation remain obscured. To address this deficiency, we have used a mass spectrometry-based approach to measure system-wide phosphorylation changes throughout the network with 10-s resolution in the 80 s after stimulation in response to a range of eight growth factor concentrations. Significant changes were observed on proteins far downstream in the network as early as 10 s after stimulation, indicating a system capable of transmitting information quickly. Meanwhile, canonical members of the EGFR signaling network fall into clusters with distinct activation patterns. Src homology 2 domain containing transforming protein (Shc) and phosphoinositol 3-kinase (PI3K) phosphorylation levels increase rapidly, but equilibrate within 20 s, whereas proteins such as Grb2-associated binder-1 (Gab1) and SH2-containing tyrosine phosphatase (SHP2) show slower, sustained increases. Proximity ligation assays reveal that Shc and Gab1 phosphorylation patterns are representative of separate timescales for physical association with the receptor. Inhibition of phosphatases with vanadate reveals site-specific regulatory mechanisms and also uncovers primed activating components in the network, including Src family kinases, whose inhibition affects only a subset of proteins within the network. The results presented highlight the complexity of signaling initiation and provide a window into exploring mechanistic hypotheses about receptor tyrosine kinase (RTK) biology.
The EGF receptor (EGFR) sits atop a complex signaling network that controls cell behavior in response to environmental cues. Cascades of posttranslational modifications initiated from EGFR, notably phosphorylation on tyrosine, serine, and threonine, influence protein–protein interactions and enzymatic activity to activate transcriptional programs that regulate proliferation, differentiation, and apoptosis (1). Mutation or overexpression of EGFR has been identified as an oncogenic driver for many tumor types, making it an attractive target for anticancer therapies (2).
Building on decades of specific characterization using traditional biochemistry techniques, platforms such as protein microarrays and mass spectrometry have allowed systems biology to provide a comprehensive picture of intact and aberrant network behavior, which can be used to establish design criteria for therapeutic interventions (3). Manipulating components within the network experimentally and computationally has uncovered many features of the system that influence behaviors such as proliferation and survival (4–6). With many phenotypic responses occurring on the order of hours to days, most phosphorylation measurements have been on the timescale of minutes to hours, when phosphorylation levels are highest. However, a second class of responses, such as protrusion and calcium signaling, occur within a few seconds after stimulation and suggest an important early regime of signaling activity (7). Although individual, targeted analyses have provided insights into components of signaling activation, systems-level characterization of network activity during this period has been lacking.
Recent efforts have successfully measured signaling dynamics on the timescale of seconds in HeLa and T-cells using a flow apparatus, yielding new insight into network activation (8, 9). However, the experimental setup is not readily applicable to adherent cell types, and the shear forces endemic to the procedure may induce phosphorylation changes that confound the responses to growth factor (10). Here, we present an alternative method for investigating early phosphorylation dynamics in adherent mammary epithelial cells on the timescale of 10 s. Increased temporal resolution, paired with a wide variety of treatment conditions, have provided insight into the mechanisms controlling activation of the EGFR signaling network that are obscured at later time points. Our results reveal distinct patterns of receptor–adaptor complex formation, site-specific phosphatase activity, and tight integration of positive and negative feedback in the early periods of EGFR signaling.
Results
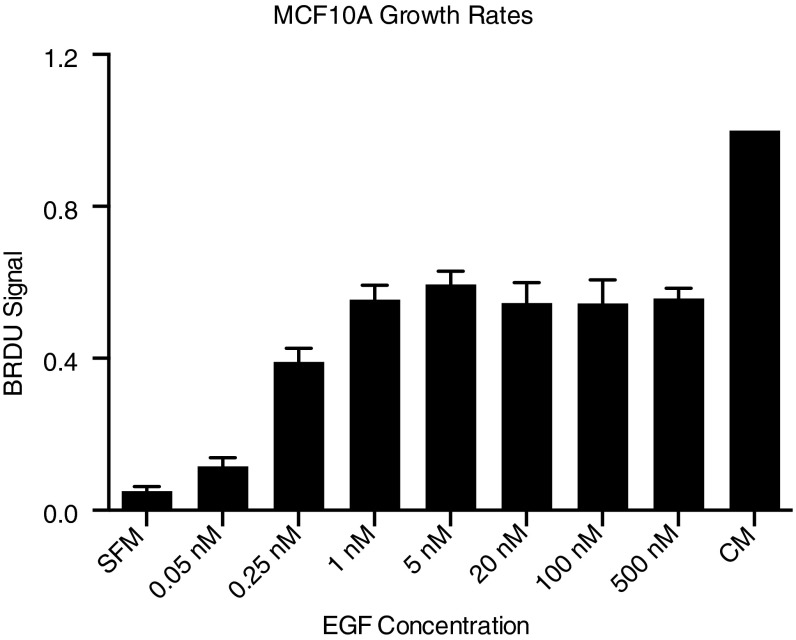
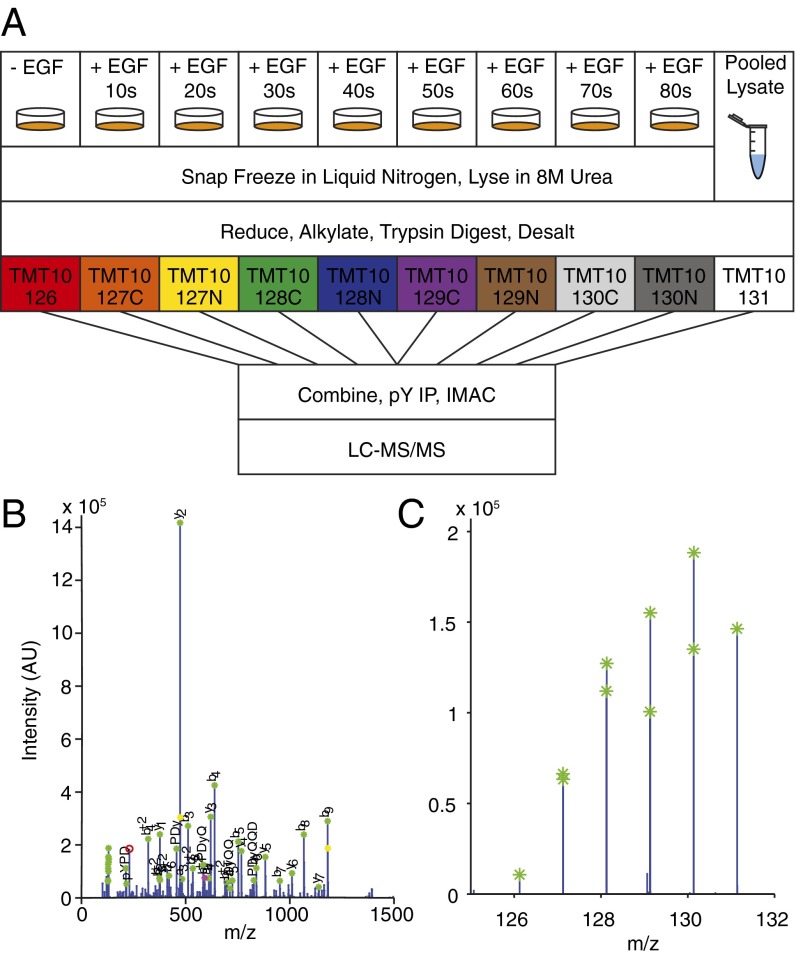
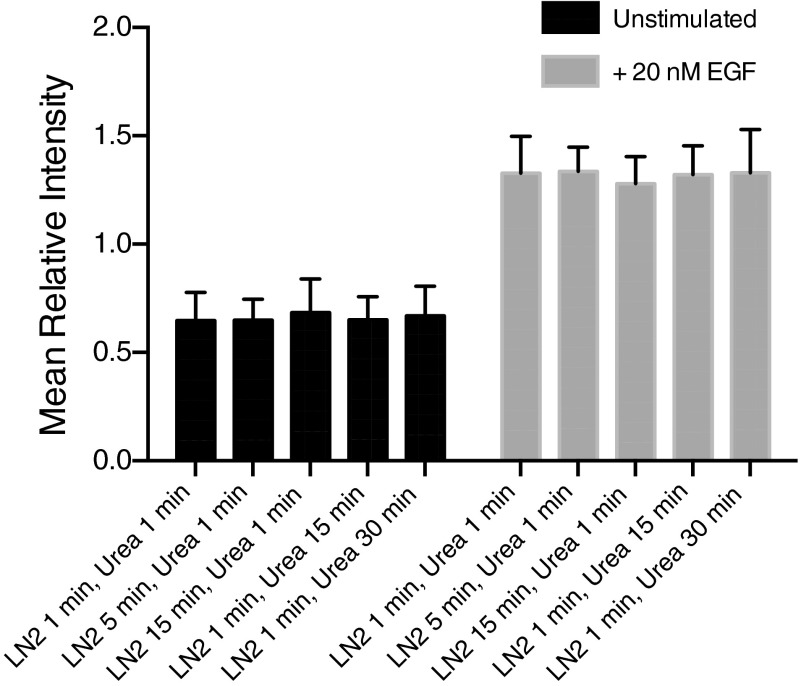
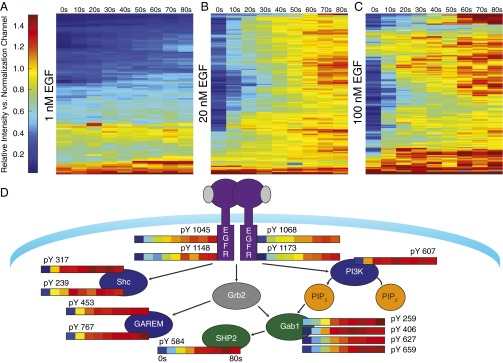
To investigate phosphorylation changes induced by growth factor stimulation, MCF-10A human mammary epithelial cells grown in 10-cm dishes were serum starved for 24 h before growth factor stimulation. EGF concentrations of 0.2, 0.4, 1, 2.5, 5, 10, 20, and 100 nM were determined from literature values and phenotypic response data (Fig. S1) (8, 11). Stimulation was initiated by direct addition of growth factor to media for 0, 10, 20, 30, 40, 50, 60, 70, or 80 s and terminated by rapid plate inversion to remove media and immediate placement on a bath of liquid nitrogen. Immediately after plates were removed from liquid nitrogen, cells were lysed by the addition of 8 M urea (Fig. 1). To assess the phosphorylation changes that may occur during freezing or lysis, control, nonstimulated cells and cells treated with 20 nM EGF for 60 s were left on liquid nitrogen for 1, 5, or 15 min before lysis with urea or frozen on liquid nitrogen for 1 min, followed by incubation in urea lysis buffer for 15 or 30 min. Phosphoproteomic analysis of these samples demonstrate no significant change in phosphorylation during these steps, indicating that phosphorylation is rapidly and irreversibly stopped by our freezing and lysis procedure (Fig. S2). Lysates were then processed to peptides, labeled with stable isotope mass tags, and combined. One of the 10 channels was reserved for a fraction of a pooled lysate common to all runs, which provided a normalization value to facilitate comparison between multiple runs. Tyrosine-phosphorylated peptides were enriched by sequential immunoprecipitation using three antiphosphotyrosine antibodies and immobilized metal affinity chromatography before analysis by data-dependent liquid chromatography tandem mass spectrometry (LC-MS/MS). Secondary fragmentation spectra provided peptide sequence information and precisely localized phosphorylation modifications on each peptide, while reporter ion intensities, representing the relative amount of peptide in each of the 10 channels, were extracted to quantify temporal dynamics of phosphorylation (Fig. 1 B and C). This approach yielded data on several hundred phosphorylation sites that occur on tryptic peptides amenable to LC-MS/MS analysis. Although not a complete list of all phosphorylation events in the network, they make up a representative fraction of many proteins implicated in EGFR signaling. Heat maps were used to visualize phosphorylation dynamics of peptides seen in multiple replicates for all eight of the ligand concentrations (Fig. 2 and Dataset S1).
Fig. S1.
MCF-10A proliferation responses to EGF stimulation. Proliferation rates measured with BrdU assay after 24 h treatment with serum-free media plus indicated concentrations of EGF compared with serum-free media and complete media.
Fig. 1.
Schematic of experimental workflow. (A) MCF-10A cells were serum-starved for 24 h and treated with 0.2, 0.4, 1, 2.5, 5, 10, 20, or 100 nM EGF for 0, 10, 20, 30, 40, 50, 60, 70, and 80 s. Pooled normalization lysate was stimulated with 20 nM EGF for 60 s. Proteins were processed to peptides, desalted, enriched for phosphotyrosine, and analyzed on a QExactive mass spectrometer. Sample secondary fragmentation spectrum used for (B) sequence assignment and (C) reporter ion quantification.
Fig. S2.
Phosphorylation levels remain constant through freezing and lysis procedure. MCF10A cells were serum starved for 24 h and then stimulated with 20 nM EGF for 60 s (gray) or left untreated (black). Residual signaling during liquid nitrogen freezing was assessed by leaving plates on liquid nitrogen (LN2) for 1, 5, or 15 min and then lysing with urea for 1 min before processing. Residual signaling during lysis was assessed by leaving plates in urea lysis buffer for 1, 15, or 30 min after freezing on LN2 for 1 min. Average phosphorylation levels and SDs for 32 peptides relative to mean of 10 conditions are plotted.
Fig. 2.
Heat map visualization of peptide dynamics. Peptide dynamics seen in (A) 1 nM, (B) 20 nM, or (C) 100 nM EGF stimulation conditions. Unique peptide dynamics represented by individual rows, clustered by Pearson correlation. Columns represent relative intensity at indicated points compared with a pooled normalization channel. (D) Selected dynamics of key signaling molecules in the EGFR signaling network. Proteins with coclustering phosphorylation sites are colored in green (Gab1, SHP2), blue (PI3K, Shc, GAREM), and purple (EGFR).
Self-Organizing Map Clustering Reveals Distinct Signaling Modules.
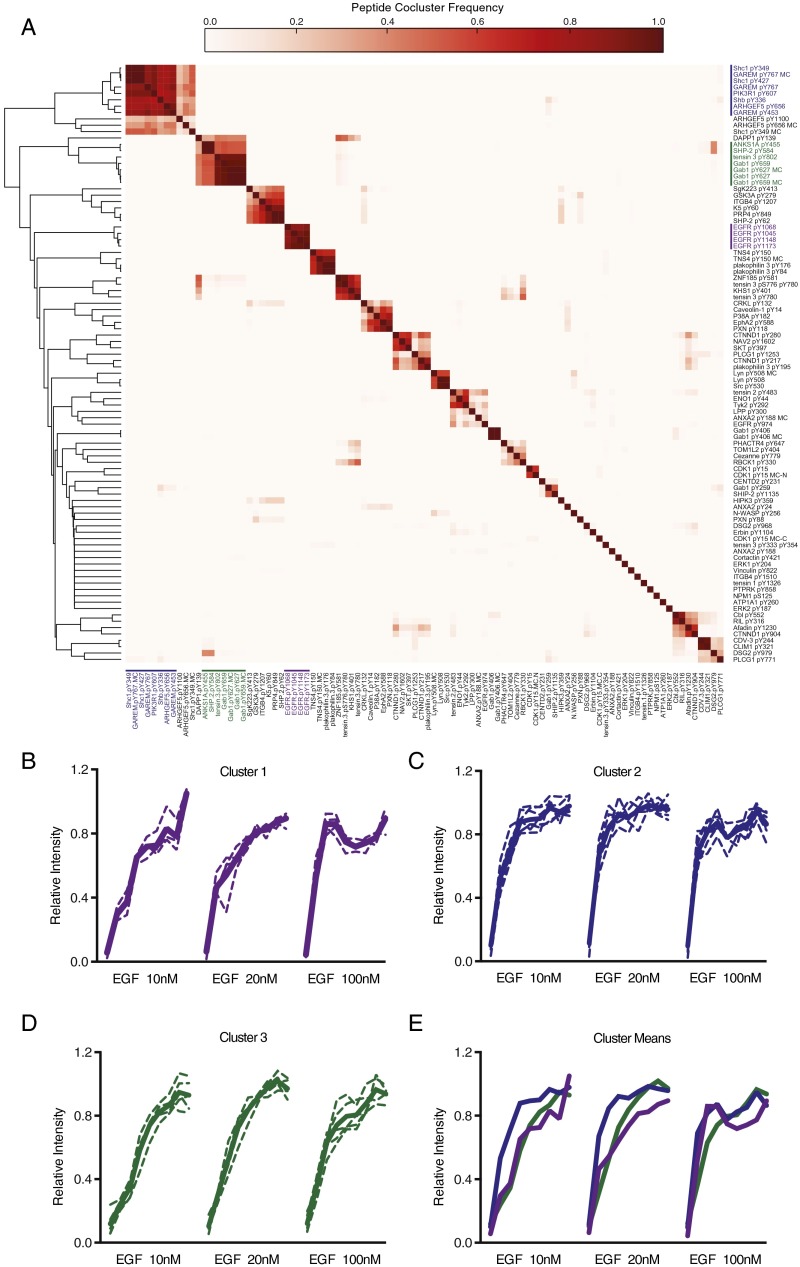
To identify sites with similar response patterns in the network, self-organizing maps (SOMs) were used. SOMs cluster self-similar patterns in complex data, including protein phosphorylation profiles (12). To correct for variability within single conditions while maximizing the number of phosphorylation sites seen across multiple conditions, phosphosite dynamics from the 10-, 20-, and 100-nM stimulation conditions were concatenated to create an input vector with 27 features (0–80 s for three conditions). These profiles were clustered by Pearson correlation 10,000 times, and the frequency with which peptides appeared in the same cluster provided a quantitative metric of similarity (Fig. S3A). One prominent feature of this analysis is the tight integration of four EGFR autophosphorylation sites (pY1045, pY1068, pY1148, and pY1173), which all appeared in the same cluster >85% of the time, without once clustering with any other peptide (Fig. S3B) (13, 14). Meanwhile, EGFR pY974, which has been shown to be distinctly regulated from the autophosphorylation sites, clustered separately (15).
Fig. S3.
SOM clustering analysis of EGF stimulated phosphopeptides. (A) Heat map showing frequency with which individual peptides appeared in the same cluster in 10,000 iterations of SOM clustering. Peptide clustering behaviors sorted by Pearson correlation. Individual clusters included (B) EGFR pY1045, EGFR pY1068, EGFR pY1148, EGFR pY1173; (C) Shc pY239, Shc pY317, GAREM pY453, GAREM pY767, PI3KR1 pY607, Arhgef5 pY656, Shb pY336; and (D) Gab1 pY627, Gab1 pY659, Tensin 3 pY802, ANKS1A pY455, SHP2 pY584. Individual dynamics plotted as dashed lines; cluster means plotted as solid lines. (E) Mean dynamics of clusters 1–3 plotted together.
Two additional groups that emerged contained many phosphorylation sites canonically implicated in the EGFR network. The first contained sites on the adaptor proteins Src homology 2 domain containing transforming protein (Shc), Grb2 associated and regulator of MAPK protein (GAREM), and Src homology 2 domain containing adaptor protein B (Shb), which serve to recruit additional proteins including growth-factor receptor-bound protein-2 (Grb2), a site on p85 alpha (PIK3R1), whose phosphorylation is thought to relieve inhibition of phosphoinositol 3-kinase (PI3K), and the nucleotide exchange factor Arhgef5 (Fig. S3C) (16). The abundance of these phosphopeptides is strongly increased at 10 s after stimulation, but plateau by ∼30 s, and remains relatively constant thereafter. The second cluster included Grb2-associated binder-1 (Gab1) Y627 and Y659, SH2-containing tyrosine phosphatase (SHP2) Y584, tensin 3 Y802, and Y455 on ANKS1A, a regulator of EGFR recycling (Fig. S3D) (17). When phosphorylated, the two sites observed on Gab1 form a binding motif for SHP2, necessary for extracellular signal-regulated kinase (ERK) activation (18). We observe minimal delay between the appearance of this binding motif and phosphorylation of SHP2 on Y584, a site associated with activation (19). Compared with the other clusters, these peptides show a more gradual change in phosphorylation at the earliest times measured, but continue increasing until they reach similar relative levels as EGFR and Shc by 60 s (Fig. S3E).
Measurement of Receptor-Adaptor Complex Formation.
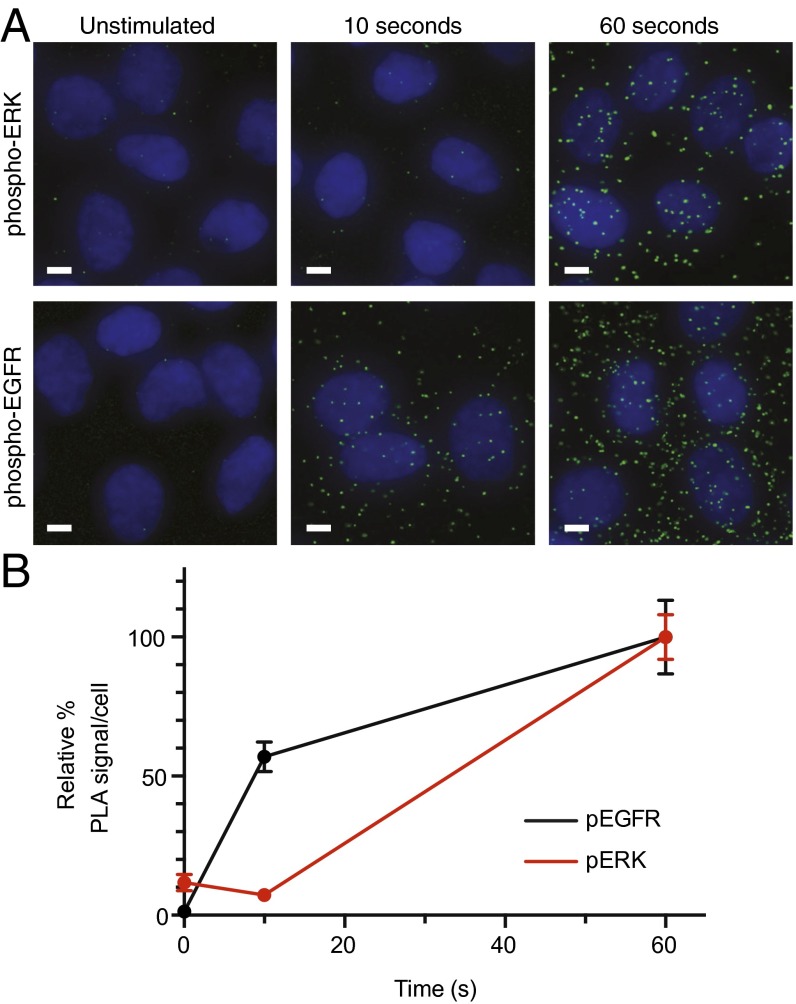
One candidate mechanism for the slower phosphorylation kinetics of Gab1 versus Shc is a difference in recruitment to the receptor. To test this hypothesis, proximity ligation assays (PLAs) were used to verify selected immediate early phosphorylation events in situ and quantify receptor–adaptor interactions with low-nanometer resolution in intact cells (20, 21). To measure early association events, cells seeded on glass coverslips were stimulated with 20 nM EGF for 0, 10, or 60 s; frozen on liquid nitrogen; and fixed in 4% paraformaldehyde for analysis. Orthogonal measurement of phosphorylation using PLA corroborates the previous observations of near-immediate phosphorylation of EGFR at 10 s, whereas ERK phosphorylation shows no increase at 10 s after stimulation. Meanwhile, both show strong activation at 60 s (Fig. S4). Imaging also confirmed uniform receptor dimerization patterns across the dish.
Fig. S4.
PLA measurement of network activation. Early dynamics of (A) EGFR phosphorylation and (B) ERK activation measured with PLA after 0-, 10-, and 60-s stimulation with 20 nM EGF.
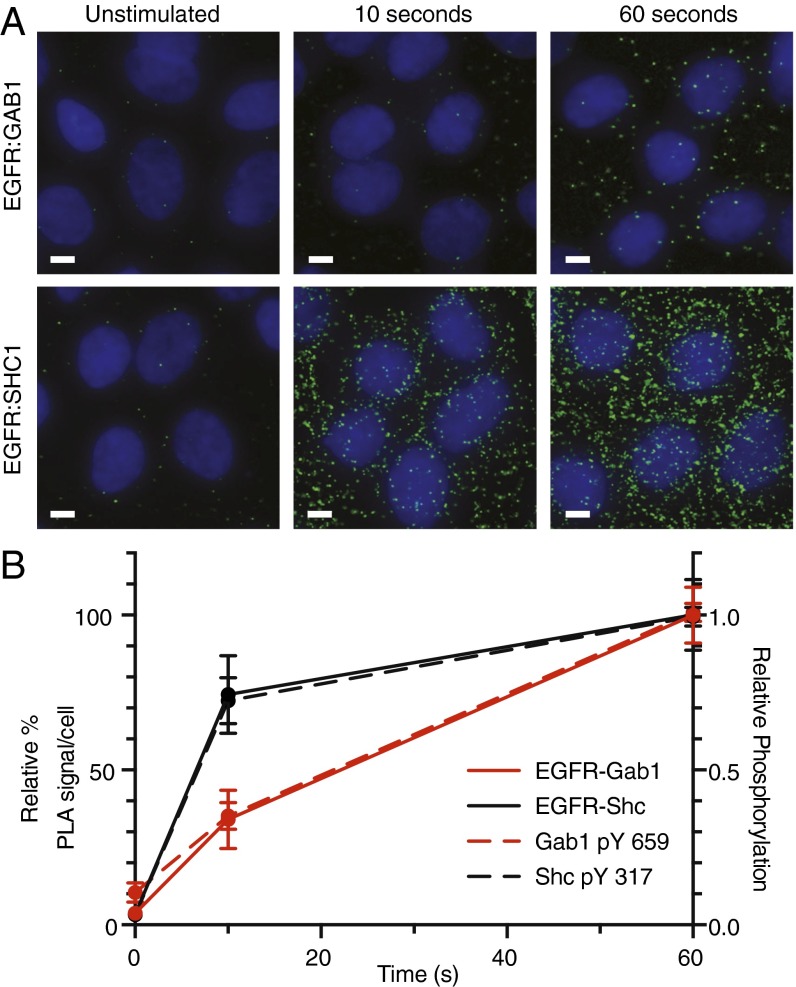
Endogenous pairwise interactions between EGFR–Shc and EGFR–Gab1 were then measured at 0, 10, and 60 s after 20-nM EGF stimulation (Fig. 3A). By 10 s, EGFR–Shc interactions had reached 74% of the level observed at 60 s, whereas EGFR-Gab1 complexes had reached a corresponding level of 34%. Intriguingly, receptor–adaptor proximity almost identically matched relative phosphorylation dynamics, suggesting recruitment mechanisms may be the dominant component governing early phosphorylation behaviors (Fig. 3B).
Fig. 3.
PLA measurements of EGFR-adaptor complex formation. (A) Early dynamics of EGFR-adaptor complex formation monitored with in situ PLA after 20 nM EGF treatment. Cells were identified with nuclear stain (DNA), and individual complexes were detected as distinct spots (green). Images are representative of replicate experiments. (Scale bars, 5 μm.) (B) Quantification of complex formation expressed as a fraction of 60-s measurement (solid), plotted with relative phosphorylation levels (dashed) for Gab1 (red) and Shc (black). Complex values represent mean ± SEM.
Role of Phosphatases in Early Signaling.
An intriguing feature observed at the phosphopeptide and protein complex level was the faster dynamics of Shc phosphorylation compared with EGFR phosphorylation, which was a counterintuitive result, as receptor phosphorylation would presumably precede recruitment and phosphorylation of adaptor proteins. One explanation for these patterns may be negative regulation by phosphatases, which may preferentially dephosphorylate receptor binding sites over adaptors, allowing more rapid accumulation of phosphorylation on Shc than EGFR.
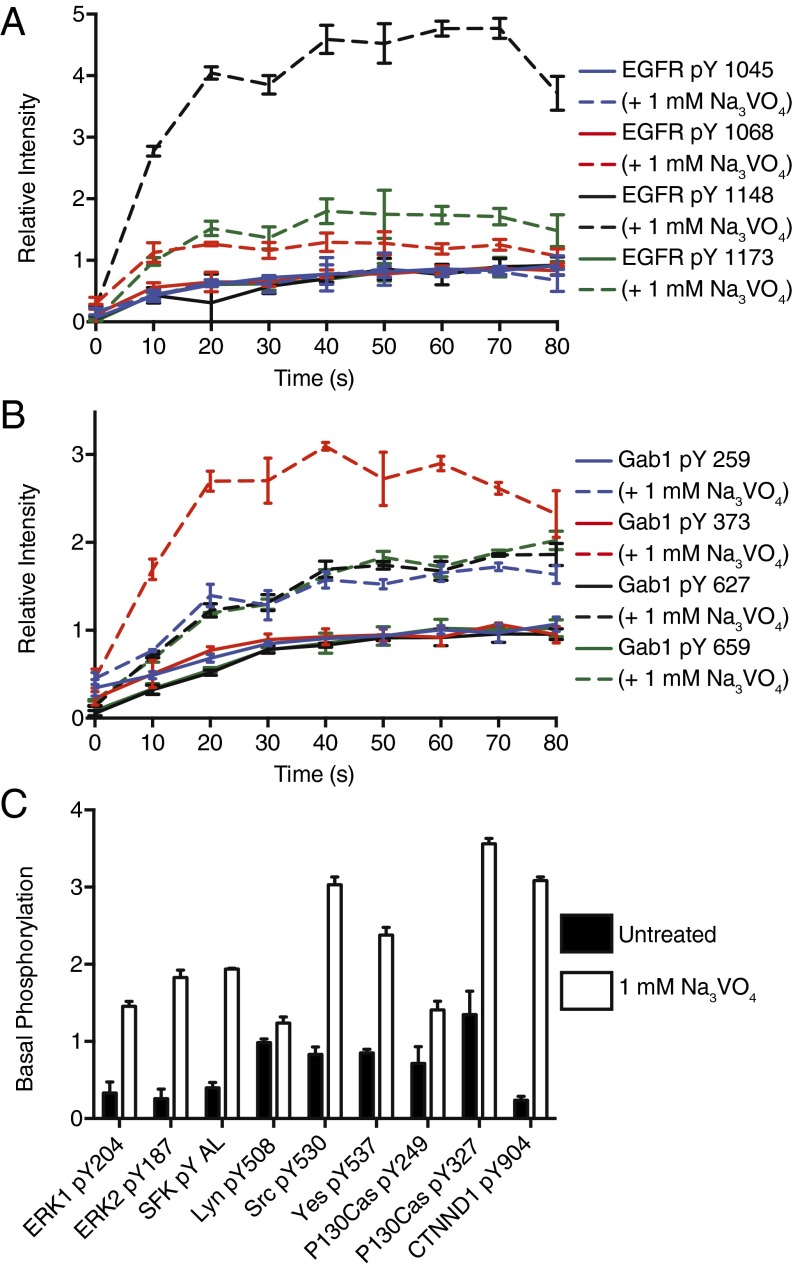
To investigate the role of phosphatases in early signaling, cells were treated with 1 mM activated sodium orthovanadate (Na3VO4), a pan-tyrosine phosphatase inhibitor, for 15 min before 20 nM EGF stimulation. Several hundred phosphorylation sites observed demonstrated significant changes in phosphorylation response (Dataset S1). On EGFR, basal levels of phosphorylation were unaffected by phosphatase inhibition, but dynamics on stimulation showed significant differences within 10 s after stimulation (Fig. 4A). Although the four autophosphorylation sites have similar temporal profiles in untreated cells, relative levels of pY1148 in the stimulated, vanadate-treated condition are much greater than levels on other sites, indicating specific phosphatase activity against this site. The relative maxima reached in the vanadate condition were ∼fivefold higher compared with the untreated condition, suggesting the highest levels in the 20 nM condition represent at most ∼20% of the receptor in the cell. In addition to changes on the receptor, Gab1 also shows site-specific phosphatase regulation. Although Y406, Y627, and Y659 all show similar magnitude changes with vanadate treatment, Y373 shows a much larger relative increase (Fig. 4B).
Fig. 4.
Tyrosine phosphatase inhibition alters many components of the network. Selected phosphorylation patterns in response to 20 nM EGF stimulation with (dashed) and without (solid) 15 min pretreatment with 1 mM Na3VO4 for (A) EGFR pY1045, pY1068, pY1148, and pY1173 and (B) Gab1 pY259, pY373, pY627, and pY659. (C) Phosphorylation levels for several peptides were significantly altered in the pretreated (white) condition compared with untreated (black) in the absence of EGF.
In contrast to proteins near the top of the network, levels of ERK phosphorylation were significantly higher in the vanadate-treated, unstimulated cells. Ligand-independent ERK activation could either be a result of basal ERK signaling that is continually repressed by phosphatases or vanadate-mediated activation of an alternative pathway for ERK phosphorylation. To this latter possibility, one candidate mechanism involves Src family kinases (SFKs), which are both positively and negatively regulated by phosphorylation (22). In vanadate-treated, unstimulated cells, phosphorylation levels on many SFK sites were elevated, along with several canonical Src substrates, such as p130Cas and delta catenin (Fig. 4C) (23, 24). These data suggest that SFKs are active in the absence of ligand, but are continually repressed by phosphatase activity in unstimulated cells.
Role of Src Family Kinases in Early Signaling.
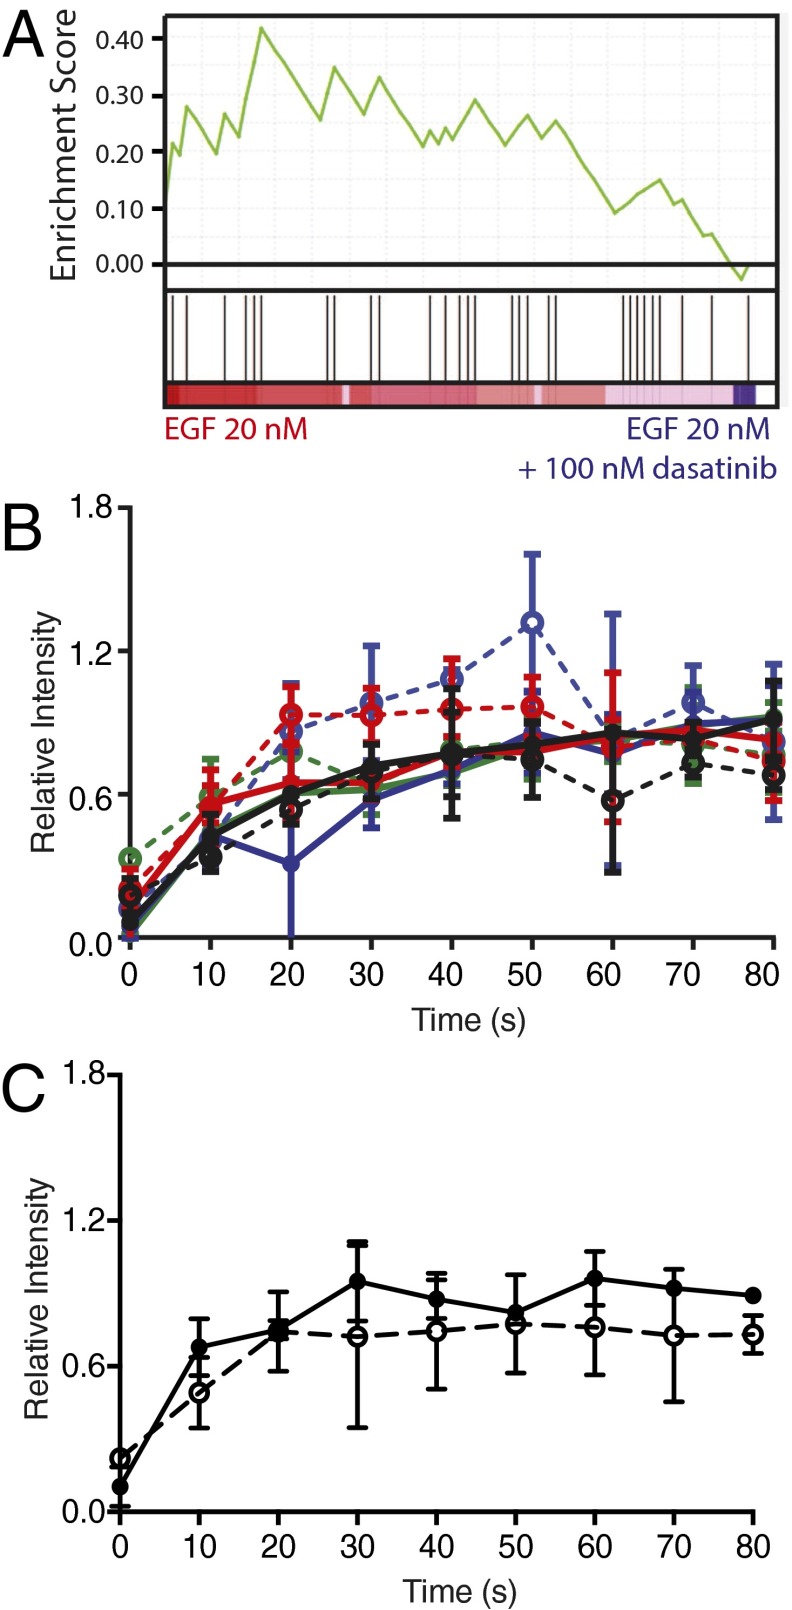
To explore the potential for Src kinase activity as a primed activating component of immediate EGFR signaling, MCF-10A cells were treated with dasatinib, a SFK inhibitor, at 100 nM for 15 min before 20 nM EGF stimulation. Phosphorylation of Src substrates was significantly decreased by inhibitor treatment, but receptor phosphorylation dynamics on Y1045, Y1068, Y1148, and Y1173 were not significantly changed, reinforcing their status as primarily autophosphorylation sites (Fig. S5 A and B). Shc pY317, thought to be primarily controlled by direct interaction with EGFR, also showed no significant changes in phosphorylation (Fig. S5C) (25).
Fig. S5.
Select modification of SFK substrates with dasatinib treatment. (A) GSEA shows enrichment score of 0.41 for altered phosphorylation of Src substrates with 100 nM dasatinib treatment. (B) EGFR pY1045 (black), pY1068 (red), pY1148 (blue), and pY1173 (green) and (C) Shc pY239 phosphorylation with (dashed) and without (solid) dasatinib treatment are not significantly affected.
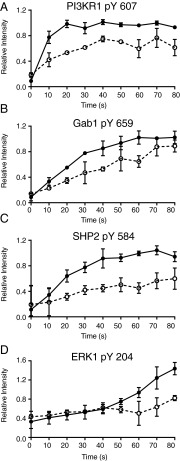
Despite apparently intact signaling through Shc, PI3KR1 phosphorylation is significantly impaired as early as 10 s by Src kinase inhibition (Fig. 5A). Likewise, phosphorylation on Gab1 and SHP2 are impaired in the early period after growth factor stimulation (Fig. 5 B and C). In addition to these upstream changes, ERK activation downstream is also impaired without SFK activity (Fig. 5D). These data indicate a necessary role for SFKs in activating select components of the EGFR signaling network immediately after ligand binding.
Fig. 5.
Dasatinib treatment alters phosphorylation patterns for several components of EGFR signaling. Phosphorylation patterns of peptides for (A) PI3KR1 pY607, (B) Gab1 pY659, (C) SHP2 pY584, and (D) ERK1 pY204 in response to 20 nM EGF stimulation with (dashed) and without (solid) 15 min pretreatment with 100 nM dasatinib.
Discussion
Because of its implication in human disease and broad control over cellular behavior, the EGFR signaling network has been one of the most extensively studied systems in biology. Recently, systems biology has provided tools that offer increasing coverage of network behavior. However, much of these data are projected onto a framework derived from traditional biochemical studies. Although knowledge of binary interactions between network proteins has been useful, they often obscure the emergent features that arise when the network is examined as a whole. To shed light on the functional characteristics of the network, we report the first systems-level measurement, to our knowledge, of the EGFR signaling network at 10-s resolution in adherent epithelial cells in response to eight different ligand concentrations. This method builds on previous mass spectrometric analyses by incorporating a flash-freezing step to precisely terminate signaling with no residual phosphorylation changes.
In addition to rapid responses seen on EGFR and proximal adaptor proteins, we observed phosphorylation changes within 10 s on proteins such as cortactin, plakophilin, and tensin, all proteins not known to be directly regulated by the receptor (Dataset S1). Early phosphorylation on these cytoskeletal components may explain the rapid phenotypic responses observed in membrane protrusion. Rapid downstream phosphorylation changes challenge the preconceived timing of signaling, where receptors and adaptor proteins are phosphorylated and initiate signaling cascades that occur on the timeframe of minutes, and instead indicate a system capable of disseminating information almost immediately across many regions of the network, with specific regulatory mechanisms that tightly control the dynamics of protein phosphorylation.
One of these mechanisms, initially uncovered through clustering via SOMs, appears to be recruitment to the receptor. Through a combination of temporal phosphorylation profiling and PLA, we have shown that Gab1 and Shc phosphorylation dynamics are nearly identical to the speed with which these proteins become proximal to the receptor, implying that the rate-limiting step in adaptor phosphorylation is physical association with the receptor. This observation also may imply that the EGFR kinase domain does not have significant substrate-selective catalytic activity. One of the proteins observed to behave similarly to Shc is GAREM, an adaptor protein recruited to EGFR through interaction with the SH3 domain of Grb2 (26). Although Gab1 is also capable of being recruited to EGFR through interaction with Grb2, GAREM phosphorylation occurs more rapidly than Gab1, suggesting that Grb2 recruitment to the receptor may not be the limiting factor in Gab1 phosphorylation. Instead, an alternative mechanism, PIP3 interaction with the PH domain of Gab1, may be the primary mode of recruiting Gab1 to the membrane, where it can interact with the receptor (27).
Recruitment is not necessarily the rate-limiting step for phosphorylation of all proteins in the network. For instance, temporal phosphorylation profiles for pY627 and pY659 on Gab1 and pY584 on SHP2 were identical, despite previous reports suggesting that Gab1 phosphorylation on these sites was required for SHP2 recruitment to the receptor complex.
Our data indicate a prominent and site-selective role for tyrosine phosphatases in mediating the immediate–early signaling events after receptor activation. Although inhibition of tyrosine phosphatase activity has minimal effect on the basal levels of phosphorylation on EGFR and Gab1, the temporal response to stimulation of selected sites in the network was significantly affected by vanadate treatment. Maximum phosphorylation levels of EGFR pY1148 increased by fivefold in stimulated, vanadate-treated cells relative to stimulated control cells, whereas other EGFR sites only showed an ∼twofold increase. Coupling the vanadate results with previous stoichiometry data, which have shown pY1148 to be ∼threefold more phosphorylated compared with other sites on the receptor, indicates that phosphorylation of other sites, such as EGFR pY1173, represents no more than 10% of the total receptor population, even under saturating ligand conditions (28).
Gab1 pY373 appears to be more strongly targeted by phosphatase activity compared with other Gab1 sites. It is also the only observed Gab1 site that contains the consensus binding motif for RasGAPs (pY-X-X-P), which oppose ERK activation. Previous work has shown specific phosphatase activity against such binding sites, which may explain the observed changes (29).
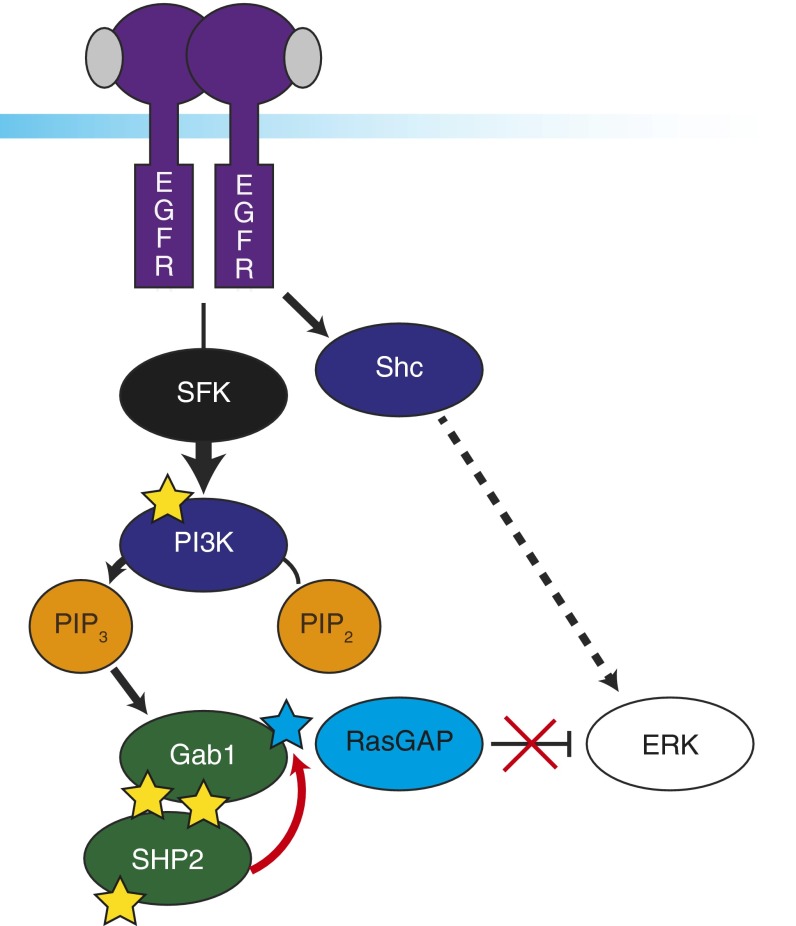
Coupling our high-temporal-resolution measurements with inhibition of Src-family kinases with dasatinib uncovered a mechanistic connection between SFKs and ERK activation. In cells treated with dasatinib, Gab1 phosphorylation response to stimulation was significantly decreased, suggesting its recruitment may be affected by SFK activity. As mentioned previously, Gab1 interaction with EGFR may be limited by PIP3-mediated recruitment to the membrane. Correspondingly, we observe decreased phosphorylation of PI3K in stimulated, dasatinib-treated cells. Together, these data highlight a pathway in which EGFR activation leads to increased SFK activity, resulting in phosphorylation of PI3K within 10 s. Increased PI3K activity increases PIP3 levels, recruiting Gab1 to the membrane, where it can interact with EGFR and be phosphorylated. SFK inhibition leads to loss of this pathway, decreased phosphorylation of pY627 and pY659, and SHP2 pY584. Without SHP2 activity to eliminate RasGAP binding sites, ERK shows significantly impaired activation at 80 s in dasatinib-treated, stimulated cells (Fig. 6). We propose that both Shc and SFK-mediated, PI3K/PIP3-associated Gab1 recruitment are necessary for full activation of the ERK MAPKs.
Fig. 6.
Proposed mechanism for full ERK activation. Proposed mechanism for full ERK signaling includes SFK-independent activation through EGFR and Shc, whereas SFK is necessary for signaling from EGFR to PI3K. Amplified PI3K activity is responsible for driving Gab1 recruitment to the membrane via PIP3. Gab1 phosphorylation creates a docking site for SHP2 to dephosphorylate RasGAP binding sites (blue star), potentially including Y373 on Gab1. Only combined activation through Shc and dephosphorylation of RasGAP binding sites through PI3K-Gab1-SHP2 result in full ERK activity.
These proposed mechanisms for signaling are derived from combining improved temporal resolution with select network perturbations. The method outlined here allows for the examination of specific biochemical hypotheses in the context of the full signaling network, which will provide a more comprehensive, functional understanding of network behavior. The platform is applicable for a variety of cell types, including those that express multiple members of the ErbB family, and can also be used to query the mechanistic effects of small molecules and biologics. Combining the methods described here with new genetic engineering techniques will further allow for the in vivo characterization of specific phosphorylation sites in the whole network. With improved tools for making measurements that clarify complex biology, it is our hope that this process may improve our understanding of signaling systems.
Methods
MCF-10A cells were maintained in Complete Media, as in ref. 28. Cells were serum-starved for 24 h before stimulation with EGF dissolved in water for 0, 10, 20, 30, 40, 50, 60, 70, or 80 s. The common pooled normalization channel was treated with 20 nM EGF for 60 s. Lysates were processed to peptides, labeled with TMT 10-plex, combined, and immunoprecipitated as descried previously (28). After elution from immunoprecipitation, a second round of enrichment was performed by immobilized metal affinity chromatography. Peptides eluted from immobilized metal affinity chromatography were analyzed by ESI LC-MS/MS on a QExactive Mass Spectrometer (Thermo Scientific) operated in information-dependent acquisition mode, as described in ref. 12. Raw mass spectral data files were searched against SwissProt database containing Homo sapiens protein sequences using Mascot version 2.4. MS/MS spectra of phosphorylated peptides observed in multiple biological replicates were validated using computer-assisted manual validation (CAMV) software to confirm phosphorylation assignment and isolation purity (30). From accepted scans, reporter ion quantification was extracted, isotope corrected, and normalized based on median relative protein quantification ratios.
SI Methods
Cell Culture and EGF Stimulation.
MCF-10A cells (originally from Brugge laboratory at Harvard Medical School) were cultured in 1:1 DMEM:F12 supplemented with 5% (vol/vol) horse serum, 20 ng/mL EGF, 10 μg/mL insulin, 0.5 mg/mL hydrocortisone, 100 ng/mL cholera toxin, and 1% penicillin/streptomycin in a 5% CO2 incubator at 37 °C. Cells in 10-cm tissue culture plates at 80% confluency were washed with PBS and incubated for 24 h in starve media (without horse serum, EGF, or insulin) before stimulation. Pretreatment with 100 nM dasatinib (LC Laboratories) or 1 mM activated sodium orthovanadate was conducted for 15 min at 37 °C before growth factor stimulation. Cells were stimulated with growth factor added directly to starve media at 0.2, 0.4, 1, 2.5, 5, 10, 20, 100 nM EGF for 10, 20, 30, 40, 50, 60, 70, or 80 s or left untreated. To terminate stimulation, media were rapidly discarded by inversion of cell culture plates, and plates were immediately placed on a bath of liquid nitrogen.
Cell Lysis and Protein Digestion.
After freezing on liquid nitrogen, plates were removed and placed at room temperature, where cells were lysed with 1 mL of 8 M urea. Lysates from several plates stimulated with 20 nM EGF for 60 s were combined to create a pooled normalization sample. A bicinchoninic acid (BCA) assay (Pierce) was used to assess protein concentration, and 400 μg protein (∼250 μL lysate) was reduced with 10 mM DTT in ammonium acetate at pH 8.9 for 1 h at 56 °C, reduced with 55 mM iodoacetamide in ammonium acetate pH 8.9 for 1 h at room temperature, and diluted to a final volume of 935 μL with 100 mM ammonium acetate at pH 8.9. Each sample received 25 μg of sequencing-grade trypsin (Promega) and was digested overnight at room temperature. Samples were acidified with 100 μL 98% (vol/vol) TFA and loaded onto C18 SpinTips (Protea), where they were desalted with 0.1% TFA and eluted in 200 μL 40% (vol/vol) MeCN in 0.1% TFA. Eluted peptides were frozen in liquid nitrogen for 5 min, lyophilized for 8 h, and stored at −80 °C.
TMT Labeling and Peptide IP.
Lyophilized peptides were labeled with TMT10plex Mass Tag Labeling Kits (Thermo). Nine experimental conditions (0–80 s) and one normalization channel (from pooled sample) were resuspended in 100 μL of 70% (vol/vol) ethanol, 30% (vol/vol) 0.5 M triethylammoniumbicarbonate at pH 8.5, and incubated with TMT reagent resuspended in 40 μL anhydrous acetonitrile at room temperature for 1 h. The samples were concentrated to ∼40 μL, combined, and concentrated to dryness. Dried samples were resuspended in 400 μL IP buffer (100 mM Tris⋅HCl, 1% Nonidet P-40 at pH 7.4) and added to 60 μL protein G agarose beads conjugated with 12 μg 4G10 (Millipore), 12 μg PY-100 (Cell Signaling Technologies), and 12 μg PT-66 (Sigma) overnight at 4 °C. Beads were spun down for 60 s at 4,000 × g for supernatant collection, washed once with 400 μL IP buffer, and washed three times with 400 μL wash buffer (100 mM Tris⋅HCl at pH 7.4). Peptides were eluted with 70 μL 100 mM glycine at pH 2.5 for 30 min at room temperature and acidified with 10 μL 10% (vol/vol) TFA.
Immobilized Metal Affinity Chromatography Purification.
Next, 200-μL NTA Agarose beads were rinsed with 800 μL 100 mM EDTA at pH 8.9 for 30 min, washed three times with 800 μL ultrapure water, and charged with iron by incubating in 800 μL 100 mM FeCl3 for 45 min. Excess iron was removed by three washes with ultrapure water, followed by acidification with two washes of 0.1% TFA before loading the IP elution for 1 h at room temperature. Nonspecific peptides were removed with two 400-μL washes with 0.1% TFA and two washes of 0.1% acetic acid. Bound peptides were eluted with 250 mM NaH2PO4 and loaded onto a precolumn [100 μm ID × 10 cm packed with 10 μm C18 beads (YMC gel, ODS-A, 12 nm, S-10 μm, AA12S11)], which was rinsed with 0.2 M acetic acid for 10 min before LC-MS analysis.
LC-MS/MS.
The washed precolumn was connected in series with a self-packed analytical capillary column [50 μm ID × 12 cm packed with 5 μm C18 beads (YMC gel, ODS-AQ, 12 nm, S-5 μm, AQ12S05)] with an integrated electrospray tip (∼1 μm orifice). Peptides were eluted using a 140-min gradient from aqueous (0.2 M acetic acid) to organic [0.2 M acetic acid, 70% (vol/vol) MeCN] at a flow rate of 0.2 μL/min with a flow split >99%. Peptides were ionized with a spray voltage of 2 kV and injected directly into a Thermo Q Exactive Hybrid Quadrupole-Orbitrap mass spectrometer. The 15 most abundant precursor peaks were selected in information-dependent acquisition mode with an isolation width of 2 m/z, an AGC target of 3e6, a maximum injection time of 350 ms, and previously selected peaks excluded for 30 s.
Phosphotyrosine Data Analysis.
Raw mass spectral data files were searched against SwissProt database containing Homo sapiens protein sequences (20,199 sequences), using Mascot version 2.4 (Matrix Science). MS/MS spectra of tyrosine phosphorylated peptides seen in multiple biological replicates were validated using CAMV (27). TMT reporter quantification was extracted and isotope corrected using Proteome Discoverer software (Thermo) and was further normalized based on median relative protein quantification ratios obtained from total protein expression analysis. For each peptide, relative quantification was represented as a ratio between ion intensities for experimental conditions and normalization channel.
SOMs.
The SOM clustering method was used to identify peptides that showed similar phosphorylation dynamics. The analysis was performed in MATLAB with the Neural Network Toolbox (Mathworks). Each analysis clustered 93 peptides seen in 10, 20, and 100 nM EGF stimulated conditions by Pearson correlation into a 7 × 7 hexagonal pattern of neurons. This process was repeated 10,000 times, and the frequency with which all pairs of peptides appeared in the same cluster was analyzed.
In Situ Proximity Ligation Detection of Protein Phosphorylation and EGFR–Adaptor Complexes.
MCF-10A cells were grown to 80% confluency on glass coverslips placed in 6-cm tissue culture plates. Cells were washed with phosphate-buffered saline (PBS) and incubated with phenol red free DMEM:F12 starve media for 24 h before stimulation with 20 nM EGF for 10 or 60 s. Stimulation was terminated as described earlier. Frozen plates were fixed in ice-cold 4% (vol/vol) paraformaldehyde for 15 min. Reaction areas of ∼1 cm3 were delimited on coverslips using an ImmEdge wax pen (Vector Laboratories). Cells were permeabilized with 0.1% Triton X-100 in PBS for 3 min. To minimize nonspecific adsorption of proximity probes, fixed cells were incubated in 1× blocking solution [1× Tris-buffered saline (TBS), 10% (vol/vol) sterile filtered goat serum, and 2.5 ng/μL sonicated salmon sperm DNA] for 45 min at 37 °C in a humidified chamber. Cells were then incubated overnight at 4 °C with primary antibodies diluted in PLA probe solution (1× blocking solution, 0.05% Tween-20). Mouse anti-EGFR (1:400, clone 13G8, Millipore) and rabbit anti-pEGFR1068 (1:400, Cell Signaling) were used for EGFR phosphorylation, as described previously (20), and rabbit anti-phosphoERK1/2 (T202/Y204) (1:600, D13.14.4E, Cell Signaling) for pERK1/2 single recognition PLA. Mouse anti-EGFR (1:1,000, clone 13G8, Millipore) and rabbit anti-Gab1 (1:100, catalog SAB4501060, Sigma) were used for EGFR-Gab1 PLA, or rabbit anti-EGFR (1:200, clone E235, Millipore) and mouse anti-Shc1 (1:200, clone 30, BD Biosciences) for EGFR-Shc1 PLA. Unbound primary antibodies were removed by washing three times for 5 min in TBST (1× TBS with 0.05% Tween-20). Secondary proximity probes were prepared by hydrazine linkage-mediated conjugation of aldehyde-modified oligonucleotides to either donkey anti-rabbit or donkey anti-mouse affinity purified antibodies to generate mouse MINUS, mouse PLUS, rabbit MINUS, and rabbit PLUS probes. Cells were incubated for 60 min at 37 °C with appropriate species-specific MINUS and PLUS proximity probes diluted 1:500 in PLA probe solution. Unbound proximity probes were removed by washing three times for 5 min in TBST. A circular DNA priming template was generated by addition of 125 nM connector oligonucleotides (connector 1: 5′-phosphate-CTA TTA GCG TCC AGT GAA TGC GAG TCC GTC TAA GAG AGT AGT ACA GCA GCC GTC AAG AGT GTC TA; connector 2: 5′-phosphate-GTT CTG TCA TAT TTA AGC GTC TTA A) in hybridization/ligation mixture (10 mM Tris acetate at pH 7.4, 10 mM magnesium acetate, 50 mM potassium acetate, 250 mM NaCl, 0.25 μg/μL BSA, 0.05% Tween-20, 1 mM ATP, 0.05 unit/μL T4 DNA ligase) for 30 min at 37 °C. Residual hybridization/ligation mixture was removed by washing twice for 5 min in TBST. Rolling circle amplification was performed by addition of 0.125 unit/μL Φ-29 DNA polymerase in amplification buffer (33 mM Tris acetate at pH 7.9, 10 mM magnesium acetate, 66 mM potassium acetate, 0.25 μg/μL BSA, 0.1% Tween-20, 1 mM DTT, 250 μM dNTP) for 100 min at 37 °C. Residual amplification mixture was removed by washing twice for 5 min in TBST. PLA products were detected by hybridization of 25 nM fluorescence-labeled detection probe (5′-Alexa 488-CAG TGA ATG CGA GTC CGT CT) in detection buffer (1× SSC at pH 7, 0.25 μg/μL BSA, 0.05% Tween-20, 1 μM Hoechst 33342) for 60 min at 37 °C. Last, the coverslips were washed twice for 5 min in TBST and 5 min in TBS before mounting on microscope slides with Vectashield (Vector Laboratories).
Quantitative Image Analysis of EGFR–Adaptor Complexes.
Samples were examined on an Olympus IX-71 epifluorescent microscope with an automated NanoMotion stage equipped with a CoolSnapHQ CCD camera (DeltaVision, GE Life Sciences), using a 60× 1.4 NA Plan Apochromat oil-immersion objective and a computer-controlled filter wheel with excitation and emission filters for visualization of DAPI, and FITC. Z-stack (1.0 μm slices) images were collected from several fields of view per condition per experiment and maximum-intensity projections were generated using softWoRx acquisition software (version 6.1.3, GE Life Sciences). Image analysis and PLA quantitation was performed using a custom CellProfiler2.0 semiautomated analysis pipeline. Briefly, cells were identified from the Hoechst nuclear stain channel and used to delineate approximate cellular quantification boundaries. Images underwent enhancement of point-like PLA signals, using the EnhanceOrSuppressFeatures module and identification of PLA signals using Otsu Global 3-class thresholding with the IdentifyPrimaryObjects module. Typically, >100 cells per condition were quantified. Mean values ± SEM are presented from quantitation of independent replicate experiments. Merged fluorescent images were created by pseudocoloring of captured channels and overlaying in CellProfiler2.0.
Supplementary Material
Acknowledgments
We thank members of the F.M.W. and Gertler Laboratories for helpful discussions. This work was supported in part by NIH Grants U54CA112967, R01CA118705, and R01CA096504. R.J.R. is supported by the NIH Biotechnology Training Grant T32GM008334.
Footnotes
The authors declare no conflict of interest.
This article is a PNAS Direct Submission.
Data deposition: The raw mass spectrometry data reported in this paper have been deposited in the PRIDE (Proteomics Identifications) database, www.ebi.ac.uk/pride/archive/ (accession no. PXD003660).
This article contains supporting information online at www.pnas.org/lookup/suppl/doi:10.1073/pnas.1521288113/-/DCSupplemental.
References
- 1.Schlessinger J. Cell signaling by receptor tyrosine kinases. Cell. 2000;103(2):211–225. doi: 10.1016/s0092-8674(00)00114-8. [DOI] [PubMed] [Google Scholar]
- 2.Sibilia M, et al. The epidermal growth factor receptor: From development to tumorigenesis. Differentiation. 2007;75(9):770–787. doi: 10.1111/j.1432-0436.2007.00238.x. [DOI] [PubMed] [Google Scholar]
- 3.Morris MK, Chi A, Melas IN, Alexopoulos LG. Phosphoproteomics in drug discovery. Drug Discov Today. 2014;19(4):425–432. doi: 10.1016/j.drudis.2013.10.010. [DOI] [PubMed] [Google Scholar]
- 4.Zheng Y, et al. Temporal regulation of EGF signalling networks by the scaffold protein Shc1. Nature. 2013;499(7457):166–171. doi: 10.1038/nature12308. [DOI] [PMC free article] [PubMed] [Google Scholar]
- 5.Kirouac DC, et al. Computational modeling of ERBB2-amplified breast cancer identifies combined ErbB2/3 blockade as superior to the combination of MEK and AKT inhibitors. Sci Signal. 2013;6(288):ra68–ra68. doi: 10.1126/scisignal.2004008. [DOI] [PubMed] [Google Scholar]
- 6.Wolf-Yadlin A, et al. Effects of HER2 overexpression on cell signaling networks governing proliferation and migration. Mol Syst Biol. 2006;2:54. doi: 10.1038/msb4100094. [DOI] [PMC free article] [PubMed] [Google Scholar]
- 7.Philippar U, et al. A Mena invasion isoform potentiates EGF-induced carcinoma cell invasion and metastasis. Dev Cell. 2008;15(6):813–828. doi: 10.1016/j.devcel.2008.09.003. [DOI] [PMC free article] [PubMed] [Google Scholar]
- 8.Dengjel J, et al. Quantitative proteomic assessment of very early cellular signaling events. Nat Biotechnol. 2007;25(5):566–568. doi: 10.1038/nbt1301. [DOI] [PubMed] [Google Scholar]
- 9.Chylek LA, et al. Phosphorylation site dynamics of early T-cell receptor signaling. PLoS One. 2014;9(8):e104240. doi: 10.1371/journal.pone.0104240. [DOI] [PMC free article] [PubMed] [Google Scholar]
- 10.Yeh LH, et al. Shear-induced tyrosine phosphorylation in endothelial cells requires Rac1-dependent production of ROS. Am J Physiol. 1999;276(4 Pt 1):C838–C847. doi: 10.1152/ajpcell.1999.276.4.C838. [DOI] [PubMed] [Google Scholar]
- 11.Kholodenko BN, Demin OV, Moehren G, Hoek JB. Quantification of short term signaling by the epidermal growth factor receptor. J Biol Chem. 1999;274(42):30169–30181. doi: 10.1074/jbc.274.42.30169. [DOI] [PubMed] [Google Scholar]
- 12.Zhang Y, et al. Time-resolved mass spectrometry of tyrosine phosphorylation sites in the epidermal growth factor receptor signaling network reveals dynamic modules. Mol Cell Proteomics. 2005;4(9):1240–1250. doi: 10.1074/mcp.M500089-MCP200. [DOI] [PubMed] [Google Scholar]
- 13.Sorkin A, Helin K, Waters CM, Carpenter G, Beguinot L. Multiple autophosphorylation sites of the epidermal growth factor receptor are essential for receptor kinase activity and internalization. Contrasting significance of tyrosine 992 in the native and truncated receptors. J Biol Chem. 1992;267(12):8672–8678. [PubMed] [Google Scholar]
- 14.Thelemann A, et al. Phosphotyrosine signaling networks in epidermal growth factor receptor overexpressing squamous carcinoma cells. Mol Cell Proteomics. 2005;4(4):356–376. doi: 10.1074/mcp.M400118-MCP200. [DOI] [PubMed] [Google Scholar]
- 15.Schulze WX, Deng L, Mann M. Phosphotyrosine interactome of the ErbB-receptor kinase family. Mol Syst Biol. 2005;1(1):0008. doi: 10.1038/msb4100012. [DOI] [PMC free article] [PubMed] [Google Scholar]
- 16.Cuevas BD, et al. Tyrosine phosphorylation of p85 relieves its inhibitory activity on phosphatidylinositol 3-kinase. J Biol Chem. 2001;276(29):27455–27461. doi: 10.1074/jbc.M100556200. [DOI] [PubMed] [Google Scholar]
- 17.Tong J, et al. Odin (ANKS1A) modulates EGF receptor recycling and stability. PLoS One. 2013;8(6):e64817. doi: 10.1371/journal.pone.0064817. [DOI] [PMC free article] [PubMed] [Google Scholar]
- 18.Cunnick JM, Mei L, Doupnik CA, Wu J. Phosphotyrosines 627 and 659 of Gab1 constitute a bisphosphoryl tyrosine-based activation motif (BTAM) conferring binding and activation of SHP2. J Biol Chem. 2001;276(26):24380–24387. doi: 10.1074/jbc.M010275200. [DOI] [PubMed] [Google Scholar]
- 19.Araki T, Nawa H, Neel BG. Tyrosyl phosphorylation of Shp2 is required for normal ERK activation in response to some, but not all, growth factors. J Biol Chem. 2003;278(43):41677–41684. doi: 10.1074/jbc.M306461200. [DOI] [PubMed] [Google Scholar]
- 20.Gajadhar AS, Bogdanovic E, Muñoz DM, Guha A. In situ analysis of mutant EGFRs prevalent in glioblastoma multiforme reveals aberrant dimerization, activation, and differential response to anti-EGFR targeted therapy. Mol Cancer Res. 2012;10(3):428–440. doi: 10.1158/1541-7786.MCR-11-0531. [DOI] [PubMed] [Google Scholar]
- 21.Söderberg O, et al. Direct observation of individual endogenous protein complexes in situ by proximity ligation. Nat Methods. 2006;3(12):995–1000. doi: 10.1038/nmeth947. [DOI] [PubMed] [Google Scholar]
- 22.Roskoski R., Jr Src kinase regulation by phosphorylation and dephosphorylation. Biochem Biophys Res Commun. 2005;331(1):1–14. doi: 10.1016/j.bbrc.2005.03.012. [DOI] [PubMed] [Google Scholar]
- 23.He Y, et al. C-Src-mediated phosphorylation of δ-catenin increases its protein stability and the ability of inducing nuclear distribution of β-catenin. Biochim Biophys Acta. 2014;1843(4):758–768. doi: 10.1016/j.bbamcr.2013.12.021. [DOI] [PMC free article] [PubMed] [Google Scholar]
- 24.Pellicena P, Miller WT. Processive phosphorylation of p130Cas by Src depends on SH3-polyproline interactions. J Biol Chem. 2001;276(30):28190–28196. doi: 10.1074/jbc.M100055200. [DOI] [PubMed] [Google Scholar]
- 25.Batzer AG, Rotin D, Ureña JM, Skolnik EY, Schlessinger J. Hierarchy of binding sites for Grb2 and Shc on the epidermal growth factor receptor. Mol Cell Biol. 1994;14(8):5192–5201. doi: 10.1128/mcb.14.8.5192. [DOI] [PMC free article] [PubMed] [Google Scholar]
- 26.Tashiro K, et al. GAREM, a novel adaptor protein for growth factor receptor-bound protein 2, contributes to cellular transformation through the activation of extracellular signal-regulated kinase signaling. J Biol Chem. 2009;284(30):20206–20214. doi: 10.1074/jbc.M109.021139. [DOI] [PMC free article] [PubMed] [Google Scholar]
- 27.Rodrigues GA, Falasca M, Zhang Z, Ong SH, Schlessinger J. A novel positive feedback loop mediated by the docking protein Gab1 and phosphatidylinositol 3-kinase in epidermal growth factor receptor signaling. Mol Cell Biol. 2000;20(4):1448–1459. doi: 10.1128/mcb.20.4.1448-1459.2000. [DOI] [PMC free article] [PubMed] [Google Scholar]
- 28.Curran TG, Zhang Y, Ma DJ, Sarkaria JN, White FM. MARQUIS: A multiplex method for absolute quantification of peptides and posttranslational modifications. Nat Commun. 2015;6:5924. doi: 10.1038/ncomms6924. [DOI] [PMC free article] [PubMed] [Google Scholar]
- 29.Montagner A, et al. A novel role for Gab1 and SHP2 in epidermal growth factor-induced Ras activation. J Biol Chem. 2005;280(7):5350–5360. doi: 10.1074/jbc.M410012200. [DOI] [PubMed] [Google Scholar]
- 30.Curran TG, Bryson BD, Reigelhaupt M, Johnson H, White FM. Computer aided manual validation of mass spectrometry-based proteomic data. Methods. 2013;61(3):219–226. doi: 10.1016/j.ymeth.2013.03.004. [DOI] [PMC free article] [PubMed] [Google Scholar]
Associated Data
This section collects any data citations, data availability statements, or supplementary materials included in this article.


