Significance
It has long been thought that sleep and mood are intimately connected in humans, but at present there are no known molecular links. We identified rare variants in the PERIOD3 gene in persons with both altered sleep behavior and features of seasonal affective disorder. We show that these variants recapitulate circadian and mood phenotypes in mouse models. Although we were not able to test mood in fruit flies, we did uncover a sleep trait similar to that seen in humans in flies carrying the human variants. Our molecular studies reveal that the variants led to less stable PER3 protein and reduced the stabilizing effect of PER3 on PER1/PER2, providing a mechanistic explanation for the circadian trait.
Keywords: circadian clock, circadian rhythms, familial advanced sleep phase, seasonal affective disorder, PER3
Abstract
In humans, the connection between sleep and mood has long been recognized, although direct molecular evidence is lacking. We identified two rare variants in the circadian clock gene PERIOD3 (PER3-P415A/H417R) in humans with familial advanced sleep phase accompanied by higher Beck Depression Inventory and seasonality scores. hPER3-P415A/H417R transgenic mice showed an altered circadian period under constant light and exhibited phase shifts of the sleep-wake cycle in a short light period (photoperiod) paradigm. Molecular characterization revealed that the rare variants destabilized PER3 and failed to stabilize PERIOD1/2 proteins, which play critical roles in circadian timing. Although hPER3-P415A/H417R-Tg mice showed a mild depression-like phenotype, Per3 knockout mice demonstrated consistent depression-like behavior, particularly when studied under a short photoperiod, supporting a possible role for PER3 in mood regulation. These findings suggest that PER3 may be a nexus for sleep and mood regulation while fine-tuning these processes to adapt to seasonal changes.
In human populations, alterations in circadian timing can result in mood-related problems (1). An example of this is seasonal affective disorder, also known as “winter depression,” which is among the most common mood disorders, with a reported prevalence of 1.5–9%, depending on latitude (2). In addition, shift work has been suggested as a risk factor for major depressive disorder (3), and depression severity correlates with the degree of circadian misalignment (4, 5). A number of genetic variants in core clock genes have been reported as statistically associated with mood disorders, including seasonal affective disorder and major depressive disorder (6–14), but to date none has been causally related with an understanding of specific molecular links.
Familial advanced sleep phase (FASP) is a human behavioral phenotype defined by early sleep time and early morning awakening (15). We previously identified mutations in core clock genes that cause FASP by linkage analysis/positional cloning (16) and candidate gene sequencing (17, 18). Here we identify two rare missense variants in PER3 (PER3-P415A/H417R) that cause FASP and are associated with elevated Beck Depression Inventory (BDI) and seasonality scores. Transgenic mice carrying human PER3-P415A/H417R exhibit delayed phase in a short photoperiod and a lengthened period of wheel-running rhythms in constant light. At a molecular level, the rare variants lead to decreased PER3 protein levels, likely due to decreased protein stability. Moreover, we found that PER3-P415A/H417R can exert effects on the clock (at least in part) by reducing its stabilizing effect on PER1 and PER2. Although hPER3-P415A/H417R transgenic mice display mild measures of depression-like phenotype, Per3−/− mice exhibit consistent depression-like behaviors in multiple tests. The differences are particularly evident in short photoperiods, implying a role for PER3 in mood regulation. Taken together, these results support a role for PER3 in modulating circadian clock and mood that may be especially critical under conditions of short photoperiod (e.g., during the winter season).
Results
Rare PER3 Variants Found in FASP and Seasonal Affective Disorder Subjects.
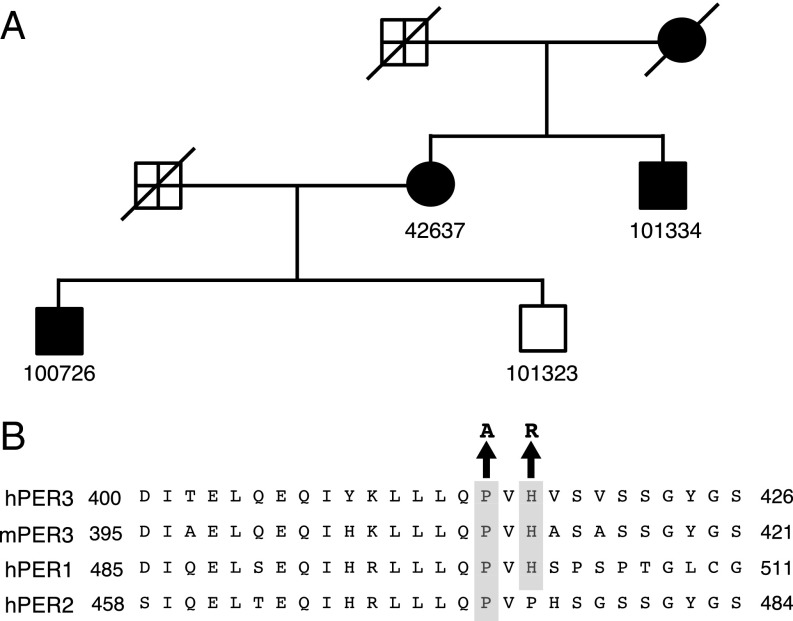
The proband of this study was noted to have advanced sleep phase, accompanied by increased depressive mood and global seasonality scores (GSS) (Table 1). Further assessment of related family members revealed an autosomal-dominant transmission of these traits (Fig. 1A and Table 1). A total of three individuals were found to have FASP, with much earlier sleep onset and offset times compared with unaffected family members and conventional sleepers (sleep onset time, 00:15; sleep offset time, 8:15; euclock.org). The midsleep times for these individuals were within the earliest ∼2–3% of the general population (19). All three individuals had high scores on the Horne–Ostberg Questionnaire, which assesses morning-evening preference; individuals with a score of ≥70 are considered extreme “morning types” (20).
Table 1.
Clinical variables of the human subjects
| Subject | Age, y | Status | Sleep onset | Sleep offset | Mid-sleep time on free days | HO score | BDI score | GSS | Problem Severity Score | Worst month(s) of the year |
| 42637* | 68 | C | 19:30 | 2:30 | 23:00 | 78 | 18 | 13 | 4 | December, January |
| 101334 | 67 | C | 21:33 | 5:30 | 1:32 | 73 | 15 | 10 | 2 | No worst month |
| 100726 | 48 | C | 19:00 (winter) | 3:00 (winter) | 23:00 (winter) | 68 | 21 | 18 | 3 | December |
| 00:00 (summer) | 8:00 (summer) | 4:00 (summer) | ||||||||
| 101323 | 45 | NC | 23:07 | 7:45 | 3:26 | 52 | 3 | 1 | 0 | No worst month |
C, mutation carrier; NC, nonmutation carrier, HO, Horne–Ostberg.
Proband.
Fig. 1.
FASP pedigree and the amino acid alignment around the rare variants. (A) FASP kindred 7107. Circles represent women; squares, men. Filled symbols denote affected individuals; open symbols, unaffected individuals. Symbols marked with a cross are unknown (i.e., do not meet criteria for affected or unaffected). Diagonal lines through symbols indicate that the individual is deceased. Subject 42637 is the proband. (B) Alignments for human (h) and mouse (m) PER proteins in the region harboring the variants. The P415A/H417R variants are highlighted.
All three individuals also showed clinical features of seasonal affective disorder with mildly to moderately elevated BDI scores (>73%∼84% of the general population) (Table 1) (21, 22). The affected subjects exhibited characteristics of seasonal affective disorder with a GSS higher than that of 96.90%∼99.99% of the general population and a high Problem Severity Score (23, 24). In addition, two of the individuals reported that their worst months are in the winter.
While screening candidate circadian genes for mutations related to the FASP phenotype, we identified a C-to-G change and an A-to-G change in PER3, resulting in proline-to-alanine and histidine-to-arginine changes at amino acids 415 and 417 of the protein, respectively (Fig. 1B). These two rare variants (P415A and H417R) occur at residues that are conserved in vertebrate PER3. In addition, P415 is conserved in both PER1 and PER2, whereas H417 is conserved only in PER1. These two missense variants are on the same allele and cosegregate with FASP and mood traits. They were not found in any of more than 250 control DNA samples, although they do exist in the general population at an allele frequency of 0.55% (1000 Genomes Project). Given that the prevalence of major depressive episode is ∼17% in the US (25), and because patients with depression manifest circadian disruptions in behavior and physiology (26), we reason that the existence of these rare variants in the public database does not eliminate the possibility of them being causative of FASP and seasonal affective disorder.
PER3-P415A/H417R Alters Circadian Rhythms.
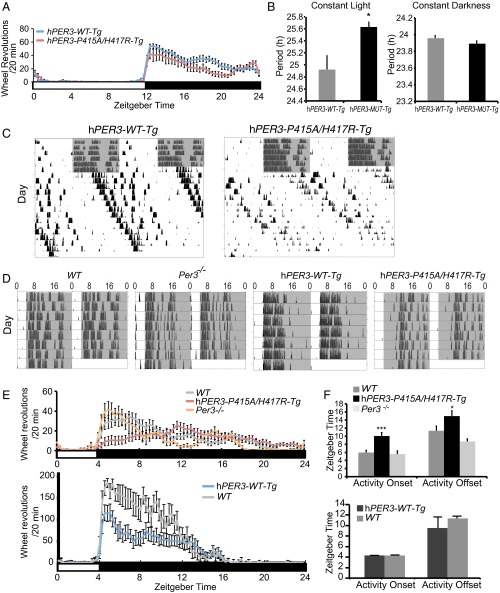
To test whether PER3-P415A/H417R variants cause FASP and the mood traits instead of merely being indirectly associated with them, we generated hPER3-WT (hPER3-WT-Tg) and hPER3-P415A/H417R (hPER3-P415A/H417R-Tg) transgenic mice using a human bacterial artificial chromosome (BAC) clone carrying the entire hPER3 gene. Under 12 h light/12 h dark (LD 12:12) and constant darkness (DD) conditions, we found no substantial difference in wheel-running rhythms between hPER3-WT-Tg and hPER3-P415A/H417R-Tg mice (Fig. 2 A and B).
Fig. 2.
Expression of PER3-P415A/H417R in mice lengthens the period and delays the phase of activity rhythm. (A) Wheel-running activity profiles of hPER3-WT-Tg and hPER3-P415A/H417R-Tg mice during LD 12:12 (n = 7–13). (B) The period of wheel-running activity under LL and DD conditions, respectively (n = 7–29). *P < 0.05, Student’s t test. (C) Double-plotted actograms of wheel-running activity (black bars) for representative hPER3-WT-Tg and hPER3-P415A/H417R-Tg mice. Gray areas indicate periods of darkness before release into LL. (D) Double-plotted actograms of wheel-running activity for representative WT, Per3−/−, hPER3-WT-Tg, and hPER3-P415A/H417R-Tg mice during LD 4:20. (E) Wheel-running activity profiles of WT, hPER3-P415A/H417R-Tg, and Per3−/− mice (Upper) and WT and hPER3-WT-Tg mice (Lower) during LD 4:20 (n = 6–20). (F) Activity onset and offset time under LD 4:20 (n = 6–20). *P < 0.05, ***P < 0.005, Student’s t test. The white bars indicate light periods; black bars, dark periods. Error bars represent SEM.
We next subjected the animals to a constant light (LL) to test whether the rare variants alter the effects of light on the clock. Interestingly, in contrast to Per3 knockout mice, which have a shortened period under LL (27), the behavioral period of hPER3-P415A/H417R-Tg mice was significantly longer than that of hPER3-WT-Tg mice (Fig. 2 B and C). Given that one of the human subjects displayed advanced phase only during winter, when photoperiods are short (Table 1), we monitored hPER3-P415A/H417R-Tg mice in 4-h light/20-h dark cycles (LD 4:20) and observed a ∼4-h phase delay in activity onset and offset time vs. WT (Fig. 2 D–F). We found no phase delay in wheel-running rhythms under LD 4:20 in hPER3-WT-Tg, WT, and Per3−/− mice, however (Fig. 2 D–F). These results support a dominant effect of PER3-P415A/H417R over PER3-WT on the light-sensing pathway(s) in mice.
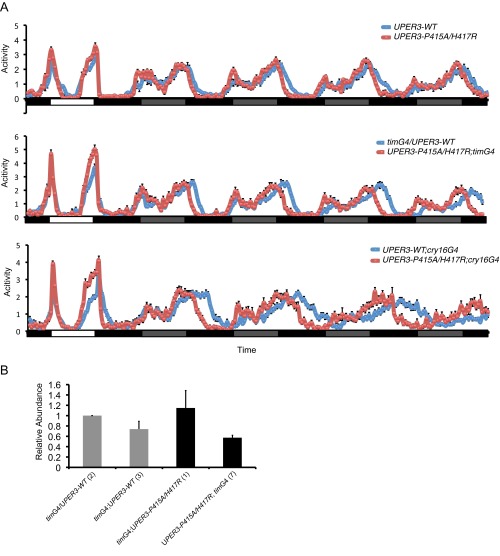
We also generated and characterized transgenic flies carrying either WT or mutant human PER3 (Fig. S1 and Tables S1 and S2). Interestingly, flies expressing hPER3-P415A/H417R showed significantly earlier activity offset time compared with hPER3-WT flies (Fig. S1A and Table S1). In addition, the period of activity rhythms was significantly shorter in the hPER3-P415A/H417R flies under DD (Fig. S1A and Table S2). These results suggest that the hPER3-P415A/H417R produces similar effects on diurnal flies as those seen in human FASP subjects.
Fig. S1.
Expression of PER3-P415A/H417R in flies advances behavioral phase compared with PER3-WT–expressing flies. (A) Normalized locomotor activity profiles during LD for 1 d, followed by 4 d of DD. White bars indicate light periods; black bars, dark periods; gray bars, subjective light periods (n = 28–40). (B) Relative mRNA abundance for hPER3 from whole head extracts of timGAL4/UAShPER3-WT (2), timGAL4/+;UAShPER3-WT/+ (3), timGAL4/+;UAShPER3-P415A/H417R/+ (1), and UASPER3-P415A/H417R;timGAL4/+ (7) flies was determined by qRT-PCR (n = 2–6). For each experiment, the value of timGAL4/UAShPER3-WT (2) was set to 1. Error bars represent SEM.
Table S1.
hPER3-P415A/H417R flies exhibit earlier activity offset time vs. hPER3-WT flies
| UAS transgene | GAL4 driver | Time of activity onset (ZT) | Time of activity offset (ZT) | n |
| UASPER3-WT/+ (2) | WT | 22.6 ± 0.2 | 13.9 ± 0.0 | 30 |
| UASPER3-WT (2) | timGAL4 | 23.2 ± 0.2 | 14.0 ± 0.1 | 39 |
| UASPER3-WT (2) | cryGAL4-16 | 23.2 ± 0.2 | 15.2 ± 0.2 | 40 |
| UASPER3-WT/+ (3) | WT | 22.6 ± 0.2 | 13.9 ± 0.1 | 30 |
| UASPER3-WT/+ (3) | timGAL4 | 23.3 ± 0.1 | 14.2 ± 0.1 | 39 |
| UASPER3-WT/+ (3) | cryGAL4-16 | 23.1 ± 0.2 | 14.7 ± 0.2 | 40 |
| UASPER3-P415A/H417R/+ (1) | WT | 22.7 ± 0.2 | 13.7 ± 0.0 | 30 |
| UASPER3-P415A/H417R/+ (1) | timGAL4 | 22.7 ± 0.2*,† | 13.6 ± 0.0*,† | 40 |
| UASPER3-P415A/H417R/+ (1) | cryGAL4-16 | 23.0 ± 0.2 | 14.0 ± 0.0*,† | 40 |
| UASPER3-P415A/H417R (7) | WT | 23.3 ± 0.1 | 13.8 ± 0.0 | 32 |
| UASPER3-P415A/H417R (7) | timGAL4 | 23.1 ± 0.1 | 13.7 ± 0.0*,† | 40 |
| UASPER3-P415A/H417R (7) | cryGAL4-16 | 22.9 ± 0.2 | 13.9 ± 0.1*,† | 37 |
| WT | timGAL4/+ | 23.3 ± 0.2 | 14.3 ± 0.2 | 24 |
| WT | cryGAL4-16 | 23.2 ± 0.1 | 14.5 ± 0.2 | 23 |
See also Fig. S1. The numbers in parentheses indicate the line number for different UASPER3 transgenic lines.
Student’s t test compared with PER3-WT (2)-expressing lines; P < 0.05.
Student’s t test compared with PER3-WT (3)-expressing lines; P < 0.05.
Table S2.
hPER3-P415A/H417R flies exhibit shortened period vs. hPER3-WT flies
| UAS transgene | GAL4 driver | Period, h | Power | %Rhythmic | n |
| UASPER3-WT/+ (2) | WT | 24.2 ± 0.1 | 106 ± 9 | 97 | 29 |
| UASPER3-WT (2) | timGAL4 | 25.3 ± 0.1 | 100 ± 7 | 100 | 39 |
| UASPER3-WT (2) | cryGAL4-16 | 27.3 ± 0.1 | 51 ± 7 | 83 | 40 |
| UASPER3-WT/+ (3) | WT | 23.7 ± 0.1 | 57 ± 8 | 86 | 28 |
| UASPER3-WT/+ (3) | timGAL4 | 24.8 ± 0.1 | 108 ± 8 | 97 | 35 |
| UASPER3-WT/+ (3) | cryGAL4-16 | 26.4 ± 0.1 | 95 ± 8 | 92 | 39 |
| UASPER3-P415A/H417R/+ (1) | WT | 23.6 ± 0.0 | 96 ± 8 | 100 | 30 |
| UASPER3-P415A/H417R/+ (1) | timGAL4 | 24.4 ± 0.1*,† | 70 ± 7 | 95 | 40 |
| UASPER3-P415A/H417R/+ (1) | cryGAL4-16 | 26.4 ± 0.1* | 86 ± 9 | 89 | 38 |
| UASPER3-P415A/H417R (7) | WT | 23.7 ± 0.1 | 98 ± 8 | 100 | 30 |
| UASPER3-P415A/H417R (7) | timGAL4 | 24.3 ± 0.1*,† | 78 ± 7 | 97 | 39 |
| UASPER3-P415A/H417R (7) | cryGAL4-16 | 25.9 ± 0.1*,† | 41 ± 6 | 82 | 34 |
| WT | timGAL4/+ | 24.8 ± 0.0 | 96 ± 8 | 98 | 40 |
| WT | cryGAL4-16 | 25.7 ± 0.1 | 111 ± 8 | 100 | 40 |
See also Fig. S1. The numbers in parentheses indicate the line number for different UASPER3 transgenic lines.
Student’s t test compared with PER3-WT (2)–expressing lines; P < 0.01.
Student’s t test compared with PER3-WT (3)–expressing lines; P < 0.01.
PER3-P415A/H417R Has Reduced Repressor Activity and Is Less Stable Than PER3-WT.
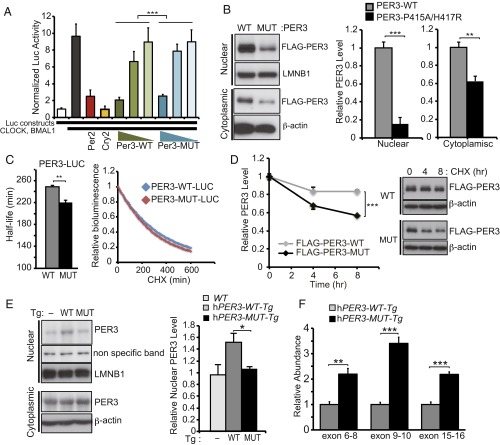
To test whether the rare variants affect PER3 repressor activity, we used a Per2 promoter-driven luciferase reporter assay to determine the repressive activity of WT and P415A/H417R PER3 proteins. PER3-P415A/H417R demonstrated consistently reduced repressor activity compared with PER3-WT, suggesting that these variants make PER3 a weaker repressor (Fig. 3A).
Fig. 3.
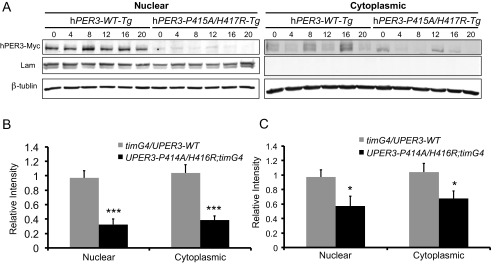
P415A/H417R variants destabilize PER3. (A) Repressor activity of WT or P415A/H417R PER3 protein on CLOCK-BMAL1–mediated expression of Per2 promoter-driven luciferase was examined by a reporter assay performed in HEK293T cells (n = 3). Luciferase activity was normalized to activity levels in the absence of CLOCK and BMAL1 (white column). Addition of CLOCK and BMAL1 resulted in a nearly 10-fold increase in luciferase activity (black column). PER3-P415A/H417R had reduced repressor activity across different titers compared with PER3-WT. PER2 (red column) and CRY2 (yellow column) were positive controls for repressor activity. ***P < 0.001, two-way ANOVA. (B) PER3 protein levels in the nuclear and the cytoplasmic fractions. HEK293T cells were transfected with indicated plasmid vectors. At 48 h after transfection, the cells were harvested and then fractionated into nuclear and cytoplasmic fractions. Results are expressed as mean ± SEM (n = 3). **P < 0.01, ***P < 0.005, Student′s t test. (C) HEK293T cells were transfected with indicated plasmid vectors. At 24 h after transfection, the culture medium was replaced by measuring medium containing CHX (100 µg/mL). Bioluminescence was measured at 10-min intervals. Bioluminescence at time point 0 was set to 1. Half-lives of PER3-LUCs were calculated by fitting the bioluminescence signals to exponential functions. Error bars show mean ± SEM (n = 3). **P < 0.01, Student’s t test. (D) HEK293T cells were transfected with indicated plasmid vectors. At 40 h after transfection, the cells were treated with CHX (100 µg/mL) for 4 or 8 h. PER3 protein levels at time point 0 were set to 1, and relative PER3 protein levels were plotted. Error bars show mean ± SEM (n = 3). ***P < 0.005, Student’s t test. (E) Western blots of nuclear and cytoplasmic fractions of liver extracts from hPER3-WT-Tg and hPER3-P415A/H417R-Tg mice at ZT12. LMNB1 and β-actin served as loading controls in the nuclear and cytoplasmic fractions, respectively. Nuclear PER3 protein levels were normalized to LMNB1 levels and are expressed as mean ± SEM (n = 3 per genotype). *P < 0.05, Student′s t test. (F) Expression levels of hPER3 mRNA in liver extracts from hPER3-WT-Tg and hPER3-P415A/H417R-Tg animals (n = 5 per genotype), as assayed by three independent TaqMan qPCR assays across different exon boundaries. Expression levels in hPER3-P415A/H417R-Tg mice were normalized to those in hPER3-WT-Tg mice. Results are expressed as mean ± SEM. **P < 0.01, ***P < 0.001, Student’s t test.
Based on the persistently lower levels of mutant protein compared with WT protein (Fig. 3B), we tested whether the rare variants affect PER3 by altering protein stability. Through continuous recording of bioluminescence activity, we found that the bioluminescence decay of PER3-LUC after treatment with a protein synthesis inhibitor, cycloheximide (CHX), was significantly accelerated by the P415A/H417R variants (Fig. 3C). On Western blot analysis, we also found that relative FLAG-PER3-P415A/H417R protein level was lower after CHX treatment compared with that of PER3-WT (Fig. 3D), indicating that P415A/H417R variants destabilize PER3 protein.
To determine whether the PER3-P415A/H417R protein levels in transgenic animal models are also altered in vivo, we assessed hPER3 levels for hPER3-WT-Tg and hPER3-P415A/H417R-Tg mice. Nuclear hPER3 protein levels were significantly lower in the hPER3-P415A/H417R-Tg mice compared with the hPER3-WT-Tg mice (Fig. 3E). hPER3 protein levels in cytoplasmic fractions were comparable in the two mouse strains, even though hPER3 RNA expression level was twofold to threefold greater in the hPER3-P415A/H417R-Tg mice (Fig. 3F). Similarly, hPER3 levels were significantly lower in hPER3-P415A/H417R compared with PER3-WT transgenic flies (Fig. S2 A–C). These results indicate that consistent with in vitro data, P415A/H417R variants lead to decreased hPER3 protein levels in vivo as a result of decreased protein stability.
Fig. S2.
hPER3-P415A/H417R is lower than hPER3-WT in transgenic flies. (A) Representative Western blots of whole head extracts of timGAL4/UAShPER3-WT (2) and UASPER3-P415A/H417R;timGAL4/+ (7) flies during DD day 2. (B and C) Quantification of Western blots in A (n = 18). For C, hPER3-Myc protein levels were normalized to the mRNA levels of hPER3 shown in Fig. S1B. Significant differences were calculated using Student’s t test. *P < 0.05; ***P < 0.001.
PER3-P415A/H417R Has Reduced Ability to Stabilize PER1 and PER2.
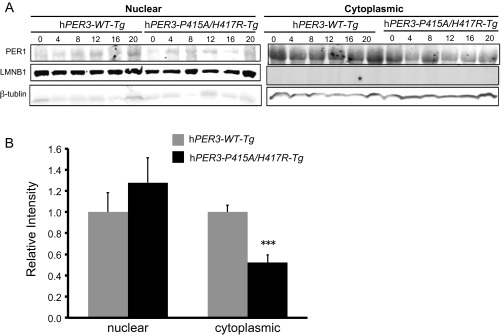
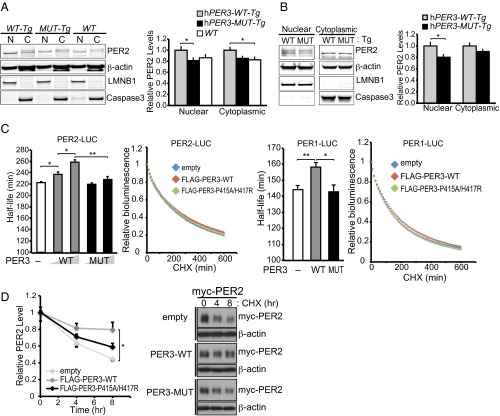
Previous studies have demonstrated that PER3 functions to promote nuclear translocation of PER1 and PER2 (28). We tested whether mutant PER3 exerts any influence on the clock by impinging on nuclear/cytoplasmic distribution of PER1 and/or PER2. We assessed nuclear and cytoplasmic mPER1 and mPER2 protein levels in hPER3-WT-Tg and hPER3-P415A/H417R-Tg mice and found that mPER1 levels were significantly reduced in cytoplasmic fractions from the hPER3-P415A/H417R-Tg mice, but that the differences for nuclear fractions did not reach statistical significance (Fig. S3). In addition, mPER2 levels were significantly lower in both the nuclear and cytoplasmic fractions of hypothalamus from the hPER3-P415A/H417R-Tg mice (Fig. 4A). We also observed a similar trend for mPER2 in the liver, although it did not reach statistical significance for the cytoplasmic fractions (Fig. 4B). Thus, PER1 and PER2 levels are lower in the presence of PER3-P415A/H417R vs. PER3-WT in vivo. Even though the Drosophila PER protein sequence is poorly conserved in this region, dPER protein is affected by the human variants; we found that dPER protein levels were significantly lower in hPER3-P415A/H417R flies compared with hPER3-WT flies.
Fig. S3.
PER1 protein levels in hPER3 Tg mice. (A) Representative Western blots of liver extracts of hPER3-WT-Tg and hPER3-P415A/H417R-Tg mice obtained on LL day 19. LMNB1 and β-actin were used as loading controls in the nuclear and cytoplasmic fractions, respectively. (B) Quantification of the Western blots in A. Expression levels were normalized to average levels in hPER3-WT-Tg mice. Results are expressed as mean ± SEM. ***P < 0.001, Student’s t test.
Fig. 4.
PER3-P415A/H417R has reduced ability to stabilize PER1/PER2. (A and B) (Left) representative Western blots of PER2 in nuclear and cytoplasmic fractions of hypothalamus (A) and liver (B) of hPER3-WT-Tg and hPER3-P415A/H417R-Tg mice at Zeitgeber Time 6 (ZT6). β-actin served as a loading control, and LMNB1 and caspase3 served as nuclear and cytoplasmic markers, respectively. (Right) Quantification of PER2 protein levels in nuclear and cytoplasmic fractions of hypothalamus (A) and liver (B) from hPER3-WT-Tg and hPER3-P415A/H417R-Tg mice (n = 10–11). Expression levels were normalized to average levels in hPER3-WT-Tg mice. Results are expressed as mean ± SEM. *P < 0.05, ANOVA with Tukey's post hoc multiple-comparison test for A and Student′s t test for B. (C) HEK293T cells were transfected with the indicated plasmid vectors. At 24 h after transfection, the culture medium was replaced with measuring medium containing CHX (100 µg/mL). Bioluminescence was measured at 10-min intervals. Bioluminescence at the time point 0 was set to 1. Half-lives of PER1-LUC and PER2-LUC were calculated by fitting the bioluminescence signals to exponential functions. Error bars show mean ± SEM (n = 4). *P < 0.05, **P < 0.01, Student’s t test. (D) HEK293T cells were transfected with myc-PER2 and FLAG-PER3 expression vectors. At 40 h after transfection, the cells were treated with 100 µg/mL CHX for 4 or 8 h. PER2 protein levels at time point 0 were set to 1, and relative PER2 protein levels were plotted. Error bars show mean ± SEM (n = 3). *P < 0.05, Student’s t test.
To further explore the effects of PER3-P415A/H417R on PER1/PER2, we coexpressed hPER1/hPER2 with hPER3-WT or hPER3-P415A/H417R in HEK293T cells and then treated the cells with CHX. We measured the half-lives of PER1 and PER2 through a bioluminescence degradation analysis. Interestingly, PER3-WT stabilized PER1 and PER2, whereas PER3-P415A/H417R failed to do so (Fig. 4C). Similarly, using Western blot analysis, we found that PER3-WT, but not PER3-P415A/H417R, significantly increased PER2 protein stability (Fig. 4D). These results imply that PER3-WT acts to promote the stability of PER1/PER2, and that the PER3 variants abrogate this effect, leading to lower levels of PER1 and PER2. Taken together, these results suggest that the rare variants may act through PER1 and PER2 to alter clock regulation.
PER3-P415A/H417R Mice Have Altered Sleep and Increased Depression-Like Behavior on the Tail Suspension Test.
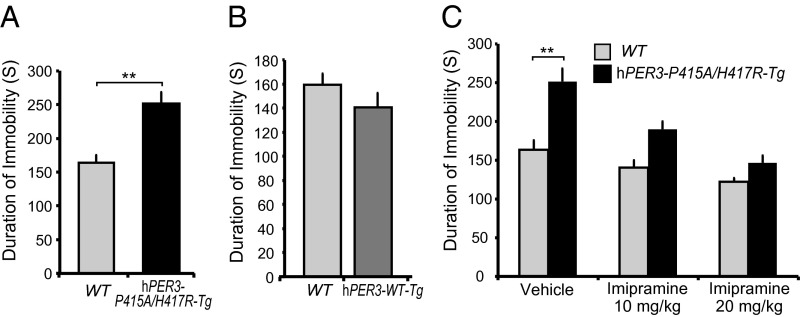
Given that the human carriers of rare PER3 variants show features of seasonal affective disorder, we tested whether transgenic mice can recapitulate this phenotype. When subjected to the tail suspension test, hPER3-P415A/H417R-Tg mice exhibited a significantly increased duration of immobility compared with WT littermates, indicating increased depression-like behavior (Fig. 5A). This finding cannot be related simply to overexpression of hPER3 in mice, given that hPER3-WT-Tg transgenic mice are indistinguishable from WT mice (Fig. 5B). Moreover, the increased duration of immobility in hPER3-P415A/H417R-Tg mice was suppressed in a dose-dependent manner by treatment with the antidepressant imipramine (Fig. 5C), indicating that the depression-like behavior observed in these animals shares pharmacologic similarities with human depression. We did not detect any significant changes using the forced swim and sucrose intake tests, however.
Fig. 5.
hPER3-P415A/H417R-Tg mice show depression-like behavior on the tail suspension test. (A and B) Duration of immobility in the tail suspension test for WT vs. hPER3-P415A/H417R-Tg mice (A) and for WT vs. hPER3-WT-Tg mice (B). (C) Quantification of the effects of imipramine on immobility of WT vs. hPER3-P415A/H417R-Tg mice in the tail suspension test. Error bars show mean ± SEM (n = 4–22). **P < 0.01, Student’s t test.
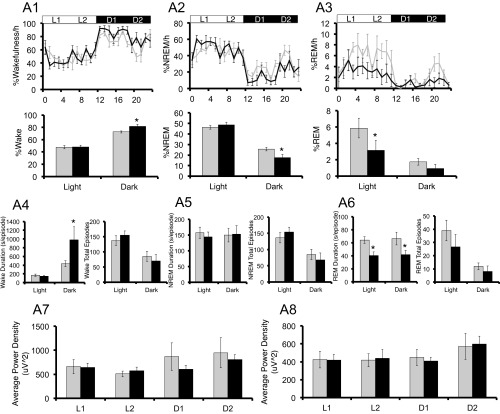
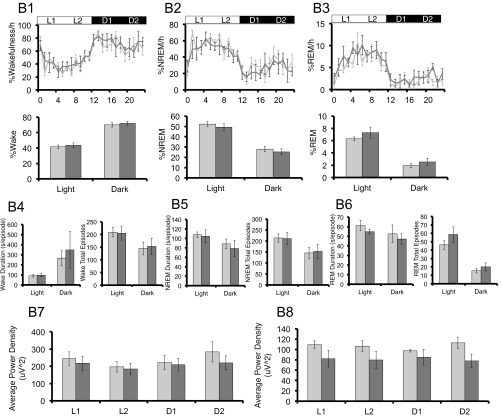
Because patients with depression often experience disruptions in sleep (29), we also assessed sleep in our mouse models by evaluating electroencephalography (EEG) and electromyography (EMG) findings. Under LD cycles, hPER3-P415A/H417R-Tg mice spent significantly more time awake in the dark phase relative to WT mice, accompanied by significantly less nonrapid eye movement (NREM) sleep in the dark phase and less rapid eye movement (REM) sleep in the light phase (Fig. S4 A1–A3). In addition, compared with WT mice, hPER3-P415A/H417R-Tg mice had a significantly longer average length of wake episodes in the dark phase, along with a significantly shorter average length of REM sleep episodes in both the light and dark phases (Fig. S4 A4–A6). Despite the differences in sleep quantity, we found no significant change in NREM δ power or REM θ power, suggesting that sleep depth was not altered in the hPER3-P415A/H417R-Tg mice (Fig. S4 A7 and A8). These effects on sleep are exerted by the P415A/H417R variants, given that hPER3-WT expression in mice did not significantly alter sleep (Fig. S4B). Interestingly, sleep amount did not differ significantly between hPER3-P415A/H417R-Tg and WT mice under DD, implying that the hPER3-P415A/H417R allele alters sleep in a light-dependent manner.
Fig. S4.
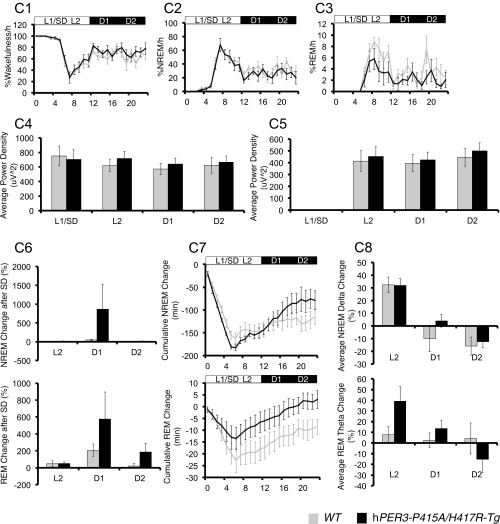
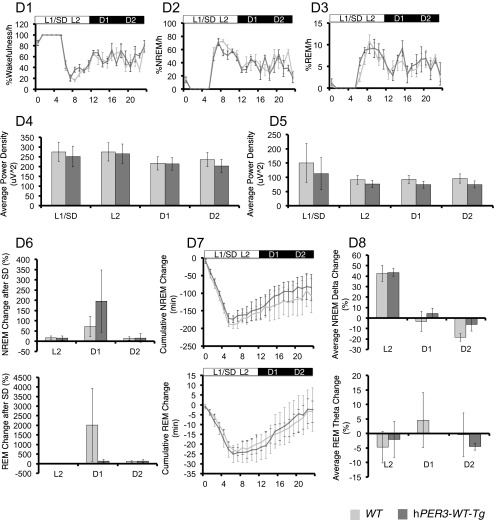
hPER3-P415A/H417R-Tg mice exhibit decreased sleep in LD cycles compared with hPER3-WT-Tg and WT mice. EEG analyses for WT (light gray) vs. hPER3-P415A/H417R-Tg (black) mice (A and C) and WT (light gray) vs. hPER3-WT-Tg (dark gray) mice (B and D) were used to quantitate sleep under baseline conditions (A and B) and after sleep deprivation (C and D). (A1 and B1) Percentage of time spent awake. (A2 and B2) Percentage of time spent in NREM sleep. (A3 and B3) Percentage of time spent in REM sleep. Quantification of mean episode duration and number of episodes for (A4 and B4) wakefulness, (A5 and B5) NREM sleep, and (A6 and B6) REM sleep. Average spectral power was calculated for each of the 6-h periods (from left to right: L1, L2, D1, and D2) as indicated by the horizontal bars in (A1–A3 and B1–B3). (A7 and B7) NREM δ and (A8 and B8) REM θ powers were compared for the two genotypes. (C1 and D1) Percentage of time spent awake. (C2 and D2) Percentage of time spent in NREM sleep. (C3 and D3) Percentage of time spent in REM sleep. Average spectral power was calculated for each of the 6-h periods (from left to right: L1/SD, L2, D1, and D2) as indicated by the horizontal bars in C1–C3 and D1–D3. (C4 and D4) NREM δ and (C5 and D5) REM θ powers were compared for the two genotypes. (C6 and D6) Percent changes of time after sleep deprivation compared with the baseline condition for NREM and REM in L2, D1, and D2 for the two genotypes. (C7 and D7) Cumulative NREM and REM sleep loss and gain compared with baseline conditions for the sleep deprivation experiment. (C8 and D8) Analysis of spectral sleep power changes compared with baseline conditions for L2, D1, and D2. Error bars represent SEM (n = 7). *P < 0.05, Student’s t test.
We next examined whether hPER3-P415A/H417R influences the regulation of sleep homeostasis by sleep-depriving mice for 6 h starting at the beginning of the light phase (i.e., when the animals normally sleep) and monitoring recovery sleep during the next 18 h (the subsequent 6 h of the light phase and 12 h of the dark phase). WT, hPER3-WT-Tg, and hPER3-P415A/H417R-Tg mice all exhibited comparable sleep rebound, with no significant alteration among the different genotypes (Fig. S4 C and D), suggesting that sleep homeostasis is not affected by the hPER3-P415A/H417R variants.
Per3 Knockout Mice Display Depression-Like Behavior in a Short Photoperiod.
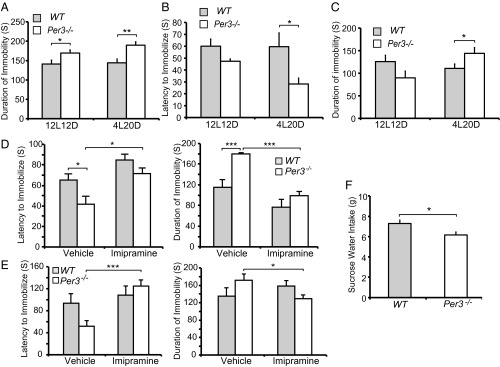
Because P415A/H417R variants destabilize PER3 protein, we tested whether the mood phenotype is associated with a reduction of PER3. Given that hPER3-P415A/H417R-Tg mice have two copies of endogenous mPer3 and two or three copies of the hPER3-P415A/H417R transgene, transgenic mice overexpressing PER3 are not a good model for a mutation leading to reduced PER3. Thus, we tested Per3 −/− mice for depression-like behavior. Under LD 12:12, Per3−/− mice displayed significantly increased duration of immobility in the tail suspension test and no significant change in the forced swim test (Fig. 6 A–C). When subjected to a shortened photoperiod (LD 4:20), Per3−/− mice demonstrated an even greater difference in the duration of immobility in the tail suspension test (Fig. 6A). In addition, Per3−/− mice showed a significantly reduced latency to immobilization accompanied by increased duration of immobility in the forced swim test under LD 4:20, indicative of increased depression-like behavior (Fig. 6 B and C). We were able to rescue both of these phenotypes with imipramine treatment (Fig. 6 D and E).
Fig. 6.
PER3−/− mice demonstrate depression-like behavior in short photoperiods. (A) Duration of immobility of WT vs. Per3−/− mice in the tail suspension test under LD 12:12 and LD 4:20. (B and C) Latency to immobilization (B) and duration of immobility (C) of WT vs. Per3−/− mice in the forced swim test under LD 12:12 and LD 4:20. (D) Treatment with imipramine (20 mg/kg i.p.) rescues the tail suspension phenotype in Per3−/− mice under LD 4:20. Error bars show mean ± SEM (n = 6 per group). (E) Treatment with imipramine (20 mg/kg i.p.) rescues the forced swim phenotype in Per3−/− mice under LD 4:20. Error bars represent mean ± SEM (n = 6 each genotype). (F) Amount of sucrose water intake in WT and Per3−/− mice under LD 4:20. Error bars represent mean ± SEM (n = 4–22). *P < 0.05, **P < 0.01, ***P < 0.005, Student’s t test.
We also analyzed the hedonic value of sucrose, and found that Per3−/− mice ingested significantly less sucrose solution (Fig. 6F), further supporting increased depression-like behavior in these animals. Taken together, these behavioral alterations demonstrate a fascinating association of PER3 genotypes with mood phenotypes, particularly in short photoperiods that mimic the winter months. These phenotypes are reminiscent of the mood and seasonality traits observed in the human carriers of the rare PER3 variants, suggesting that PER3-P415A/H417R may play a role in the seasonal affective behavior in these individuals.
Discussion
There have been numerous reports of genetic associations between polymorphisms in clock genes and psychiatric disorders (including major depressive disorder and seasonal affective disorder) (6–14), but neither direct causal mutations nor molecular pathways have been identified. We previously reported that in a FASP kindred with a mutation in casein kinase 1δ, four of the five affected individuals exhibited higher depression scores (17); however, the mutant mice carrying the casein kinase 1δ mutation were not phenotyped for depression-like behavior. Here we describe rare hPER3 variants, P415A and H417R, that cause FASP and provide data supporting a possible role of these variants in seasonal affective disorder.
Given the small size of the human family and limitations of testing “depression” in rodent models, we must be careful in interpreting a causal role for PER3 variants in regulation of affect. Nonetheless, it is striking that this PER3 allele cosegregates with seasonal affective disorder in this small family, and that mouse models mimicking human mutations (hPER3-P415A/H417R-Tg and Per3−/− mice) exhibit measures of increased depression-like behavior. This phenotype was exacerbated by subjecting animals to a short photoperiod. Thus, this report provides evidence supporting the assertion that circadian rhythm and mood regulation share common, or closely related, pathways.
We found that the period for hPER3-P415A/H417R-Tg mice was lengthened under LL, although their behavioral rhythms were not significantly altered in LD 12:12 and DD. Light, when administered at different times of the day, can lead to phase advance or delay of sleep-wake rhythms. It is believed that when subjected to LL, an animal with a greater phase delay zone and a smaller phase advance zone will demonstrate in period lengthening, and vice versa (30). Our results indicate that light induces a larger phase delay and/or smaller phase advance in hPER3-P415A/H417R-Tg vs. hPER3-WT-Tg mice, and that the variants lead to altered entrainment in response to light. Altered entrainment is further supported by the observation that hPER3-P415A/H417R-Tg mice display a large phase delay under LD 4:20.
Based on the morning/evening oscillator model, the morning oscillator is accelerated by light, whereas the evening oscillator is decelerated by light (30). Mice lacking PER3 exhibit a shorter period than WT mice in LL (27), suggesting that PER3 functions in the evening oscillator. The hPER3-P415A/H417R-Tg mice exhibited a lengthened period in LL, supporting enhanced function in the evening oscillator. One important function of morning and evening oscillators is to adapt to seasonal changes in day length (30). It is possible that PER3-P415A/H417R affects the evening oscillators, resulting in maladaptation of activity rhythms to short photoperiods during the winter months.
Unlike Per1- and Per2-deficient mice, Per3-deficient mice exhibit relatively small changes in circadian period length in DD (31, 32); therefore, Per3 has been considered dispensable for the circadian clock. Polymorphisms for human PER3 have been repeatedly linked to diurnal preference by association studies, however (33–36). Here we find that PER3-WT could stabilize PER1/PER2, and that PER3-P415A/H417R lost this ability. This provides a possible means through which PER3-P415A/H417R can exert an effect on the molecular clock through its loss of stabilizing function on PER1/PER2.
The hPER3-P415A/H417R-Tg mice showed increased depression-like behavior only in the tail suspension test, whereas Per3−/− animals displayed depression-like changes in multiple behavioral tests. Given that the P415A/H417R variants destabilize PER3 protein, it is possible that the PER3-P415A/H417R contributes to a mood phenotype in humans owing to reduced PER3 levels. Consistent with this idea, the Per3 null animals had a stronger phenotype but exhibited a loss of both alleles. We cannot rule out the possibility that PER3-P415A/H417R variants exert a weak dominant-negative effect. These mouse behavioral phenotypes become more evident in short photoperiods, reflecting an effect of day length on mood-like behaviors that recapitulates the mood and seasonality traits in human subjects. These findings suggest that PER3 modulates mood to accommodate for the short day length in winter. More work is needed to substantiate this finding and, if verified, to characterize the molecular pathways leading to this phenotype.
hPER3-P415A/H417R-Tg mice also exhibited reduced baseline NREM sleep in the dark phase and REM sleep in the light phase. The duration of REM episodes was decreased in both the light and the dark phases. Overall recovery sleep following sleep deprivation was not altered in these animals, indicating that sleep homeostasis is not affected by these variants; however, the cumulative REM loss from sleep deprivation tended to be much less for hPER3-P415A/H417R-Tg mice than for control mice. These results might be relevant to the finding of enhanced arousal in depressed patients and the idea that depression symptoms can be alleviated by increasing sleep propensity via sleep deprivation (37). This increased wakefulness also may contribute to altered signaling of arousal-dependent factors to the clock. Moreover, the sleep-reducing effects of mutant PER3 are light dependent (observed only in LD and not in DD). Consistent with our findings, it has been suggested that a polymorphism in PER3 is involved in modulating the alerting effects of light and the influence of light on sleep in human subjects (38, 39).
In summary, our results suggest that PER3 serves as a node linking the regulatory processes of circadian rhythms with those of mood. PER3 may participate in modulating these processes to adapt to the short photoperiods in winter. Our animal models provide unique opportunities to further dissect the mechanisms underlying the circadian clock and mood, and to understand the pathology that contributes to affective disorders accompanied by altered sleep/wake rhythms. New insights into PER3 function could have implications for the development of treatment for affective disorders.
Materials and Methods
Additional information on the materials and methods used in this study is provided in SI Materials and Methods.
Patient Diagnosis.
Subjects signed a consent form approved by the Institutional Review Boards at the University of Utah and the University of California, San Francisco. Self-reported habitual sleep-wake schedules were obtained from telephone interviews and/or questionnaire reports of vacation or weekend sleep schedules. Midsleep time on free days was calculated as the average of the habitual initial sleep onset and final awakening times during nonwork days. More details are provided in SI Materials and Methods.
Identification of Rare Variants in PER3.
We collected human families that exhibit the trait of habitual early spontaneous awakening segregated in an autosomal dominant pattern. To identify the mutations responsible for this phenotype, we used a candidate gene approach to screen at least one DNA sample from each family. We sequenced CLOCK, BMAL1, PER1-3, CRY1-2, DEC1-2, CK1δ/ε, and other known clock genes. PER3-P415A/H417R variants were found only in this family (out of 60 families). No other circadian candidate gene mutations were found in this FASP family. Sequencing included at least 100 bases flanking exons of all candidate genes.
Plasmid Construction.
Detailed information on plasmid construction is provided in SI Materials and Methods.
Generation of Transgenic Mice.
hPER3-WT-Tg (carrying a WT human PER3 gene) and hPER3-P415A/H417R-Tg (carrying a human PER3 gene with variants) transgenic mice were generated as described previously (17). All mouse work was performed in accordance with the guidelines of Institutional Animal Care and Use Committee at University of California, San Francisco. More details are provided in SI Materials and Methods.
Mouse Wheel-Running Activity Monitoring and Analyses.
This experiment was performed using male mice (aged 2–6 mo) of the following genotypes on a C57BL6 background: WT, hPER3-WT-Tg, hPER3-P415A/H417R-Tg, and Per3−/− (32). Mouse housing, handling, and wheel-running activity monitoring were performed as described previously (17). The activity onset and offset times were calculated using standard parameters in the ClockLab software. The default template was 6 h of inactivity followed by 6 h of activity for onsets (and vice versa for offsets). To calculate the time of onset or offset of wheel-running activity in LD 4:20, the largest 1-h increase or decrease in activity for each mouse was determined. The time designation refers to the end point of the maximal activity decrease or increase, as averaged among individual mice in each genotype. “Phase delay” is the hours of delayed-onset Zeitgeber time (ZT), calculated by comparing mutant transgenic mice with control mice. All of the mice used in this work were on a C57BL6 background except the mice shown in Fig. 2 E and F, Bottom, which were on a C57/SJL hybrid background. More information is available in SI Materials and Methods.
qRT-PCR of Mouse Liver.
Total RNA was isolated using the miRNeasy Mini Kit (Qiagen) from liver samples of transgenic animals at ZT12. qRT-PCR was performed as follows. After generation of cDNA by SuperScript III (Life Technologies), duplex TaqMan qPCR assays were performed in triplicate with probes specific for genes of interest and an endogenous control, Gapdh (Life Technologies; 4308313). Data were calculated using the standard curve method. Expression levels of genes of interest were then normalized to levels of Gapdh. PER3 TaqMan assays were purchased from Integrated DNA Technology.
Luciferase Assay.
HEK293T cells were transfected with a Per2::luc reporter and other expression constructs (100 ng per well of a 24-well plate, unless noted otherwise). For Per2 expression, 200 ng of the construct was used. For PER3 titration, 200, 50, or 12.5 ng of the construct was used for transfection. A constitutively expressed Renilla luciferase construct served as a control. Assays were performed at 24 h posttransfection using the Promega Dual-Luciferase Reporter Assay System according to the manufacturer’s instructions. Results are expressed as mean ± SEM. All experiments were performed at least twice, and all data presented are the average of three technical replicates.
Protein Extraction and Western Blot Analysis.
Nuclear and cytoplasmic protein extraction was performed using the Active Motif Nuclear Extract Kit. For whole-cell extracts, HEK293 cells were homogenized in RIPA buffer [25 mM Tris⋅HCl pH 7.6, 150 mM NaCl, 1% Nonidet P-40, 1% sodium deoxycholate, 0.1% SDS, protease inhibitor mixture (Roche), and phosphatase inhibitor mixture (Active Motif)]. After centrifugation, supernatants were boiled for 5 min in SDS sample buffer and then separated by SDS/PAGE. After transfer to nitrocellulose membranes and blocking with Odyssey blocking buffer (LI-COR Biosciences), proteins were detected with appropriate antibodies (SI Materials and Methods). Nuclear PER3/PER1/PER2 was normalized to LMNB1, and cytoplasmic PER3/PER1/PER2 was normalized to caspase 3, GAPDH, or β-actin. For whole-cell extracts, PER3/PER2 was normalized to GAPDH or β-actin. The values of PER3-WT were set to 1. Further details are provided in SI Materials and Methods.
Transient Transfection and Protein Stability Assays.
HEK293T cells were plated in 12-well plates and transfected with Lipofectamine 3000 transfection reagent (Life Technologies). The following DNA constructs were used for transfections: pCMV10-FLAG-hPER3-WT, pCMV10-FLAG-hPER3-P415A/H417R, and pCS2-myc-hPER2 (40). Approximately 40 h later, CHX (100 μg/mL; Santa Cruz Biotechnology) was added, and cells were harvested at 4 or 8 h after CHX treatment.
Bioluminescence Degradation Assay.
hPER1-LUC, hPER2-LUC and hPER3-LUC fusion protein-expressing vectors were created by inserting cDNA coding the Per-Luc gene between EcoRI and BamHI sites in the p3XFLAG-CMV-10 vector. HEK293T cells were transfected with PER-LUC vectors and cultured for 24 h. The cultured medium was exchanged with the recording medium [phenol-red free DMEM (Sigma Aldrich) supplemented with 10% (vol/vol) FBS, 3.5 mg/mL glucose, 25 U/mL penicillin, 25 μg/mL streptomycin, 0.05 mM luciferin, and 10 mM Hepes-NaOH; pH 7.0] containing 100 μg/mL CHX (Santa Cruz Biotechnology). Luciferase activity of PER-LUC was recorded at 10-min intervals at 37 °C with a LumiCycle luminometer (Actimetrics). The luminescence signals were fitted to exponential functions to quantify the half-life of PER-LUC.
Tail Suspension Test, Forced Swim Test, and Sucrose Intake Test.
These tests are described in SI Materials and Methods.
Surgery and EEG/EMG Monitoring and Analysis.
Surgery, EEG/EMG monitoring, and EEG data acquisition were performed in the indicated number of 6- to 7-mo-old mice in the Stanford Sleep and Circadian Neurobiology Laboratory as described previously (41). Wakefulness was determined by low-amplitude, mixed-frequency (>4 Hz) EEG with continuous large fluctuation in EMG. Slow-wave or NREM sleep was determined by high-amplitude, low-frequency (0.25–4 Hz) EEG with no fluctuation in EMG, and REM sleep was determined by low-amplitude, high-frequency EEG (similar to the wake stage, but with rhythmic α waves at 8–9 Hz) with no fluctuation in EMG. For power spectral analysis, NREM δ and REM θ EEG power were analyzed with fast Fourier transform for band frequencies between 0.25 and 4 Hz and between 4 and 9 Hz, respectively.
SI Materials and Methods
Patient Diagnosis.
Each subject signed a consent form approved by the Institutional Review Boards at the University of Utah and University of California, San Francisco. Self-reported habitual sleep-wake schedule was obtained from telephone interviews and/or questionnaire report of vacation or weekend sleep schedule. Midsleep time on free days was calculated as the average of the habitual initial sleep onset and final awakening times during nonwork days. A large (n = 92,567) Munich Chronotype Questionnaire database of northern Europeans, corrected for the lowest latitude (34.5°N) of our patients (2.5–3.0 min earlier midsleep time per degree of decrease in latitude), was used for comparison of midsleep time. Features of seasonal affective disorder were identified from the GSS, PSS, and Worst Month of the Year portions of the Seasonal Pattern Assessment Questionnaire (24). The percentage of the general population predicted to have lower GSS values than each subject was calculated from prevalence data assuming normality (23). Categorical Seasonal Pattern Assessment Questionnaire criteria for seasonal affective disorder commonly used in epidemiologic studies were used here to identify subjects with GSS >11, PSS ≥2 (moderate), and worst months as September–February. Categorical depression severity and percentage of the general population predicted to have lower BDI II scores were determined from a cross-walk table (21).
Identification of Mutations in PER3.
We collected human families that showed the trait of habitual early spontaneous awakening segregating in an autosomal dominant pattern. To identify the mutations responsible for this phenotype, we used a candidate gene approach to screen at least one DNA sample from each family. We sequenced CLOCK, BMAL1, PER1-3, CRY1-2, DEC1-2, CK1δ/ε, and other known clock genes. PER3-P415A/H417R mutations were found only in this family (out of 60 families). No other mutations were found in mutation carriers in this family. Sequencing included at least 100 bases flanking exons of all candidate genes.
Plasmid Construction.
hPER3 cDNA (Open Biosystems) was sequenced and compared with the National Center for Biological Information reference sequence for hPER3 mRNA. Two insertions were identified and removed by PCR. hPER3 was amplified by PCR using the modified hPER3 cDNA as a template and subsequently ligated into a pcDNA3.1/myc-His(−) vector (Invitrogen). pcDNA-hPER3-P415A/H417R-myc-His was generated by PCR-based site-directed mutagenesis using pcDNA-hPER3-WT-myc-His as a template. hPER3-WT-myc-His and hPER3-P415A/H417R-myc-His were subsequently subcloned into the pUAST vector and p3XFLAG-CMV-10 vector.
Generation of Transgenic Mice.
hPER3-WT-Tg (carrying the WT human PER3 gene) and hPER3-P415A/H417R-Tg (carrying a mutant human PER3 gene) transgenic mice were generated as described previously (17). All mouse work was performed in accordance with the guidelines of the Institutional Animal Care and Use Committee at the University of California, San Francisco.
Fly Cross Schemes and Behavioral Analyses.
UAShPER3-WT-myc-His, UAShPER3-P415A/H417R-myc-His and w1118 (control) females were crossed to timGAL4 (42), cryGAL4-16 (43), or w1118 (control) males. Locomotor activity levels of flies were monitored using Trikinetics Activity Monitors for 7 d of the LD conditions, followed by 7 d of DD. The time of onset or offset of locomotor activity in LD was calculated by determining the largest 1.5-h increase or decrease in normalized average activity for each fly over the last 6 h before lights on or the first 6 h after lights off. The time designation refers to the end point of the maximal activity decrease or increase, as averaged among individual flies in each genotype. For DD rhythmicity, χ2 periodogram analyses were performed using ClockLab (Actimetrics). Rhythmic flies were defined as those in which the χ2 power was ≥10 above the significance line. Period calculations also considered all flies with a rhythmic power ≥10.
Real-Time RT-PCR and Protein Extraction from Fly Heads.
Fly heads were harvested, and total RNA was isolated with TRIzol reagent (Invitrogen). After removal of contaminating genomic DNA by RQ1 DNase (Promega) digestion, total RNA was directly amplified with the QuantiTect SYBR Green RT-PCR kit (Qiagen). The following primers were used: tim.f, 5′-CTGGGGAGTGACCATGG-3′; tim.r, 5′-GCTGGAATCGCCACTG-3′. Rp49 served as an internal control. For protein extraction, fly heads were homogenized in extraction buffer [20 mM Hepes pH 7.5, 100 mM KCl, 5% (vol/vol) glycerol, 20 mM β-glycerophosphate, 100 μM sodium orthovanadate, 10 mM EDTA, 0.1% Triton X-100, 1 mM DTT, protease inhibitor mixture (Roche), and phosphatase inhibitor mixture (Active Motif)].
Generation of Transgenic Mice.
hPER3-WT (carrying a WT human PER3 gene) and hPER3-P415A/H417R (carrying a mutant human PER3 gene) transgenic mice were generated as described previously (17). Human BAC (CTD-2567K19) containing the entire PER3 gene was obtained from Invitrogen. This BAC clone is expected to contain all cis-acting regulatory elements necessary to accurately reproduce an endogenous expression pattern (44). All relevant segments generated by PCR and recombination were sequence-confirmed. Detailed mapping was carried out for the modified BAC to ensure that the correct construct was obtained. All mouse work was performed in accordance with the guidelines of the Institutional Animal Care and Use Committee at the University of California, San Francisco.
Mouse Wheel-Running Activity Monitoring and Analyses.
Male WT, hPER3-WT-Tg, hPER3-P415A/H417R-Tg, and Per3−/− (32) mice on a C57BL6 background (aged 2–6 mo) were used for this experiment. Mouse housing, handling, and wheel-running activity monitoring were performed as described previously (17). For behavioral profiles, each data point represents the average wheel-running activity across 7 d for a single 20-min bin. Mice were entrained to LD for at least 1 wk and subsequently released into DD or LL for at least 2 wk. For DD and LL rhythmicity, χ2 periodogram analyses were performed using ClockLab (Actimetrics). The activity onset and offset times were calculated using standard parameters in the ClockLab software. The default template was 6 h of inactivity followed by 6 h of activity for onsets (or vice versa for offsets). To calculate time of onset or offset of wheel-running activity in LD 4:20, the largest 1-h increase or decrease in activity for each mouse was determined. The time designation refers to the end point of the maximal activity decrease or increase, as averaged among individual mice in each genotype. “Phase delay” is the hours of delayed-onset ZT, calculated by comparing mutant transgenic mice with control mice. All of the mice used in this work were on a C57BL6 background except the mice shown in Fig. 2 E and F, Bottom, which were on a C57/SJL hybrid background.
qRT-PCR of Mouse Liver.
Total RNA was isolated using the miRNeasy Mini Kit (Qiagen) from liver samples of transgenic animals at ZT12, and qRT-PCR was performed as follows. After generation of cDNA by SuperScript III (Life Technologies), duplex TaqMan qPCR assays were performed in triplicate with probes specific for genes of interest and an endogenous control, Gapdh (Life Technologies; 4308313). Data were calculated using the standard curve method. Expression levels of genes of interest were then normalized to levels of Gapdh. PER3 TaqMan assays were purchased from Integrated DNA Technology.
Luciferase Assay.
HEK293T cells were transfected with a Per2::luc reporter and other expression constructs (100 ng per well of a 24-well plate unless noted otherwise). For Per2 expression, 200 ng of the construct was used. For PER3 titration, 200, 50, or 12.5 ng of construct was used for transfection. A constitutively expressed Renilla luciferase construct served as a control. Assays were performed at 24 h posttransfection using the Promega Dual-Luciferase Reporter Assay System according to the manufacturer’s instructions. Results are expressed as mean ± SEM. All experiments were performed at least twice, and all data presented are an average of three technical replicates.
Protein Extraction and Western Blot Analysis.
Nuclear and cytoplasmic protein extraction was performed using a Nuclear Extract Kit (Active Motif). For whole-cell extracts, HEK293 cells were homogenized in RIPA buffer [25 mM Tris⋅HCl pH 7.6, 150 mM NaCl, 1% Nonidet P-40, 1% sodium deoxycholate, 0.1% SDS, protease inhibitor mixture (Roche), and phosphatase inhibitor mixture (Active Motif)], and fly heads were homogenized in extraction buffer [20 mM Hepes pH 7.5, 100 mM KCl, 5% (vol/vol) glycerol, 20 mM β-glycerophosphate, 100 μM sodium orthovanadate, 10 mM EDTA, 0.1% Triton X-100, 1 mM DTT, protease inhibitor mixture (Roche), and phosphatase inhibitor mixture (Active Motif)]. After centrifugation, supernatants were boiled for 5 min in SDS sample buffer and then separated by SDS/PAGE. After transfer to nitrocellulose membranes (Immobilon FL; Millipore EMD) and blocking with Odyssey blocking buffer (LI-COR Biosciences), proteins were detected with the following antibodies: rabbit anti-cMyc A-14 (Santa Cruz Biotechnology), 1:500; mouse anti-dLam ADL101 (Developmental Studies Hybridoma Bank), 1:1,000; mouse anti–β-tubulin E7 (Developmental Studies Hybridoma Bank), 1:1,000; mouse anti-hPER3, 1:1,000; rabbit anti-LMNB1 (Abcam and Santa Cruz Biotechnology), 1:2,000 rabbit anti-caspase 3 (Cell Signaling Technology); 1:2,000; rabbit anti-dPER, 1:5,000; goat anti-mPER1 N-20 (Santa Cruz Biotechnology), 1:500; mouse anti-mPER2 #1 (Alpha Diagnostic International; PER-21A), 1:500; mouse anti-GAPDH (Millipore EMD), 1:25,000; β-actin (Abcam; AC-15), 1:5,000; rabbit anti-GFP (Abcam), 1:1,000; and secondary donkey anti-rabbit/mouse/goat antibodies (LI-COR Biosciences), 1:10,000.
Signals were scanned and quantified using Odyssey (LI-COR Biosciences). Nuclear PER3/PER1/PER2 was normalized to LMNB1, whereas cytoplasmic PER3/PER1/PER2 was normalized to caspase 3, GAPDH, or β-actin. For whole-cell extracts, PER3/PER2/dPER was normalized to GAPDH or β-actin. The values of PER3-WT were set to 1.
Transient Transfection and Protein Stability Assays.
HEK293T cells were plated into 12-well plates and then transfected with Lipofectamine 3000 transfection reagent (Life Technologies). The following DNA constructs were used for transfections: pCMV10-FLAG-hPER3-WT, pCMV10-FLAG-hPER3-P415A/H417R, and pCS2-myc-hPER2 (40). CHX (100 μg/mL; Santa Cruz Biotechnology) was added approximately 40 h later. Cells were harvested at 4 h or 8 h after CHX treatment.
Bioluminescence Degradation Assay.
hPER1-LUC, hPER2-LUC, and hPER3-LUC fusion protein-expressing vectors were created by inserting cDNA coding the Per-Luc gene between EcoRI and BamHI sites in the p3XFLAG-CMV-10 vector. HEK293T cells were transfected with PER-LUC vectors and cultured for 24 h. The cultured medium was exchanged to the recording medium [phenol-red free DMEM (Sigma-Aldrich) supplemented with 10% (vol/vol) FBS, 3.5 mg/mL glucose, 25 U/mL penicillin, 25 μg/mL streptomycin, 0.05 mM luciferin, and 10 mM Hepes-NaOH; pH 7.0] containing 100 μg/mL CHX (Santa Cruz Biotechnology). The luciferase activity of PER-LUC was recorded at 10-min intervals at 37 °C with a LumiCycle luminometer (Actimetrics). The luminescence signals were fitted to exponential functions to quantify the half-life of PER-LUC.
Tail Suspension Test.
The tail suspension test was performed as described previously (45). Mice were hung individually on an aluminum suspension bar using paper adhesive tape at 60 cm above the tabletop. The tape was placed ∼1 cm from the tip of the tail. Animals were allowed to hang for 6 min. The test was video-recorded, and the duration of immobility was scored later by a single observer blinded to genotype. Mice were considered immobile only when hanging passively and completely motionless.
Forced Swim Test.
The forced swim test followed the protocol described previously (45). Mice were placed into a 4-L glass beaker filled with 23–25 °C water for 6 min. The latency to the first bout of immobility was recorded starting immediately after the animal was placed in water. A mouse was considered immobile only when it ceased all active behaviors (i.e., struggling, swimming, jumping) and remained passively floating or making minimal movements to maintain its nostrils above water. Immobility was scored only during the last 4 min of the test.
Sucrose Intake Test.
Mice were provided with two drinking bottles, one containing 2% (wt/vol) sucrose solution and the containing other sterile water, for 4 d before the start of the experiment. Testing was performed in the home cage. The mice were presented with sucrose solution for a 2-h period each day on 4 consecutive days. The amount of sucrose solution intake was measured, and a daily average was calculated.
Surgery, EEG/EMG Monitoring, and Data Analysis.
Surgery, EEG/EMG monitoring, and EEG data acquisition were performed for the indicated number of 6- to 7-mo-old mice in the Stanford Sleep and Circadian Neurobiology Laboratory and were carried out as described previously (41). Wakefulness was determined by low-amplitude, mixed-frequency (>4 Hz) EEG with continuous large fluctuations in EMG. Slow-wave, or NREM, sleep was determined by high-amplitude, low-frequency (0.25–4 Hz) EEG with no fluctuation in EMG. REM sleep was determined by low-amplitude, high-frequency EEG (similar to wake stage, but with rhythmic α waves at 8–9 Hz) with no fluctuation in EMG. For power spectral analysis, NREM δ and REM θ EEG power were analyzed with fast Fourier transform for band frequencies between 0.25 and 4 Hz and between 4 and 9 Hz, respectively.
Acknowledgments
We thank Brian Curtis for help with recruiting, coordinating, and performing structured participant interviews and entering data, and Dr. L. Czajkowski for help in characterizing the affective phenotype. This work is supported by National Institutes of Health Grants HL059596, GM079180, and NS072360 and by a generous gift of the William K. Bowes Foundation (to Y.-H.F. and L.J.P.).
Footnotes
The authors declare no conflict of interest.
This article contains supporting information online at www.pnas.org/lookup/suppl/doi:10.1073/pnas.1600039113/-/DCSupplemental.
References
- 1.McClung CA. Circadian rhythms and mood regulation: Insights from pre-clinical models. Eur Neuropsychopharmacol. 2011;21(Suppl 4):S683–S693. doi: 10.1016/j.euroneuro.2011.07.008. [DOI] [PMC free article] [PubMed] [Google Scholar]
- 2.Kaminski-Hartenthaler A, et al. Melatonin and agomelatine for preventing seasonal affective disorder. Cochrane Database Syst Rev. 2015;11:CD011271. doi: 10.1002/14651858.CD011271.pub2. [DOI] [PubMed] [Google Scholar]
- 3.Scott AJ, Monk TH, Brink LL. Shiftwork as a risk factor for depression: A pilot study. Int J Occup Environ Health. 1997;3(Supplement 2):S2–S9. [PubMed] [Google Scholar]
- 4.Emens J, Lewy A, Kinzie JM, Arntz D, Rough J. Circadian misalignment in major depressive disorder. Psychiatry Res. 2009;168(3):259–261. doi: 10.1016/j.psychres.2009.04.009. [DOI] [PubMed] [Google Scholar]
- 5.Hasler BP, Buysse DJ, Kupfer DJ, Germain A. Phase relationships between core body temperature, melatonin, and sleep are associated with depression severity: further evidence for circadian misalignment in non-seasonal depression. Psychiatry Res. 2010;178(1):205–207. doi: 10.1016/j.psychres.2010.04.027. [DOI] [PMC free article] [PubMed] [Google Scholar]
- 6.Johansson C, et al. Circadian clock-related polymorphisms in seasonal affective disorder and their relevance to diurnal preference. Neuropsychopharmacology. 2003;28(4):734–739. doi: 10.1038/sj.npp.1300121. [DOI] [PubMed] [Google Scholar]
- 7.Partonen T, et al. Three circadian clock genes, Per2, Arntl, and Npas2, contribute to winter depression. Ann Med. 2007;39(3):229–238. doi: 10.1080/07853890701278795. [DOI] [PubMed] [Google Scholar]
- 8.McCarthy MJ, Nievergelt CM, Kelsoe JR, Welsh DK. A survey of genomic studies supports association of circadian clock genes with bipolar disorder spectrum illnesses and lithium response. PLoS One. 2012;7(2):e32091. doi: 10.1371/journal.pone.0032091. [DOI] [PMC free article] [PubMed] [Google Scholar]
- 9.Kim H-I, et al. Association of CLOCK, ARNTL, and NPAS2 gene polymorphisms and seasonal variations in mood and behavior. Chronobiol Int. 2015;32(6):785–791. doi: 10.3109/07420528.2015.1049613. [DOI] [PubMed] [Google Scholar]
- 10.McClung CA. Circadian genes, rhythms, and the biology of mood disorders. Pharmacol Ther. 2007;114(2):222–232. doi: 10.1016/j.pharmthera.2007.02.003. [DOI] [PMC free article] [PubMed] [Google Scholar]
- 11.Hek K, et al. A genome-wide association study of depressive symptoms. Biol Psychiatry. 2013;73(7):667–678. doi: 10.1016/j.biopsych.2012.09.033. [DOI] [PMC free article] [PubMed] [Google Scholar]
- 12.Byrne EM, et al. Testing the role of circadian genes in conferring risk for psychiatric disorders. Am J Med Genet B Neuropsychiatr Genet. 2014;165B(3):254–260. doi: 10.1002/ajmg.b.32230. [DOI] [PMC free article] [PubMed] [Google Scholar]
- 13.Desan PH, et al. Genetic polymorphism at the CLOCK gene locus and major depression. Am J Med Genet. 2000;96(3):418–421. doi: 10.1002/1096-8628(20000612)96:3<418::aid-ajmg34>3.0.co;2-s. [DOI] [PubMed] [Google Scholar]
- 14.Kishi T, et al. The CLOCK gene and mood disorders: A case-control study and meta-analysis. Chronobiol Int. 2011;28(9):825–833. doi: 10.3109/07420528.2011.609951. [DOI] [PubMed] [Google Scholar]
- 15.Jones CR, et al. Familial advanced sleep-phase syndrome: A short-period circadian rhythm variant in humans. Nat Med. 1999;5(9):1062–1065. doi: 10.1038/12502. [DOI] [PubMed] [Google Scholar]
- 16.Toh KL, et al. An hPer2 phosphorylation site mutation in familial advanced sleep phase syndrome. Science. 2001;291(5506):1040–1043. doi: 10.1126/science.1057499. [DOI] [PubMed] [Google Scholar]
- 17.Xu Y, et al. Functional consequences of a CKIdelta mutation causing familial advanced sleep phase syndrome. Nature. 2005;434(7033):640–644. doi: 10.1038/nature03453. [DOI] [PubMed] [Google Scholar]
- 18.Brennan KC, et al. Casein kinase iδ mutations in familial migraine and advanced sleep phase. Sci Transl Med. 2013;5(183):183ra56. doi: 10.1126/scitranslmed.3005784. [DOI] [PMC free article] [PubMed] [Google Scholar]
- 19.Roenneberg T, et al. A marker for the end of adolescence. Curr Biol. 2004;14(24):R1038–R1039. doi: 10.1016/j.cub.2004.11.039. [DOI] [PubMed] [Google Scholar]
- 20.Horne JA, Ostberg O. A self-assessment questionnaire to determine morningness-eveningness in human circadian rhythms. Int J Chronobiol. 1976;4(2):97–110. [PubMed] [Google Scholar]
- 21.Choi SW, Schalet B, Cook KF, Cella D. Establishing a common metric for depressive symptoms: Linking the BDI-II, CES-D, and PHQ-9 to PROMIS depression. Psychol Assess. 2014;26(2):513–527. doi: 10.1037/a0035768. [DOI] [PMC free article] [PubMed] [Google Scholar]
- 22.Beck AT. Beck Depression Inventory. The Psychological Corporation; San Antonio, TX: 1978. [Google Scholar]
- 23.Young MA, Blodgett C, Reardon A. Measuring seasonality: Psychometric properties of the Seasonal Pattern Assessment Questionnaire and the Inventory for Seasonal Variation. Psychiatry Res. 2003;117(1):75–83. doi: 10.1016/s0165-1781(02)00299-8. [DOI] [PubMed] [Google Scholar]
- 24.Rosenthal NE, Genhart MJ, Sack DA, Skerwer RG, Wehr TA. Seasonal affective disorder and its relevance for the understanding and treatment of bulimia. In: Hudson JI, Pope HG, editors. The Psychobiology of Bulimia. American Psychiatric Press; Washington, DC: 1984. pp. 205–228. [Google Scholar]
- 25.Andrade L, et al. The epidemiology of major depressive episodes: Results from the International Consortium of Psychiatric Epidemiology (ICPE) Surveys. Int J Methods Psychiatr Res. 2003;12(1):3–21. doi: 10.1002/mpr.138. [DOI] [PMC free article] [PubMed] [Google Scholar]
- 26.Karatsoreos IN. Links between circadian rhythms and psychiatric disease. Front Behav Neurosci. 2014;8:162. doi: 10.3389/fnbeh.2014.00162. [DOI] [PMC free article] [PubMed] [Google Scholar]
- 27.van der Veen DR, Archer SN. Light-dependent behavioral phenotypes in PER3-deficient mice. J Biol Rhythms. 2010;25(1):3–8. doi: 10.1177/0748730409356680. [DOI] [PubMed] [Google Scholar]
- 28.Yagita K, et al. Dimerization and nuclear entry of mPER proteins in mammalian cells. Genes Dev. 2000;14(11):1353–1363. [PMC free article] [PubMed] [Google Scholar]
- 29.Steiger A, Dresler M, Kluge M, Schüssler P. Pathology of sleep, hormones and depression. Pharmacopsychiatry. 2013;46(Suppl 1):S30–S35. doi: 10.1055/s-0033-1337921. [DOI] [PubMed] [Google Scholar]
- 30.Pittendrigh CS, Daan S. A functional analysis of circadian pacemakers in nocturnal rodents. J Comp Physiol. 1976;106:223–252. [Google Scholar]
- 31.Bae K, et al. Differential functions of mPer1, mPer2, and mPer3 in the SCN circadian clock. Neuron. 2001;30(2):525–536. doi: 10.1016/s0896-6273(01)00302-6. [DOI] [PubMed] [Google Scholar]
- 32.Shearman LP, Jin X, Lee C, Reppert SM, Weaver DR. Targeted disruption of the mPer3 gene: Subtle effects on circadian clock function. Mol Cell Biol. 2000;20(17):6269–6275. doi: 10.1128/mcb.20.17.6269-6275.2000. [DOI] [PMC free article] [PubMed] [Google Scholar]
- 33.Archer SN, et al. A length polymorphism in the circadian clock gene Per3 is linked to delayed sleep phase syndrome and extreme diurnal preference. Sleep. 2003;26(4):413–415. doi: 10.1093/sleep/26.4.413. [DOI] [PubMed] [Google Scholar]
- 34.Ojeda DA, et al. A novel association of two non-synonymous polymorphisms in PER2 and PER3 genes with specific diurnal preference subscales. Neurosci Lett. 2013;553:52–56. doi: 10.1016/j.neulet.2013.08.016. [DOI] [PubMed] [Google Scholar]
- 35.Hida A, et al. Screening of clock gene polymorphisms demonstrates association of a PER3 polymorphism with morningness-eveningness preference and circadian rhythm sleep disorder. Sci Rep. 2014;4:6309. doi: 10.1038/srep06309. [DOI] [PMC free article] [PubMed] [Google Scholar]
- 36.Parsons MJ, et al. Polymorphisms in the circadian expressed genes PER3 and ARNTL2 are associated with diurnal preference and GNβ3 with sleep measures. J Sleep Res. 2014;23(5):595–604. doi: 10.1111/jsr.12144. [DOI] [PMC free article] [PubMed] [Google Scholar]
- 37.Hegerl U, Hensch T. The vigilance regulation model of affective disorders and ADHD. Neurosci Biobehav Rev. 2014;44:45–57. doi: 10.1016/j.neubiorev.2012.10.008. [DOI] [PubMed] [Google Scholar]
- 38.Chellappa SL, et al. Human melatonin and alerting response to blue-enriched light depend on a polymorphism in the clock gene PER3. J Clin Endocrinol Metab. 2012;97(3):E433–E437. doi: 10.1210/jc.2011-2391. [DOI] [PubMed] [Google Scholar]
- 39.Chellappa SL, et al. Light modulation of human sleep depends on a polymorphism in the clock gene Period3. Behav Brain Res. 2014;271:23–29. doi: 10.1016/j.bbr.2014.05.050. [DOI] [PubMed] [Google Scholar]
- 40.Xu Y, et al. Modeling of a human circadian mutation yields insights into clock regulation by PER2. Cell. 2007;128(1):59–70. doi: 10.1016/j.cell.2006.11.043. [DOI] [PMC free article] [PubMed] [Google Scholar]
- 41.He Y, et al. The transcriptional repressor DEC2 regulates sleep length in mammals. Science. 2009;325(5942):866–870. doi: 10.1126/science.1174443. [DOI] [PMC free article] [PubMed] [Google Scholar]
- 42.Emery P, So WV, Kaneko M, Hall JC, Rosbash M. CRY, a Drosophila clock and light-regulated cryptochrome, is a major contributor to circadian rhythm resetting and photosensitivity. Cell. 1998;95(5):669–679. doi: 10.1016/s0092-8674(00)81637-2. [DOI] [PubMed] [Google Scholar]
- 43.Emery P, et al. Drosophila CRY is a deep brain circadian photoreceptor. Neuron. 2000;26(2):493–504. doi: 10.1016/s0896-6273(00)81181-2. [DOI] [PubMed] [Google Scholar]
- 44.Heintz N. BAC to the future: The use of bac transgenic mice for neuroscience research. Nat Rev Neurosci. 2001;2(12):861–870. doi: 10.1038/35104049. [DOI] [PubMed] [Google Scholar]
- 45.Castagné V, Moser P, Roux S, Porsolt RD. Rodent models of depression: forced swim and tail suspension behavioral despair tests in rats and mice. Curr Protoc Pharmacol. 2010;49(5.8):5.8.1–5.8.14. doi: 10.1002/0471141755.ph0508s49. [DOI] [PubMed] [Google Scholar]


