

Abstract
Although the role of CD4+ T cells and in particular Tregs and Th17 cells is established in myelodysplastic syndrome(MDS), the contribution of other components of immune system is yet to be elucidated fully. In this study we investigated the number and function of myeloid derived suppressor cells (MDSCs) in fresh peripheral blood and matched bone marrow samples from 42 MDS patients and the potential correlation with risk of disease progression to acute myeloid leukemia (AML). In peripheral blood, very low-/low risk patients had significantly lower median MDSC number (0.16×10⁹/L(0.03–0.40)) compared to intermediate-/high-/very high risk patients, in whom median MDSC counts was 0.52×10⁹/L(0.10–1.78), p < 0.005. When co-cultured with CD4+ effector T-cells (T-effectors), MDSCs suppress Teffector proliferation in both allogeneic and autologous settings. There was a positive correlation between the number of Tregs and MDSCs (Spearman R = 0.825, p < 0.005) in high risk and not low risk patients. We also investigated MDSCs' expression of bone marrow-homing chemokine receptors, and our data shows that MDSCs from MDS patients express both CXCR4 and CX3CR1 which might facilitate migration of MDSCs to bone marrow. Monocytic MDSCs(M-MDSCs) which are more frequent in the peripheral blood express higher levels of CX3CR1 and CXCR4 than the granulocytic subtype (G-MDSCs), and circulating M-MDSCs had significantly higher CX3CR1 expression compared to bone-marrow M-MDSCs in intermediate-/high-/very high risk MDS. Our results suggest that MDSCs contribute significantly to the dysregulation of immune surveillance in MDS, which is different between low and high risk disease. It further points at mechanisms of MDSCs recruitment and contribution to the bone marrow microenvironment.
Keywords: CD4+ T cells; CX3CR1; CXCR4; cytokines; flow cytometry; immune-surveillance, AML; MDS; MDSCs; Tregs
Introduction
MDS is a group of diseases with clonal proliferation of dysplastic bone marrow haematopoietic cells. Recent studies have established that T cell mediated immune dysregulation is an important feature of MDS. The “immune signature” is substantially different in low and high risk MDS. While the low risk disease is characterized by the expansion of pro-inflammatory T cells (in particular Th17), the expansion of T regulatory cells (Tregs) is the main feature of high risk disease. However, the mechanism of this immune-signature switch is not fully understood.1 Myeloid derived suppressors cells (MDSCs) are a group of immature myeloid cells with a potent immunosuppressive effect which are expanded in an inflammatory environment.2 The role of MDSCs in suppressing immune mediated tumor surveillance and T cell polarization has been demonstrated in solid tumors.3 It has also been shown that MDSCs not only could induce myelodysplasia4 but also that targeting them by NK cells may be therapeutically beneficial in MDS.5 However, it is unclear whether MDSCs play a similar role in MDS as in solid tumors in transforming the inflammatory environment in low risk disease to a more inhibitory environment in high risk MDS.
Two major subsets of MDSCs have been described; Granulocytic (G)-MDSC and monocytic (M)-MDSC, and the frequency of the subsets vary between different tissues.6 In humans, MDSCs have a phenotype that is lineage negative and the cells are usually CD11b+, CD33+ & HLA-DR neg/low.7 MDSCs have a key role in immune response regulation and the plasticity of CD4+ T cells. MDSCs produce Interleukin (IL)-10, Transforming Growth Factor (TGF)-β, arginase 1 (ARG1) and inducible nitric oxide synthase (iNOS2), suppress T cells by depriving them of arginine and cysteine and are capable of inducing Tregs.8,9 G-MDSC can in addition produce reactive oxygen species (ROS). MDSC depletion in tumor-bearing mice inhibits tumor progression and metastasis, suggesting that these cells have a key role in tumor specific immune response.10-12 Although the increased number of MDSCs in MDS has been shown,4 it is not clear whether this expansion is MDS subtype specific and which subsets of MDSCs are expanded. The effect of MDSCs on T cells function, in particular CD4+ T effectors and Tregs, in MDS has not been studied previously.
Migration of MDSCs to cancer environment is mediated by the CXCR4/CXCL12-axis.13 The CXCR4-CXCL12 interaction is important for keeping the haematopoietic stem cells in their niches,14,15 and bone marrow-plasma from MDS patients shows elevated CXCL12 levels.16 CX3CR1 binds to chemokine and adhesion molecule CX3CL1, a transmembrane cleavable protein whose release is induced by IFNγ and TNF-α,17 cytokines present in low risk MDS bone marrow.18,19 The aims of this study were to investigate the MDSCs number, distribution and function, correlation with the number of Tregs, their bone marrow homing chemokine receptor expression and the correlation with the risk of progression to AML.
Results
Higher numbers of MDSCs in high risk MDS patients
Bone marrow milieu in MDS patients evolves from a pro-inflammatory environment in low risk patients into an immunosuppressive one in high risk MDS. To assess the potential role of MDSCs in this shift, we compared MDSC frequency and absolute number in MDS patients within different IPSS-R categories; Very Low Risk (VLR)/Low Risk (LR) compared to Intermediate Risk (INT)/High Risk (HR)/Very High Risk (VHR) MDS. Total MDSCs were defined as lineageneg/CD11b+/CD33+ cells.
In peripheral blood from VLR/LR categories median MDSC numbers (defined as lineageneg/CD11b+/CD33+, see Fig. 4) were significantly lower (0.16 × 10⁹/L (0.03–0.40)) compared to INT+HR+VHR patients, in whom median MDSC counts were 0.52 × 10⁹/L (0.10–3.92), p < 0.005 (Fig. 1A). Peripheral blood MDSCs were higher in VLR + LR MDS compared to healthy age matched donors (median 2.53 % (0.3 – 10.1) vs. 1.03 % (0.40–2.39), p < 0.0003, and higher in INT + HR + VHR patients (median 5.87% (2.13 – 40.90)) compared to VLR + LR patients (p = 0.0006) and healthy donors (p = 0.040) (Fig. 1B). The same difference was found when comparing MDS patients based on WHO classification. Patients with bone marrow blasts 5 % or more (RAEB) had higher absolute counts 0.38×10⁹/L (0.10 – 3.92 × 10⁹) vs. patients with less than 5% bone marrow blasts (RC/RARS/RCMD/MDS-U) (0.16 × 10⁹/L (0.03–0.40 × 10⁹)), p < 0.01, (Fig. 1C). MDSC percentages were higher in RAEB, median 3.55 (2.13 – 40.90) compared to (RC, RARS, RCMD, MDS-U, median 1.43 (0.30- 10.10)) p = 0.0151, as well as healthy donors (median 1.03 (0.40–2.39)) p < 0.0001. Patients with less than 5 % bone marrow blasts also had higher MDSC percentages compared to healthy donors, p = 0.0015. (Fig. 1D).
Figure 4.
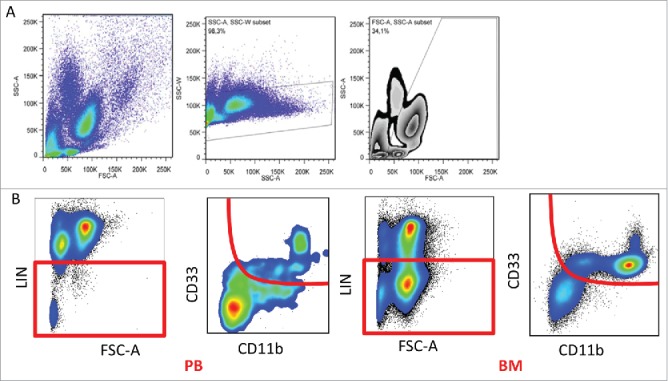
Gating strategy. (A) The gating strategy to exclude doublets, debris and eosinophils based on SSC and FSC. (B) Representative flow cytometry plots with gating strategy based on selecting lineage negative population in peripheral blood and bone marrow, followed by gating out CD11b/CD33-double positive cells.
Figure 1.
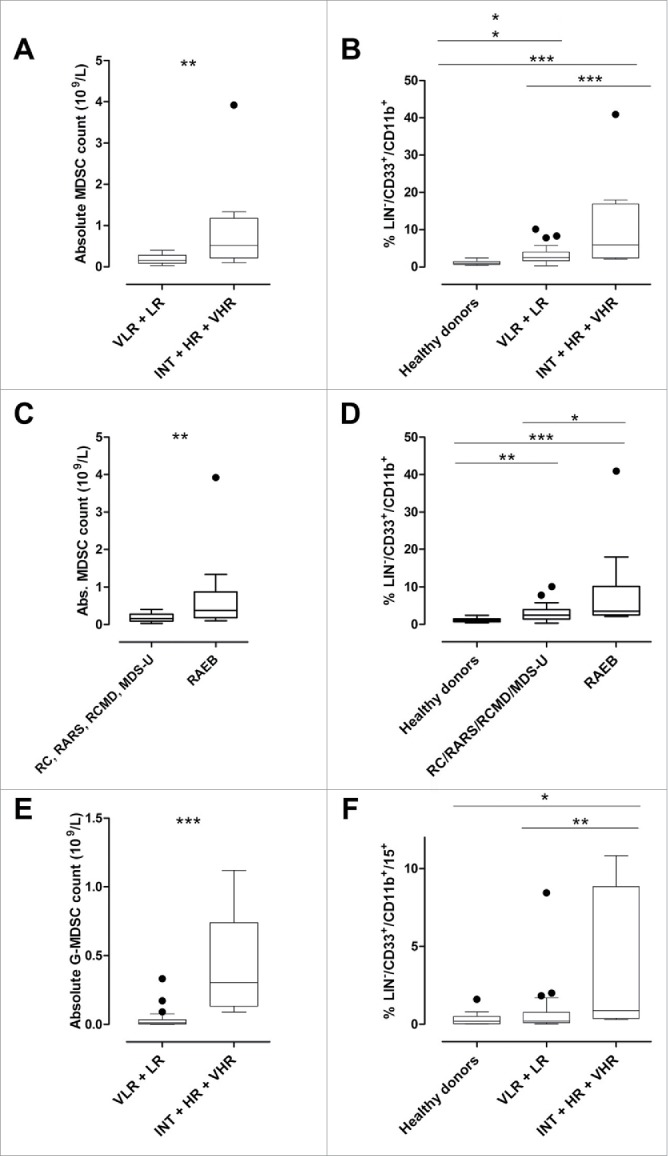
MDS patients' peripheral blood frequencies of MDSCs differ in low- and high risk disease. (A) Box-and-whisker plots showing comparison of MDSC absolute counts in IPSS-R categories showed significant difference between VLR + LR and INT+HR+VHR, p < 0.005. (B) Healthy donors have lower peripheral blood MDSC percentages compared to MDS patients with VLR+LR disease, p = 0 .0006, and VLR+LR have lower percentages than INT+HR+VHR, p < 0.05. There was also a significant difference between healthy donors and INT+HR+VHR patients, p = 0.0003. The percentages were calculated from the leukocyte gate before lineage-gating, as described before.33 (C) Absolute MDSC counts are higher in patients with bone marrow blasts 5% or more (RAEB, median 0.38 (0.10–3.92 × 10⁹/L) compared to patients with less than 5 % bone marrow blasts (RC, RARS, RCMD, MDS-U, median 0.16 (0.03–0.40 × 10⁹)) p < 0.01. (D) MDSC percentages are higher in patients with bone marrow blasts 5% or more (RAEB, median 3.55 (2.13–40.90) compared to patients with less than 5% bone marrow blasts (RC, RARS, RCMD, MDS-U, median 1.43 (0.30–10.10)) p = 0.0151, and compared to healthy donors (median 1.03 (0.40–2.39)) p < 0.0001. Patients with less than 5% bone marrow blasts also had higher MDSC percentages compared to healthy donors, p = 0.0015. (E) Absolute G-MDSC counts were higher in MDS patients with INT+HR+VHR than VLR+LR disease, p = 0.0001. (F) G-MDSC percentages were significantly higher in INT+HR+VHR compared to VLR+LR (p < 0.01) and healthy donors (p = 0.02).
In RAEB patients there was a positive correlation between the absolute numbers of MDSC and Tregs in peripheral blood (Spearman R = 0.825, p < 0.005) which was not the case in patients with less than 5 % bone marrow blasts (Fig. S1A).
G-MDSC subset is expanded in high risk MDS
G-MDSCs are a subtype of MDSCs which are phenotypically and functionally different from M-MDSCs.20 G-MDSCs were defined as lineageneg/CD11b+/CD33+/CD15+. G-MDSCs were increased (frequency and absolute numbers) in INT+HR+VHR disease (median 0.88 % (0.3–10.8) (median 0.31 × 10⁹/L) compared to VLR+LR disease (median 0.22 % (0.02–8.43) (median 0.011 × 10⁹/L); p < 0.01 (p = 0.0001) and to healthy donors (median 0.2 % (0.02–1.6)); p = 0.02 (Fig. 1E and Fig. 1F). This difference was also significant when comparing RAEB versus RC/RARS/RCMD/MDS-U patients (median 0.13 vs. 0.01, p < 0.01) (Fig. S1B).
In high- and low risk MDS patients, M-MDSCs were higher in peripheral blood (median 0.52% (0.06–6.3)) compared to bone marrow (median 0.27% (0.002–1.29), p < 0.02), (Fig. S1C) and the same pattern was seen in age-matched healthy donors (median bone marrow-M-MDSC 0.1 % (0.1–0.4), data not shown.
G- and M-MDSC subsets were positive for intracellular IL-10 and TGF-β. Both IL-10 and TGF-β levels were higher in G-MDSCs compared to M-MDSCs (relative median fluorescence intensity (R-MFI) 7.9 (2.2–48.4) vs. 3.8 (0.8–10.5), p = 0.003 for IL-10 and R-MFI 15.0 (1.4–30.4) vs. 4.8 (0.4–12.4), p = 0.02 for TGF-β) (Fig. 2A and Fig. S1D and E).
Figure 2.
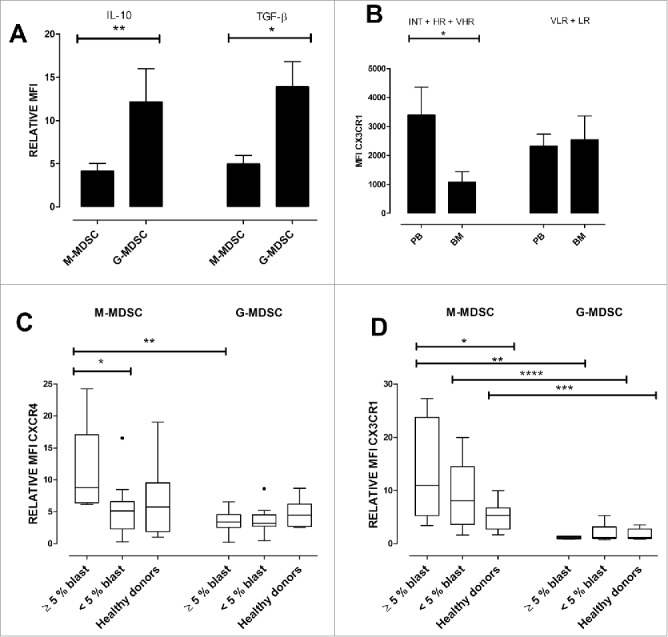
MDSCs in MDS patients produce inhibitory cytokines and express bone marrow homing receptors. (A) G-MDSCs show higher relative MFI of IL-10 and TGF-β compared to M-MDSCs p = 0.003 and 0.02, respectively. (B) M-MDSCs CX3CR1 expression was significantly higher in peripheral blood from RAEB patients versus in bone marrow (2862 vs. 684, p < 0.05) (C) Left panel: In patients with more than 5% bone marrow blasts chemokine receptor CXCR4 was higher in M-MDSCs compared to G-MDSCs p = 0.003. CXCR4 expression was higher on M-MDSCs derived from patients with more than 5% bone marrow blasts compared to patients with less than 5% bone marrow blasts p = 0.01. (D) Expression of CX3CR1 was higher in M-MDSCs from patients with more than 5% bone marrow blasts (RAEB) compared to healthy donors, p = 0.02. CX3CR1 expression was not significantly different between patients with less than 5% bone marrow blasts and healthy donors. The expression of CX3CR1 was significantly higher in M-MDSCs compared to G-MDSCs for all three groups, RAEB vs. RAEB p < 0.02, between patients with less than 5% bone marrow blasts p = 0.0005, and healthy donors vs. healthy donors, p = 0.003.
Chemokine receptor expression on MDS-MDSCs
We hypothesized that immunosuppression mediated by MDSCs protects the bone marrow MDS clone. The next step therefore was to investigate bone marrow homing receptor expression on circulating MDSCs. In MDS the G-MDSCs and M-MDSCs show different chemokine receptor expression patterns. CXCR4 is responsible for homing to bone marrow and stem-cell niches,21 while CX3CR1 is involved in bone marrow metastasis.22
M-MDSCs CX3CR1 expression was significantly higher in peripheral blood from intermediate and high risk MDS patients compared to bone marrow (MFI 2862 vs. 684, p < 0.05) (Fig. 2B).
Both M-MDSCs and G-MDSCs express CXCR4 but this was significantly higher on M-MDSCs compared to G-MDSCs in RAEB patients (p = 0.003). There was also higher CXCR4 expression on M-MDSCs derived from patients with >5% bone marrow blasts when compared to patients with <5% bone marrow blasts (p = 0.01) (Fig. 2C). There was no statistically significant difference between healthy donor M-MDSCs and G-MDSCs in terms of CXCR4 expression.
Expression of CX3CR1 was significantly higher in M-MDSCs from patients with more than 5% bone marrow blasts (RAEB) compared to healthy donors, (median R-MFI = 10.98 vs. 5.29, p = 0.02). CX3CR1 expression was not significantly different between patients with less than 5% bone marrow blasts and healthy donors. The expression of CX3CR1 was significantly higher in M-MDSCs compared to G-MDSCs when we compared the CX3CR1 R-MFI for all three groups; M-MDSCs vs. G-MDSCs from RAEB patients (10.98 vs. 1.12, p < 0.02), patients with less than 5% bone marrow blasts (8.04 vs. 1.19, p = 0.0005), and healthy donors, (5.29 vs. 1.19, p = 0 .003). The CX3CR1 expression by G-MDSCs was not significantly different between MDS and healthy donors (Fig. 2D).
MDSCs from MDS patients inhibit Teffector cell proliferation in vitro
To evaluate suppressive effect of MDSCs, T-effectors from three healthy donors were cultured in the presence and absence of MDSCs in 1:1 ratio. M-MDSCs from patients were able to significantly suppress T effectors proliferation following 5 d culture (p = 0.03, Figs. 3A, B). To evaluate the function of MDSCs in autologous setting, T-effectors from MDS patients (2 INTR and 2 LR) were co-cultured with autologous M-MDSCs which have shown the same level of T effector suppression (p < 0.05 Fig. 3C). Presence of MDSCs, also induced Tregs proliferation (Fig. 3C). MDS-MDSCs in a 1:1 ratio culture with healthy donor T-effectors were also able to suppress pro-inflammatory cytokines secretion by T-effectors (Fig. S2). The sorted MDSCs were intracellular arginase positive (data not shown).
Figure 3.
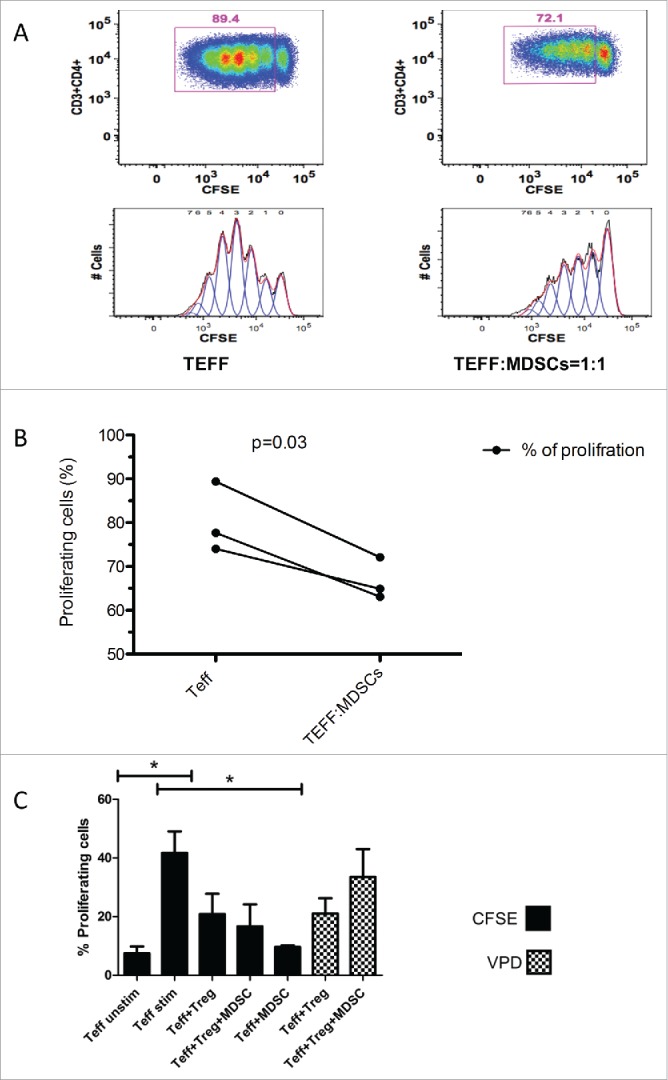
Suppression assay. (A) Healthy donor Teffector (Teff) proliferation suppresses in 1:1 co-culture with M-MDSCs from MDS patient. CFSE stained CD4+ Teff were stimulated for 5 d with anti-CD3 and anti CD28 antibodies either alone or in 1:1 co-culture with M-MDSCs. The figure is representative of one of the three suppression assays MDSCs (HLA-DR-, CD14+) were isolated from fresh patient PBMCs. (B) M-MDSCs were able to significantly reduce the proliferation of allogeneic healthy donor T-effectors when co-cultured in 1:1 ratio with M-MDSCs from MDS patients. This has been repeated three times and there was a statistically difference between two conditions (p = 0 .03). (C) M-MDSCs from patients were able to significantly reduce autologous T effectors proliferation (CFSE stained) p<0.05. Tregs (VPD stained) seemed to proliferate more in co-culture with MDSCs. (There was also a significant difference between unstimulated and stimulated T effectors, p < 0.05).
Discussion
Although the immune-dysregulation is an important feature of MDS, there are important differences between low and high risk disease in terms of immunological findings. Low risk MDS is characterized by a persistent inflammatory environment in the bone marrow and expansion of autoimmunity-associated T helper 17 (Th17) cells whereas expansion of Tregs and reduced number of Th17 are the characteristics of high risk MDS.23 However, the role of different components of the immune system and the influence of specific microenvironment on CD4+ T cell plasticity in MDS is still emerging. To investigate the potential role of MDSCs in shaping the immune response in MDS, we assessed the presence and function of circulating MDSCs in low- and high risk MDS patients. MDSCs are known to accumulate in cancer patients and tumor bearing mice, where they can inhibit adaptive anti-neoplastic immune response.24 The induction of MDSCs is believed to be secondary to tumor-dependent inhibition of myeloid maturation and interferes with normal immune competent antigen presenting cells.2 In mouse models of human cancers MDSCs mediate the development and expansion of tumor induced Tregs and Teff cell anergy.25,26 We found high numbers of MDSCs in peripheral blood of MDS patients, which is in agreement with previous reports.4 Nevertheless, the number of MDSCs was even higher in high risk MDS compared to both low risk disease and healthy donors. A more significant expansion of MDSCs in high risk disease suggests a role for these cells in immune-surveillance suppression and facilitating the disease progression. In our cohort of patients the number of circulating G-MDSCs was higher in high risk disease and the G-MDSC subset also showed higher intracellular level of IL-10 and TGF-β compared to M-MDSCs. Our data suggest that MDSCs are not only expanded in MDS but is also correlated with risk of disease progression. In those patients from which we had enough cells to enumerate both MDSCs and Tregs, there was a positive correlation between the number of MDSCs and Tregs in MDS. It may suggest a role for MDSCs in the in-vivo expansion of Tregs in MDS and subsequent disease progression. However, this correlation needs to be confirmed in a larger cohort of patients. While the accumulation and activation of MDSCs inside the myelodysplastic bone marrow is influenced by local factors, like S100A9,4 little is known of how these cells are recruited from the periphery. We therefore evaluated G-MDSC and M-MDSC bone marrow homing chemokine receptor expression. The CXCR4-CXCL12 axis has been shown to be involved in recruitment of MDSC to tumor microenvironment.13 Recent reports describe Fractalkine receptor CX3CR1 is also involved in bone marrow metastasis.22,27,28 Immature myeloid cells committed to the monocytic lineage express CX3CR1. 29 Our data shows that MDSCs from MDS patients express both CXCR4 and CX3CR1, which facilitate migration of MDSCs to the bone marrow. Although the M-MDSCs are more frequent in the peripheral blood, they express higher levels of CX3CR1 and CXCR4 and are prone to migration toward bone marrow. Additionally, in INT + HR + VHR disease CX3CR1 was higher expressed on M-MDSCs derived from peripheral blood compared to M-MDSCs derived from bone marrow, whereas there was no significant difference in VLR + LR disease.
In summary, our data show that the expansion of MDSCs in MDS correlates with increased risk of disease progression toward AML and also positively correlates with Treg numbers in high risk MDS. The MDSCs from MDS were functional and have been able to suppress T effectors function and may also induce Tregs proliferation.
The expression of homing receptors also directs these cells toward the bone marrow where they inhibit immune-surveillance against dysplastic clone(s). Inhibition of MDSCs effects (i.e. by MDSC depletion or induction of differentiation) might reverse the immunosuppressive environment and re-establish immune-surveillance in MDS.
Materials and Methods
Patients and samples
MDSCs and Treg numbers were assessed in peripheral blood and bone marrow from consecutive MDS patients seen at the out-patient clinic in the period August 2012 to September 2013 (Table 1). In total, peripheral blood from 42 pre-treatment MDS patients (median age 69.5 y) was analyzed. Twenty-three patients also had bone marrow samples available for analysis, in those cases peripheral blood and bone marrow samples were taken the same day. Twenty-seven patients had MDS without excess of bone marrow blasts; RC (N = 1 ), RARS (N = 5 ) or RCMD (N = 17 ), MDS-U (N = 4 ) and 15 had MDS with excess of blasts (RAEB-1 and RAEB-2). Thirty patients were categorized as low or very low risk disease on IPSS-R scoring system and 12 patients had intermediate or high risk disease. Peripheral blood samples from 12 healthy age matched donors, 6 females, and 6 males, median age 63.5 y (range 41–83 y) were used as controls. For three of the healthy donors, we were able to obtain bone marrow samples as well as peripheral blood. The study was approved by the local ethical committee and all samples taken after written consent.
Table 1.
Patients included in the study, with patient and disease characteristics and treatment received
| PT. | Gender | Age1 | Diagnosis2 | WHO class3 | Cytopenia(s)4 | Cytogenetics5 | Therapy6 |
|---|---|---|---|---|---|---|---|
| VERY LOW AND LOW RISK | |||||||
| 1 | M | 81 | 2012 | RCMD | A, T | 46 XY | BS, E |
| 2 | M | 78 | 2008 | RCMD | A, T | 46 XY | BS |
| 3 | M | 82 | 2011 | RARS | A | 46 XY | BS, E |
| 4 | F | 87 | 1990 | RCMD | A, T | NA | BS |
| 5 | M | 89 | 2007 | RCMD | A, T | 45 XY-11 | BS |
| 6 | F | 75 | 2006 | RARS | A | NA | BS, E |
| 7 | M | 56 | 2012 | RCMD | N, T | 47 XY +1 | BS |
| 8 | M | 76 | 2000 | RARS | A, T | 46 XY | BS |
| 9 | M | 69 | 2007 | RARS | A | 46 XY | BS, E, G |
| 10 | F | 86 | 2012 | RCMD | A | 46 XX | BS, E |
| 11 | M | 89 | 2012 | RCMD/CMML-1 | A, T | 46 XY | BS |
| 12 | M | 74 | 2012 | RC | N | 46 XY | BS |
| 13 | M | 60 | 2011 | RCMD | A | 46 XY | BS, E |
| 14 | F | 70 | 2011 | RARS | A | 46 XX | BS |
| 15 | M | 91 | 2012 | RCMD | A, N, T | 46 XY | BS |
| 16 | F | 78 | 2012 | RCMD | A, N, T | 46 XX | BS |
| 17 | M | 94 | 2012 | RCMD | A | NA | BS, E |
| 18 | M | 82 | 2012 | RAEB-1 | A | 46 XY | BS |
| 19 | M | 83 | 2010 | RAEB-1 | A | 46 XY | BS |
| 20 | F | 49 | 2013 | RCMD | T | 47 XX, +6 | BS |
| 21 | F | 66 | 2013 | MDS-U | A, T | 46 XX del(13)(q12q22) | BS |
| 22 | F | 60 | 2013 | RCMD | T | 47 XX, +21 | BS |
| 23 | M | 68 | 2013 | RCMD | T | 46 XY | BS |
| 24 | M | 25 | 2013 | MDS-U | T | 46 XY | BS |
| 25 | F | 65 | 2014 | RAEB | A, N | NA | BS |
| 26 | F | 49 | 2014 | RCMD | A | 46, XX | C, P |
| 27 | M | 49 | 2014 | MDS-U | N, T | 46, XY | BS |
| 28 | M | 43 | 2014 | MDS-U | N | 46, XX | BS |
| 29 | F | 47 | 2014 | RCMD | A | 46,XX | BS |
| 30 | F | 64 | 2014 | RCMD | A, N, T | 46, XX | BS |
| INTERMEDIATE, HIGH AND VERY HIGH RISK | |||||||
| 31 | F | 93 | 2012 | RAEB-1 | A, N, T | 46 XX del(5q) | BS |
| 32 | M | 79 | 2012 | RAEB-2 | A | 47 XY, + 11, +8, −9 | BS |
| 33 | M | 74 | 2008 | RAEB-1 | A, T | 46 XY | BS, E |
| 34 | F | 75 | 2012 | RAEB-1 | T | 46 XX | BS |
| 35 | M | 75 | 2012 | RAEB-2 | A, T | 46 XY | BS |
| 36 | M | 83 | 2013 | RAEB-1 | A, N, T | 46 XY | BS |
| 37 | M | 54 | 2012 | RAEB-2 | A, N, T | 46, XY | BS |
| 38 | M | 68 | 2013 | RAEB-1 | A | 46, XY, t(3;3)(q21;q26) | BS |
| 39 | M | 40 | 2013 | RAEB-T | A | 46, XY | BS |
| 40 | M | 71 | 2014 | RAEB-2 | A, N, T | 44,XY,-3,-5 | A |
| 41 | F | 68 | 2014 | RAEB-2 | A, N | 49,XX,+1,del | BS |
| 42 | M | 54 | 2014 | CMML-2 | T | (5q), +9, +11 46, XY | H |
Age at sampling.
Year diagnosed with MDS.
RARS = Refractory anemia with ringed sideroblasts, RCMD = refractory cytopenia with multilineage dysplasia, RAEB = Refractory anemia with excess blasts, MDS-U = MDS unclassified, CMML = Chronic myelomonocytic leukemia.
A = anemia, N = neutropenia, T = thrombocytopenia.
NA = Not acquired.
BS = best supportive care (including transfusions), E = Epo, G = G-CSF, H = Hydroxycarbamide, A = Azacitidine.C = Ciclosporin, P = Prednisolone.
Flow cytometry
Cell surface and intracellular staining was performed following red cell-lysis (Pharm-Lyse Lysing buffer, Becton Dickinson and Company BD Biosciences PharMingen, San Jose, CA, USA) using the following markers: For surface staining: Live/dead eFluor780, CD33 eFluor450, Lineage markers (all APC-eFluor780; CD3, CD16, CD19, CD20, CD34, CD56, HLA-DR), all from eBioscience (San Diego, CA, USA). CD15 Pacific Orange, (Invitrogen, Carlsbad, CA, USA), CD11b PerCP/Cy5.5 BioLegend (San Diego, CA, USA) CD66b FITC Biolegend, CD14 APC BD Biosciences, for chemokine receptor staining: CXCR3 FITC, CX3CR1 PE, CXCR4 APC, all from eBioscience. Intracellular staining was performed for IL-10 APC, TGF-β PE, Arginase 1 CFS, all from RnDSystems (Minneapolis, MN, USA), lymphocytes served as internal negative controls for each sample. The relative MFI was calculated based on the autofluorescence levels of each patient's unstained cells. After permeabilization and fixation (Flow Cytometry Permeabilization/Wash Buffer I, RnDSystems) as described in 30,31 flow cytometry was performed by FACSCantoII (Beckton Dickinson) and data were analyzed using FlowJo software, TreeStar, Inc.., Ashland, OR, USA). MDSCs were defined as Lin−/CD33+/CD11b+, subdivided into CD15+ granulocytic MDSCs (G-MDSCs) or CD14+ monocytic MDSCs, (M-MDSCs). We have used FSC-SSC characteristics to exclude any eosinophil contamination as described before (Fig. 4A).32 As cryopreservation changes the G-MDSC numbers and function,33 all MDSC analyses were carried out on fresh peripheral blood and bone marrow samples. Tregs, T helpers and T cell subset staining were performed as per previously published protocols.34 Gating strategy for MDSCs is shown in Figure 4B as described before.33
Suppression assay
T effector cells, Tregs and HLA-DR-/CD14+ MDSC were isolated from Ficoll-separated PBMC by stepwise magnetic separation (MACS columns, Miltenyi Biotec Inc., Auburn, CA, USA). Teffector cells were isolated by CD4+ negative depletion (Miltenyi Biotec Inc..) and were together with Tregs separated by CD4+CD25+ Regulatory T Cell Isolation Kit, also from Miltenyi Biotec Inc.. For MDSCs, PMBCs were first incubated with Anti-HLA-DR Micro Beads and the HLA-DR negative population was further incubated with Anti-CD14 Micro Beads, both from Miltenyi Biotec Inc.. To evaluate the suppressive function of MDSCs, CFSE stained CD3+CD4+CD25− (T-effectors) from MDS patients were stimulated by anti-human CD3 (OKT1, eBioscience) and anti-human CD28 (Functional grade purified, eBioscience) and cultured for 5 d under the following conditions: T-effectors alone, T-effectors, and Tregs (CD3+/CD4+/CD25high) in 2:1 ratio; T-effectors and Tregs and MDSCs in 2:1:1ratio. To evaluate Tregs proliferation, the CD252+ cells were stained with Violet proliferation dye (VPD). Cells were cultured in flat bottom wells in final concentration of 1 × 10⁶ cells/mL in Stem Span culture medium supplemented with GM-CSF (75 ng/mL). GM-CSF was added to support MDSCs in culture (personal communication with Professor Dmitri Gabrilovich, Section of Dendritic Cell Biology, H. Lee Moffitt Cancer Center).
Statistics
Statistical analysis was performed with GraphPad Prism. Differences between individual patients groups were analyzed by Mann–Whitney for unpaired samples and Wilcoxon for paired samples. For comparison between conditions in suppression assays Student's t-test was used. P < 0.05 was considered as statistically significant.
Disclosure of Conflicts of Interest
The authors have no conflicts of interest to declare.
Acknowledgments
The authors would like to thank Dr. Geir Hallan, Department for Orthopaedical surgery, Haukeland University Hospital, for healthy donor bone marrow sampling and to Professor Einar Kristoffersen at Gades Institute, University of Bergen, for helpful advice.
Supplemental Material
Supplemental Material may be downloaded here: publisher's website
Funding
This work was supported by The Western Norway Regional Health Authority (Helse-Vest), the Norwegian Cancer Society, Leukemia and Lymphoma Research (LLR), UK and King's College London.
References
- 1.Kordasti SY, Afzali B, Lim Z, Ingram W, Hayden J, Barber L, Matthews K, Chelliah R, Guinn B, Lombardi G et al.. IL-17-producing CD4(+) T cells, pro-inflammatory cytokines and apoptosis are increased in low risk myelodysplastic syndrome. Br J Haematol 2009; 145:64-72; PMID:19210506; http://dx.doi.org/ 10.1111/j.1365-2141.2009.07593.x [DOI] [PubMed] [Google Scholar]
- 2.Gabrilovich DI, Nagaraj S. Myeloid-derived suppressor cells as regulators of the immune system. Nat Rev Immunol 2009; 9:162-74; PMID:19197294; http://dx.doi.org/ 10.1038/nri2506 [DOI] [PMC free article] [PubMed] [Google Scholar]
- 3.Hoechst B, Gamrekelashvili J, Manns MP, Greten TF, Korangy F. Plasticity of human Th17 cells and iTregs is orchestrated by different subsets of myeloid cells. Blood 2011; 117:6532-41; PMID:21493801; http://dx.doi.org/ 10.1182/blood-2010-11-317321 [DOI] [PubMed] [Google Scholar]
- 4.Chen X, Eksioglu EA, Zhou J, Zhang L, Djeu J, Fortenbery N, Epling-Burnette P, Van Bijnen S, Dolstra H, Cannon J et al.. Induction of myelodysplasia by myeloid-derived suppressor cells. J Clin Invest 2013; 123(11):4595-611; PMID:24216507; http://dx.doi.org/ 10.1172/JCI67580 [DOI] [PMC free article] [PubMed] [Google Scholar]
- 5.Gleason MK, Ross JA, Warlick ED, Lund TC, Verneris MR, Wiernik A, Spellman S, Haagenson MD, Lenvik AJ, Litzow MR et al.. CD16xCD33 bispecific killer cell engager (BiKE) activates NK cells against primary MDS and MDSC CD33+ targets. Blood 2014; 123:3016-26; PMID:24652987; http://dx.doi.org/ 10.1182/blood-2013-10-533398 [DOI] [PMC free article] [PubMed] [Google Scholar]
- 6.Younos I, Donkor M, Hoke T, Dafferner A, Samson H, Westphal S, Talmadge J. Tumor- and organ-dependent infiltration by myeloid-derived suppressor cells. Int Immunopharmacol 2011; 11:816-26; PMID:21376153; http://dx.doi.org/ 10.1016/j.intimp.2011.02.021 [DOI] [PubMed] [Google Scholar]
- 7.Fricke I, Mirza N, Dupont J, Lockhart C, Jackson A, Lee JH, Sosman JA, Gabrilovich DI. Vascular endothelial growth factor-trap overcomes defects in dendritic cell differentiation but does not improve antigen-specific immune responses. Clin Cancer Res 2007; 13:4840-8; PMID:17699863; http://dx.doi.org/ 10.1158/1078-0432.CCR-07-0409. [DOI] [PubMed] [Google Scholar]
- 8.Ostrand-Rosenberg S. Myeloid-derived suppressor cells: more mechanisms for inhibiting antitumor immunity. Cancer Immunol Immunother 2010; 59:1593-600; PMID:20414655; http://dx.doi.org/ 10.1007/s00262-010-0855-8 [DOI] [PMC free article] [PubMed] [Google Scholar]
- 9.Hoechst B, Ormandy LA, Ballmaier M, Lehner F, Kruger C, Manns MP, Greten TF, Korangy F. A new population of myeloid-derived suppressor cells in hepatocellular carcinoma patients induces CD4(+)CD25(+)Foxp3(+) T cells. Gastroenterology 2008; 135:234-43; PMID:18485901; http://dx.doi.org/ 10.1053/j.gastro.2008.03.020 [DOI] [PubMed] [Google Scholar]
- 10.Sumida K, Wakita D, Narita Y, Masuko K, Terada S, Watanabe K, Satoh T, Kitamura H, Nishimura T. Anti-IL-6 receptor mAb eliminates myeloid-derived suppressor cells and inhibits tumor growth by enhancing T-cell responses. Eur J Immunol 2012; 42:2060-72; PMID:22653638; http://dx.doi.org/ 10.1002/eji.201142335 [DOI] [PubMed] [Google Scholar]
- 11.Kowanetz M, Wu X, Lee J, Tan M, Hagenbeek T, Qu X, Yu L, Ross J, Korsisaari N, Cao T et al.. Granulocyte-colony stimulating factor promotes lung metastasis through mobilization of Ly6G+Ly6C+ granulocytes. Proc Natl Acad Sci U S A 2010; 107:21248-55; PMID:21081700; http://dx.doi.org/ 10.1073/pnas.1015855107 [DOI] [PMC free article] [PubMed] [Google Scholar]
- 12.Pekarek LA, Starr BA, Toledano AY, Schreiber H. Inhibition of tumor growth by elimination of granulocytes. J Exp Med 1995; 181:435-40; PMID:7807024; http://dx.doi.org/ 10.1084/jem.181.1.435 [DOI] [PMC free article] [PubMed] [Google Scholar]
- 13.Obermajer N, Muthuswamy R, Odunsi K, Edwards RP, Kalinski P. PGE(2)-induced CXCL12 production and CXCR4 expression controls the accumulation of human MDSCs in ovarian cancer environment. Cancer Res 2011; 71:7463-70; PMID:22025564; http://dx.doi.org/ 10.1158/0008-5472.CAN-11-2449 [DOI] [PMC free article] [PubMed] [Google Scholar]
- 14.Steinberg M, Silva M. Plerixafor: A chemokine receptor-4 antagonist for mobilization of hematopoietic stem cells for transplantation after high-dose chemotherapy for non-Hodgkin's lymphoma or multiple myeloma. Clin Ther 2010; 32:821-43; PMID:20685493; http://dx.doi.org/ 10.1016/j.clinthera.2010.05.007 [DOI] [PubMed] [Google Scholar]
- 15.Aggarwal S, van de Loosdrecht AA, Alhan C, Ossenkoppele GJ, Westers TM, Bontkes HJ. Role of immune responses in the pathogenesis of low-risk MDS and high-risk MDS: implications for immunotherapy. Br J Haematol 2011; 153:568-81; PMID:21488861; http://dx.doi.org/ 10.1111/j.1365-2141.2011.08683.x [DOI] [PubMed] [Google Scholar]
- 16.Matsuda M, Morita Y, Hanamoto H, Tatsumi Y, Maeda Y, Kanamaru A. CD34+ progenitors from MDS patients are unresponsive to SDF-1, despite high levels of SDF-1 in bone marrow plasma. Leukemia 2004; 18:1038-40; PMID:14762446; 10.1038/sj.leu.2403301 [DOI] [PubMed] [Google Scholar]
- 17.Sukkar MB, Issa R, Xie S, Oltmanns U, Newton R, Chung KF. Fractalkine/CX3CL1 production by human airway smooth muscle cells: induction by IFN-gamma and TNF-α and regulation by TGF-β and corticosteroids. Am J Physiol Lung Cell Mol Physiol 2004; 287:L1230-40; PMID:15321787; http://dx.doi.org/ 10.1152/ajplung.00014.2004 [DOI] [PubMed] [Google Scholar]
- 18.Navas T, Zhou L, Estes M, Haghnazari E, Nguyen AN, Mo Y, Pahanish P, Mohindru M, Cao T, Higgins LS et al.. Inhibition of p38alpha MAPK disrupts the pathological loop of proinflammatory factor production in the myelodysplastic syndrome bone marrow microenvironment. Leuk Lymphoma 2008; 49:1963-75; PMID:18949619; http://dx.doi.org/ 10.1080/10428190802322919 [DOI] [PMC free article] [PubMed] [Google Scholar]
- 19.Zhou L, Nguyen AN, Sohal D, Ying Ma J, Pahanish P, Gundabolu K, Hayman J, Chubak A, Mo Y, Bhagat TD et al.. Inhibition of the TGF-β receptor I kinase promotes hematopoiesis in MDS. Blood 2008; 112:3434-43; PMID:18474728; http://dx.doi.org/ 10.1182/blood-2008-02-139824 [DOI] [PMC free article] [PubMed] [Google Scholar]
- 20.Cohen PA, Ko JS, Storkus WJ, Spencer CD, Bradley JM, Gorman JE, McCurry DB, Zorro-Manrique S, Dominguez AL, Pathangey LB et al.. Myeloid-derived suppressor cells adhere to physiologic STAT3- vs STAT5-dependent hematopoietic programming, establishing diverse tumor-mediated mechanisms of immunologic escape. Immunol Invest 2012; 41:680-710; PMID:23017141; http://dx.doi.org/ 10.3109/08820139.2012.703745 [DOI] [PMC free article] [PubMed] [Google Scholar]
- 21.Aiuti A, Webb IJ, Bleul C, Springer T, Gutierrez-Ramos JC. The chemokine SDF-1 is a chemoattractant for human CD34+ hematopoietic progenitor cells and provides a new mechanism to explain the mobilization of CD34+ progenitors to peripheral blood. J Exp Med 1997; 185:111-20; PMID:8996247; http://dx.doi.org/ 10.1084/jem.185.1.111 [DOI] [PMC free article] [PubMed] [Google Scholar]
- 22.Jamieson-Gladney WL, Zhang Y, Fong AM, Meucci O, Fatatis A. The chemokine receptor CX(3)CR1 is directly involved in the arrest of breast cancer cells to the skeleton. Breast Cancer Res 2011; 13:R91; PMID:21933397; 10.1186/bcr3016 [DOI] [PMC free article] [PubMed] [Google Scholar]
- 23.Kordasti SY, Afzali B, Lim Z, Ingram W, Hayden J, Barber L, Matthews K, Chelliah R, Guinn B, Lombardi G et al.. IL-17-producing CD4(+) T cells, pro-inflammatory cytokines and apoptosis are increased in low risk myelodysplastic syndrome. Br J Haematol 2009; 145:64-72; PMID:19210506; http://dx.doi.org/ 10.1111/j.1365-2141.2009.07593.x [DOI] [PubMed] [Google Scholar]
- 24.Kusmartsev S, Gabrilovich DI. Role of immature myeloid cells in mechanisms of immune evasion in cancer. Cancer Immunol Immunother 2006; 55:237-45; PMID:16047143; http://dx.doi.org/ 10.1007/s00262-005-0048-z [DOI] [PMC free article] [PubMed] [Google Scholar]
- 25.Huang B, Pan PY, Li Q, Sato AI, Levy DE, Bromberg J, Divino CM, Chen SH. Gr-1+CD115+ immature myeloid suppressor cells mediate the development of tumor-induced T regulatory cells and T-cell anergy in tumor-bearing host. Cancer Res 2006; 66:1123-31; PMID:16424049; http://dx.doi.org/ 10.1158/0008-5472.CAN-05-1299 [DOI] [PubMed] [Google Scholar]
- 26.Serafini P, Mgebroff S, Noonan K, Borrello I. Myeloid-derived suppressor cells promote cross-tolerance in B-cell lymphoma by expanding regulatory T cells. Cancer Res 2008; 68:5439-49; PMID:18593947; http://dx.doi.org/ 10.1158/0008-5472.CAN-07-6621 [DOI] [PMC free article] [PubMed] [Google Scholar]
- 27.Jamieson WL, Shimizu S, D'Ambrosio JA, Meucci O, Fatatis A. CX3CR1 is expressed by prostate epithelial cells and androgens regulate the levels of CX3CL1/fractalkine in the bone marrow: potential role in prostate cancer bone tropism. Cancer Res 2008; 68:1715-22; PMID:18339851; http://dx.doi.org/ 10.1158/0008-5472.CAN-07-1315 [DOI] [PMC free article] [PubMed] [Google Scholar]
- 28.Shulby SA, Dolloff NG, Stearns ME, Meucci O, Fatatis A. CX3CR1-fractalkine expression regulates cellular mechanisms involved in adhesion, migration, and survival of human prostate cancer cells. Cancer Res 2004; 64:4693-8; PMID:15256432; http://dx.doi.org/ 10.1158/0008-5472.CAN-03-3437 [DOI] [PubMed] [Google Scholar]
- 29.Fogg DK, Sibon C, Miled C, Jung S, Aucouturier P, Littman DR, Cumano A, Geissmann F. A clonogenic bone marrow progenitor specific for macrophages and dendritic cells. Science 2006; 311:83-7; PMID:16322423; http://dx.doi.org/ 10.1126/science.1117729 [DOI] [PubMed] [Google Scholar]
- 30.Garba ML, Frelinger JA. Intracellular cytokine staining for TGF-β. J Immunol Methods 2001; 258:193-8; PMID:11684136; http://dx.doi.org/ 10.1016/S0022-1759(01)00491-4 [DOI] [PubMed] [Google Scholar]
- 31.Kreft B, Singer GG, Diaz-Gallo C, Kelley VR. Detection of intracellular interleukin-10 by flow cytometry. J Immunol Methods 1992; 156:125-8; PMID:1431159; http://dx.doi.org/ 10.1016/0022-1759(92)90018-O [DOI] [PubMed] [Google Scholar]
- 32.Sabroe I, Jones EC, Usher LR, Whyte MK, Dower SK. Toll-like receptor (TLR)2 and TLR4 in human peripheral blood granulocytes: a critical role for monocytes in leukocyte lipopolysaccharide responses. J Immunol 2002; 168:4701-10; PMID:11971020; http://dx.doi.org/ 10.4049/jimmunol.168.9.4701 [DOI] [PubMed] [Google Scholar]
- 33.Kotsakis A, Harasymczuk M, Schilling B, Georgoulias V, Argiris A, Whiteside TL. Myeloid-derived suppressor cell measurements in fresh and cryopreserved blood samples. J Immunol Methods 2012; 381:14-22; PMID:22522114; http://dx.doi.org/ 10.1016/j.jim.2012.04.004 [DOI] [PMC free article] [PubMed] [Google Scholar]
- 34.Kordasti S, Marsh J, Al-Khan S, Jiang J, Smith A, Mohamedali A, Abellan PP, Veen C, Costantini B, Kulasekararaj AG et al.. Functional characterization of CD4+ T cells in aplastic anemia. Blood 2012; 119:2033-43; PMID:22138514; http://dx.doi.org/ 10.1182/blood-2011-08-368308 [DOI] [PubMed] [Google Scholar]
Associated Data
This section collects any data citations, data availability statements, or supplementary materials included in this article.