

Abstract
Human subgenual anterior cingulate cortex (sACC) is involved in affective experiences and fear processing. Functional neuroimaging studies view it as a homogeneous cortical entity. However, sACC comprises several distinct cyto- and receptorarchitectonical areas: 25, s24, s32, and the ventral portion of area 33. Thus, we hypothesized that the areas may also be connectionally and functionally distinct. We performed structural post mortem and functional in vivo analyses. We computed probabilistic maps of each area based on cytoarchitectonical analysis of ten post mortem brains. Maps, publicly available via the JuBrain atlas and the Anatomy Toolbox, were used to define seed regions of task-dependent functional connectivity profiles and quantitative functional decoding. sACC areas presented distinct co-activation patterns within widespread networks encompassing cortical and subcortical regions. They shared common functional domains related to emotion, perception and cognition. A more specific analysis of these domains revealed an association of s24 with sadness, and of s32 with fear processing. Both areas were activated during taste evaluation, and co-activated with the amygdala, a key node of the affective network. s32 co-activated with areas of the executive control network, and was associated with tasks probing cognition in which stimuli did not have an emotional component. Area 33 was activated by painful stimuli, and co-activated with areas of the sensorimotor network. These results support the concept of a connectional and functional specificity of the cyto- and receptorarchitectonically defined areas within the sACC, which can no longer be seen as a structurally and functionally homogeneous brain region.
Keywords: Cytoarchitecture, Receptors, Probability maps, Anterior cingulate cortex, Functional meta-analysis, Functional decoding, Gender differences
Introduction
The anterior cingulate cortex (ACC), a cytoarchitectonically heterogeneous region surrounding the genu of the corpus callosum, can be divided into subgenual (sACC) and pregenual (pACC) subregions (Palomero-Gallagher et al., 2008). While in functional imaging studies most investigators considered sACC to be synonymous with Brodmann’s area 25, cyto- and receptorarchitectonical studies demonstrated that sACC also comprises areas s24 and s32, as well as the most ventral portion of area 33 (Palomero-Gallagher et al., 2008). Agranular area 25 has a relatively primitive laminar cytoarchitecture, with broad and poorly differentiated layers II–III and large and densely packed layer V neurons that intermingle with the multipolar cells of layer VI. Area s24 is also agranular, with a thin layer II, larger pyramids in layers IIIa/b than those found in IIIc, a prominent cell-dense layer Va and a neuron-sparse layer Vb. Area s32 is dysgranular, its layers Va and VI appear as a pair of distinct thin layers separated by a cell sparse layer Vb. Layer II of s32 is particularly conspicuous because it shows a subdivision into a superficial, densely packed layer IIa, and a layer IIb, with less densely packed, lancet shaped pyramids (Palomero-Gallagher et al., 2008).
In healthy human volunteers, activations within sACC occur in functional neuroimaging experiments with transient sadness induced either by recalling negative autobiographical experiences, or by sensory-affective stimulation such as “sad pictures” or mournful music (George et al., 1995; Kross et al., 2009; Smith et al., 2011). Furthermore, sACC activations were larger when participants specifically facilitated ruminative behavior during recall of negative autobiographical memories as opposed to a condition where persistence of rumination was actively inhibited (Kross et al., 2009). In turn, activation of sACC was not seen during the recall of happy memories (George et al., 1995). Information concerning the function of a specific area within sACC is only available for area 25, which has been implicated in the regulation of autonomic and endocrine functions via connections with the periaqueductal gray (An et al., 1998; Chiba et al., 2001; Freedman et al., 2000; Neafsey et al., 1993; Takagishi and Chiba, 1991).
Meta-analyses have confirmed the involvement of sACC in the processing of affective experiences associated with sadness (Phan et al., 2002; Vogt, 2005), as well as during the down-regulation of negative affective responses resulting in fear extinction (Diekhof et al., 2011). They have also revealed that sACC is activated during affective pain processing, in particular when related to noxious cutaneous stimuli (Duerden and Albanese, 2013; Vogt, 2005). Additionally, sACC is part of a network enabling the integration of cognitive control and affective processes (Cromheeke and Mueller, 2014). That is, sACC is activated when a cognitive control task is carried out in an emotion-generating context, or the emotional stimuli are relevant to the cognitive task being carried out (Cromheeke and Mueller, 2014). However, these studies did not take the parcellation of sACC into architectonically distinct areas into consideration when describing the location of activation foci. Thus, sACC conceptually remained a homogeneous brain region despite a conspicuous functional diversity and the fact that the centers of activity were frequently seen at different positions. This concept of a homogeneous region challenges the widely accepted hypothesis of structural–functional relationships at the level of cortical areas.
Therefore, a multimodal analysis taking into consideration both cellular and receptor compositions as well as the connectivity and functions is necessary to reconsider the concept of a homogeneous sACC in functional neuroimaging studies. Here we will provide a detailed comparison of previously cyto- and receptorarchitectonically characterized areas 33, 25, s24, and s32 (Palomero-Gallagher et al., 2008) with the highly variable sulcal and gyral patterns in the region of the sACC. We will generate three-dimensional (3D)-probabilistic maps of these areas in standard stereotaxic reference space, which enable quantification of their intersubject variability in position and extent. These maps will also serve as volumes of interest for an analysis of co-activation patterns and functional properties of each of the cytoarchitectonically defined areas. The results demonstrate that sACC is a brain region which consists of four distinct areas with a matching structural and functional segregation.
Material and methods
Continuous probabilistic maps and maximum probability maps
We examined the cytoarchitectonic properties of sACC in ten post mortem human brains obtained through the body donor program of the Department of Anatomy, University of Düsseldorf (Table 1). Brains were fixed for 5 months in Bodian’s fixative or in 4% formaldehyde, and scanned with a T1-weighted magnetic resonance sequence (“MR-volume”; flip angle = 40°; repetition time TR = 40 ms; echo time TE = 5 ms for each image; 128 sagittal sections; spatial resolution 1 × 1 × 1.17 mm; 8 bit gray value resolution) before histological processing. Brains were then embedded in paraffin and serially sectioned into 6 to 7 thousand whole-brain sections (20 μm thick) in the coronal (6 cases) or horizontal (4 cases) plane with a large-scale microtome. Each 15th section (distance between sections: 300 μm) was mounted on gelatine-coated slides, stained for cell bodies with a modified silver cell-body staining (Merker, 1983; Palomero-Gallagher et al., 2008), and digitized in a flatbed scanner (Epson Perfection V750 Pro; 1200 dpi, 20 μm per pixel).
Table 1.
Brains used for cytoarchitectonic analysis of the anterior cingulate cortex areas. Case numbering is according to designations of the brain bank from which the brains were collected.
| Brain ID | Gender | Age | Fresh weight (g) | Cause of death | Plane of sectioning |
|---|---|---|---|---|---|
| 1 | Female | 79 | 1350 | Carcinoma of the bladder | Coronal |
| 5 | Female | 59 | 1142 | Cardiorespiratory insufficiency | Coronal |
| 6 | Female | 54 | 1757 | Myocardial infarction | Coronal |
| 7 | Male | 37 | 1437 | Cardiac arrest | Coronal |
| 10 | Female | 85 | 1046 | Mesenteric artery infarction | Coronal |
| 11 | Male | 74 | 1381 | Myocardial infarction | Coronal |
| 15 | Male | 54 | 1248 | Bullet wound | Horizontal |
| 16 | Male | 63 | 1393 | Accident, internal bleeding | Horizontal |
| 17 | Female | 50 | 1328 | Myocardial infarction | Horizontal |
| 18 | Male | 75 | 1310 | Cardiac arrest | Horizontal |
Areas 25, s24, s32 and 33 had been previously identified by cytoarchitectonical analysis and the borders were defined based on an observer-independent mapping approach (Palomero-Gallagher et al., 2008; Schleicher et al., 2005; Zilles et al., 2002). The extent of the different sACC areas was interactively traced in the high-resolution images of the histological sections using in-house software. These traces were used to calculate volumes of the individual sACC areas using Cavalieri’s principle, and for 3D-reconstruction of the mapped areas (Amunts et al., 2005).
The histological volume of each of the examined brains was 3D-reconstructed by linear and non-linear registration to the MR volume of each individual brain (Hömke, 2006). Thus, deformations and shrinkage inevitably caused by the histological techniques could be corrected. For the 3D-reconstruction of histological volumes, we separated the hemispheres by means of labeled masks, and were thus able to iteratively correct images of the left and right hemispheres using a section-by-section elastic alignment of adjacent sections at high-resolution (Mohlberg et al., 2012). The ensuing histological volumes were spatially normalized to the corresponding hemispheres of the single-subject T1-weighted MNI reference brain (Collins et al., 1994; Evans et al., 2012) in anatomical MNI space (Amunts et al., 2005) using an affine and nonlinear elastic registration approach (Henn et al., 1997; Hömke, 2006). This procedure enabled superimposition of all cytoarchitectonical areas delineated in the ten individual post mortem brains in the common stereotaxic reference template. We then computed continuous probabilistic maps of the different sACC areas in anatomical MNI space. Thus, for each voxel in the reference brain, the probability that an architectonical entity could be found at a certain position in stereotaxic space was characterized by values ranging between 0% and 100%.
Finally, maximum probability maps (MPM) were calculated by assigning each voxel in the reference brain to the cytoarchitectonic area with the highest probability in that voxel (Eickhoff et al., 2005, 2006b). When two areas shared the same probability in a particular voxel, this voxel was assigned to the area with the higher average probabilities in directly adjacent voxels. A threshold of 40% was applied to those voxels where the delineated sACC area abutted cortical regions which have not yet been mapped using the observer independent parcellation of the present analysis (i.e., BA12 at the ventral border of area s32).
Thus, these maps quantitatively express the intersubject variability of a cortical area in stereotaxic space. They can be downloaded at www.fz-juelich.de/inm/inm-1/spm_anatomy_toolbox for the analysis of functional or structural magnetic resonance imaging data by means of the Anatomy Toolbox (Eickhoff et al., 2005), or viewed as surface representations through the JuBrain atlas (http://www.jubrain.fz-juelich.de/apps/cytoviewer/cytoviewer-main.php).
Statistical analysis of histological volumes
The volumes of the individual ACC areas were analyzed with respect to interhemispheric and gender differences using Monte-Carlo permutation tests. Prior to this analysis, all areal volumes were expressed as a fraction of total brain volume for each brain in order to adjust for differences in total brain size, i.e. we searched for true gender differences (Luders et al., 2014; Perlaki et al., 2014).
For the analysis of gender differences, we first computed the difference in the mean volumes between the 5 male and 5 female histologically processed brains. Under the null-hypothesis of gender exchangeability, we then randomly reassigned each brain to one of the two groups (male/female), and re-computed the respective difference between the mean volumes of the ensuing randomly assembled groups. This difference obtained under the null-hypothesis (that brain assignment to a gender group is irrelevant) was recorded, and the procedure repeated 106 times. The true gender difference was considered significant if it was larger than 95% of the values under the empirical null-distribution (p < 0.05; Bonferroni corrected for multiple comparisons).
In contrast to this between-subject design to assess gender differences, the analysis of interhemispheric differences used a within-subject design. In particular, we first computed the differences between left and right areal volumes in each brain. The mean of these values represents the average interhemispheric difference in the ensuing paired-test design. Under the null-hypothesis that there is no difference between the hemispheres and that side-labels may hence be freely exchangeable, we then randomly and independently across subjects designated the two measurements as “left” or “right”. Again, the mean differences between “left” and “right” areal volumes across subjects were calculated, which provided a difference value for each area under the null-hypothesis that the left and right values were not systematically different. This procedure was repeated 106 times and interhemispheric differences were considered significant if they were larger than 95% of the values under the empirical null-distribution (p < 0.05; Bonferroni corrected for multiple comparisons).
Connectivity and function of the sACC areas
Task-based functional connectivity of the defined cytoarchitectonic areas was investigated using meta-analytic connectivity modeling (MACM; Eickhoff et al., 2010; Jakobs et al., 2012), while functional associations were investigated using quantitative functional decoding (Cieslik et al., 2013; Rottschy et al., 2013). As a first, common, step to both analyses, the MPM representations of cytoarchitectonically defined areas 25, s24 and s32 were used to define volumes of interest with which to perform a location query within the BrainMap database (www.brainmap.org; Fox and Lancaster, 2002). We only considered experiments reporting stereotaxic coordinates from normal mapping studies in healthy subjects using either fMRI or PET. Thus, no studies reporting pharmacological interventions or group comparisons (e.g. male vs. female or left-handed vs. right-handed participants) were included. All eligible BrainMap experiments were considered because a pre-selection of taxonomic categories would constitute a fairly strong a priori hypothesis about how brain networks are organized Inclusion criteria yielded (at the time of analysis) approximately 12,000 functional neuroimaging experiments on which all further analyses were based.
The key idea behind MACM is to first identify all experiments in a database that activate a particular brain region (seed VOI), and then test for convergence across (all) activation foci reported in these experiments (cf. Eickhoff and Grefkes, 2011; Laird et al., 2013). Obviously, as experiments were selected by activation in the seed, highest convergence will be observed in the seed region. This local cluster encroaches slightly onto directly adjacent areas and, at times, can extend over them and merge with a cluster situated in the vicinity.
Significant convergence of the reported foci in other brain regions, however, indicates consistent co-activation over experiments with the seed region. Practically, convergence of co-activations was assessed using the Activation Likelihood Estimation (ALE) approach. First, all foci from the experiments reporting at least one activation within our volumes of interest were treated as 3D Gaussian probability distributions capturing the spatial uncertainty resulting from the between-subject and between-template variability of neuroimaging data (Eickhoff et al., 2009; Turkeltaub et al., 2012). Modeling with the ALE algorithm reveals statistical convergence of reported activations across different experiments and the results were interpreted under the assumption that the observed clusters have a higher probability than given only random convergence. To identify random and non-random foci clusters, the obtained ALE values were compared with a null-distribution reflecting a random spatial association between the considered experiments (Eickhoff et al., 2012). Results were thresholded at voxel-level family wise error corrected p < 0.05. Pairwise conjunctions over all areas were also computed to determine possible similarities in the co-activation patterns of sACC areas.
To assess differential co-activation between areas, voxel-wise differences of the ALE scores from the individual MACM analyses were computed. The resulting difference maps were tested for significance using a permutation test. The experiments contributing to either analysis were pooled and randomly divided into two groups of the same size as the contrasted experiments (Eickhoff and Grefkes, 2011). Resulting voxel-wise ALE scores for these random groups were subtracted and recorded to obtain an empirical null distribution of ALE score differences between the two co-activation maps (10,000 permutations). Based on this distribution obtained under the null hypothesis of label exchangeability, the map of true ALE differences was thresholded at a posterior probability of p < 0.95 for a true difference between the two samples. The resulting difference maps were masked with the main effect of the respective cytoarchitectonic sACC area.
We furthermore functionally characterized the histologically defined regions based on the “behavioral domain” and “paradigm class” meta-data from the retrieved experiments. That is, this analysis was also based on filtering the BrainMap database for experiments activating the respective histological area, but in contrast to the MACM analysis, we now did not examine the co-activation profile, but rather probed the functional descriptions of the experiments that activate a particular region. Behavioral domains include the main categories cognition, action, perception, emotion, and interoception, as well as their related sub-categories. Paradigm classes categorize the specific task employed (see http://brainmap.org/scribe for more information on the BrainMap taxonomy). Individual functional profiles were characterized using forward and reverse inference (cf. Cieslik et al., 2013; Clos et al., 2013; Kellermann et al., 2013). Forward inference is the probability of observing activity in a brain region given knowledge of the psychological process, whereas reverse inference is the probability of a psychological process being present given knowledge of activation in a particular brain region. In the forward inference approach, the functional profile was determined by identifying taxonomic labels for which the probability of finding activation in the respective region/set of regions was significantly higher than the overall chance across the entire database of finding activation in that particular region/set of regions. Significance was established using a binomial test (p < 0.05, corrected for multiple comparisons using false discovery rate). That is, we tested whether the conditional probability of activation given a particular label [P(Activation|Task)] was higher than the baseline probability of activating the region(s) in question per se [P(Activation)]. In the reverse inference approach, the functional profile was determined by identifying the most likely behavioral domains and paradigm classes given activation in a particular region/set of regions. This likelihood P(Task|Activation) can be derived from P(Activation|Task) as well as P(Task) and P(Activation) using Bayes rule. Significance (at p < 0.05, corrected for multiple comparisons using FDR) was then assessed by means of a chi-squared test. Finally, we also carried out a functional characterization of the co-activation map of each area.
Results
Cyto- and receptorarchitectonically defined borders and their relationship to macroscopical landmarks
Area 25 was located mainly on the subcallosal gyrus, and its rostral border was often found in the anterior parolfactory sulcus, which was present in 16 out of 20 hemispheres (Fig. 1). However, area 25 extended rostral to the anterior parolfactory sulcus in both hemispheres of case 5 and in the right hemisphere of cases 15 and 18. It encroached hereby onto the cingulate gyrus in case 5 and the superior rostral gyrus in cases 15 and 18. Area 25 never reached the orbitofrontal surface of the brain.
Fig. 1.
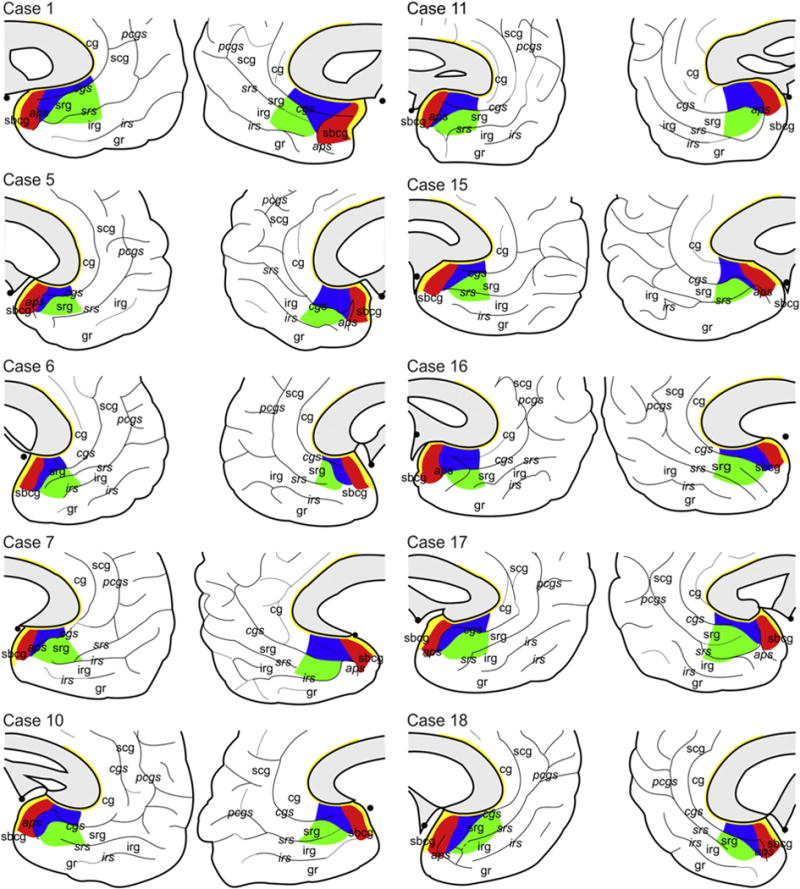
Schematic drawings depicting the extent of areas 25 (in red), s24 (in blue), s32 (in green) and 33 (in yellow) in the 10 post mortem cases examined in the present study and their relationship to macroanatomical landmarks. Dotted lines indicate dimples, i.e., extremely shallow sulci. Sulci are labeled in italics, gyri in regular font. aps: anterior parolfactory sulcus; cg: cingulate gyrus; cgs: cingulate sulcus; irg: inferior rostral gyrus; irs: inferior rostral sulcus; pcgs: paracingulate sulcus; scg: superior cingulate gyrus; sbcg: subcallosal gyrus; srg: superior rostral gyrus; srs: superior rostral sulcus.
Area s24 was restricted in its most rostral portion to the cingulate gyrus, where its dorsal and ventral borders were located within the callosal and cingulate sulci, respectively. Caudally, however, s24 also extended ventrally onto the superior rostral gyrus, and in six hemispheres (right hemisphere of cases 5, 6 and 10, left hemisphere of cases 10, 15, and 18) even encroached onto the inferior rostral gyrus. Area s24 was delimited dorsally by area 33 and caudally by area 25. Ventrally area s24 was delimited by orbitofrontal area 11 and sACC area s32 at its caudal and rostral portions, respectively.
Area s32 was located mainly on the superior rostral gyrus only at its rostral portion. Its border with s24 was located close to the fundus of the cingulate sulcus. However, the caudal portion of s32 extended ventrally onto the inferior rostral gyrus. Area s32 was delimited ventrally by orbito-frontal areas 11 (caudally) and 12 (rostrally), dorsocaudally by area s24, and did not have a common border with area 25.
Area 33 was found as a narrow strip of cortex buried in the callosal sulcus. It commenced on the paraterminal gyrus, caudally abutting area 25, formed an arc around the genu of the corpus callosum, and ended approximately over the middle of the callosal body.
Probabilistic maps and variability
Areas 25, s24, s32 and 33 (Fig. 2) were registered to the MNI reference brain in order to compute continuous probability maps and quantify intersubject variability of their size and location. In general, a high intersubject variability was found. s24 was the least variable area, since it presented the largest number of voxels with the highest overlap of all ten brains. Conversely, area 33 was the area with the highest intersubject variability.
Fig. 2.
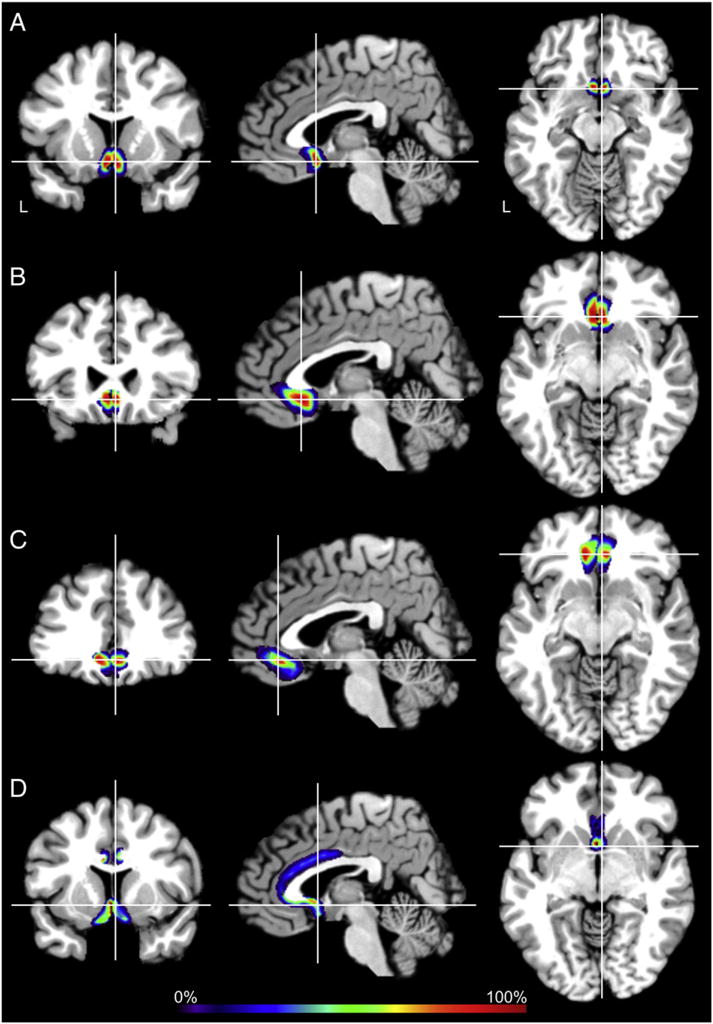
Sections through the MNI single subject template showing the continuous probability maps of areas 25 (A), s24 (B), s32 (C), and 33 (D) in the coronal, horizontal, and sagittal planes of sectioning. The number of overlapping brains is color coded according to the scale bar. Scale bar encodes overlap probability from low brains (10%) up to high probabilities in dark red (ten out of ten brains, 100%). Crosshairs highlight coordinates in anatomical MNI space (area 25 x = 2, y = 16, z = −19; area s24 x = 2, y = 27, z = −15; area s32 x = 2, y = 39, z = −16; area 33 x = 2, y = 8, z = −7). L: left hemisphere. Continuous probability maps can be viewed as surface representations through the JuBrain atlas (http://www.jubrain.fz-juelich.de/apps/cytoviewer/cytoviewer-main.php).
Since the continuous probability maps of different adjoining areas overlap, MPMs were computed. They present a contiguous, non-overlapping parcellation of the subgenual anterior cingulate cortex which reflects, for each voxel, the most likely area at that position in a sample of ten human post mortem brains (Fig. 3).
Fig. 3.
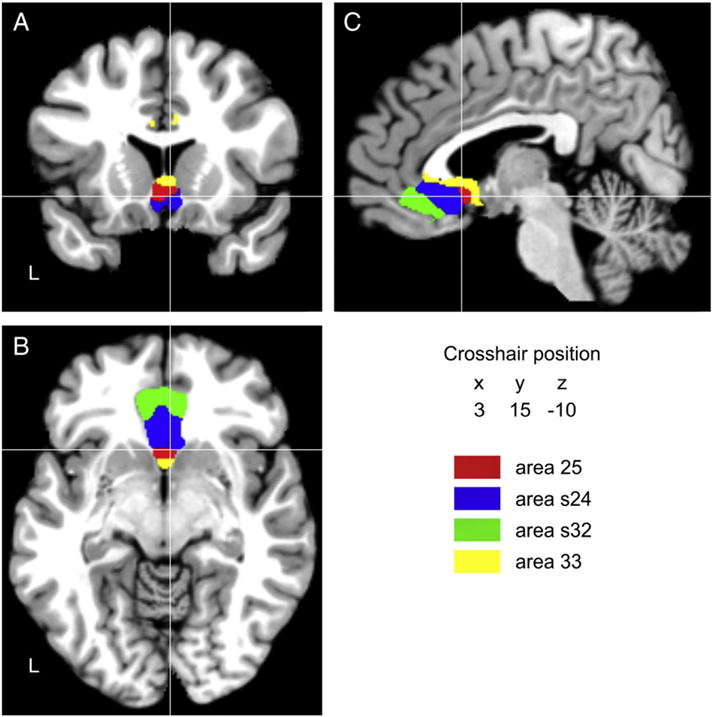
Sections through the MNI single subject template showing the maximum probability maps of areas 25, s24, s32 and 33 in the coronal (A), horizontal (B), and sagittal (C) planes of sectioning. The current version of the maximum probability maps, which can be used for the analysis of functional or structural magnetic resonance imaging data by means of the Anatomy Toolbox (Eickhoff et al., 2005), can be downloaded at www.fz-juelich.de/inm/inm-1/spm_anatomy_toolbox.
Volumetric analysis
Area s24 was the largest and 25 the smallest of the sACC areas (Table 2). Their volumes can vary by 1.7 (25), 1.7 (33), 2.9 (s32), and 3.3 times (s24) for both hemispheres together. Statistical analysis of the histological volumes corrected for individual brain sizes revealed gender differences for areas s24 and s32, which were larger in male than in female brains. However, there were no interhemispheric differences or interactions between gender and hemisphere in any of the examined areas.
Table 2.
Volumes of sACC areas measured in the reconstructed histological brain volumes prior to spatial normalization. Data is presented as mean values (± s.d.) of the original volumes (regular font, mm3) and of the volumes corrected for individual brain sizes (± s.d.; italics, ‰), as well as for the minimal (min) and maximal (max) original volumes.
| 25 | s24 | s32 | 33 | ||
|---|---|---|---|---|---|
| Total | 249 ± 39 | 727 ± 264 | 621 ± 203 | 479 ± 72 | |
| 0.20 ± 0.04 | 0.55 ± 0.18 | 0.47 ± 0.13 | 0.38 ± 0.07 | ||
| Min | 188 | 340 | 336 | 374 | |
| Max | 325 | 1126 | 975 | 620 | |
| Male left | 258 ± 38 | 843 ± 74 | 751 ± 97 | 508 ± 105 | |
| 0.19 ± 0.04 | 0.61 ± 0.09 | 0.54 ± 0.08 | 0.37 ± 0.11 | ||
| Min | 212 | 757 | 622 | 408 | |
| Max | 303 | 924 | 862 | 620 | |
| Male right | 218 ± 28 | 1074 ± 52 | 830 ± 145 | 505 ± 80 | |
| 0.16 ± 0.04 | 0.78 ± 0.12 | 0.60 ± 0.15 | 0.37 ± 0.09 | ||
| Min | 188 | 1006 | 674 | 418 | |
| Max | 262 | 1126 | 975 | 590 | |
| Female left | 278 ± 36 | 531 ± 108 | 406 ± 59 | 442 ± 41 | |
| 0.23 ± 0.03 | 0.44 ± 0.08 | 0.34 ± 0.02 | 0.37 ± 0.05 | ||
| Min | 227 | 378 | 336 | 374 | |
| Max | 325 | 610 | 491 | 480 | |
| Female right | 242 ± 35 | 458 ± 68 | 498 ± 94 | 459 ± 38 | |
| 0.20 ± 0.03 | 0.38 ± 0.04 | 0.42 ± 0.06 | 0.39 ± 0.05 | ||
| Min | 202 | 340 | 411 | 421 | |
| Max | 283 | 506 | 651 | 522 |
Task-dependent functional connectivity
We quantitatively mapped task-based co-activations of areas 25, s24, s32 and 33 co-activations using the BrainMap database. We found 36 experiments in the BrainMap database which described activation foci in area 25. A total of 153, 202, and 144 experiments in the BrainMap database reported activations within areas s24, s32 and 33, respectively. Using meta-analytic connectivity modeling (MACM), we found distinct patterns of co-activation clusters for each of the sACC areas.
Area 25 (Fig. 4, Table 3) was associated with four co-activation clusters spread throughout the brain. Maxima within these clusters were located in areas of the inferior left parietal lobe (area 1), the right inferior occipital gyrus (area hOc2 or BA18; Table 3) and the right superior cingulate gyrus rostral to the genu of the corpus callosum (pACC; Table 3). The pACC region encompasses areas p24 and p32. Additionally, we found a co-activation cluster in the cerebellum (lobule IX).
Fig. 4.
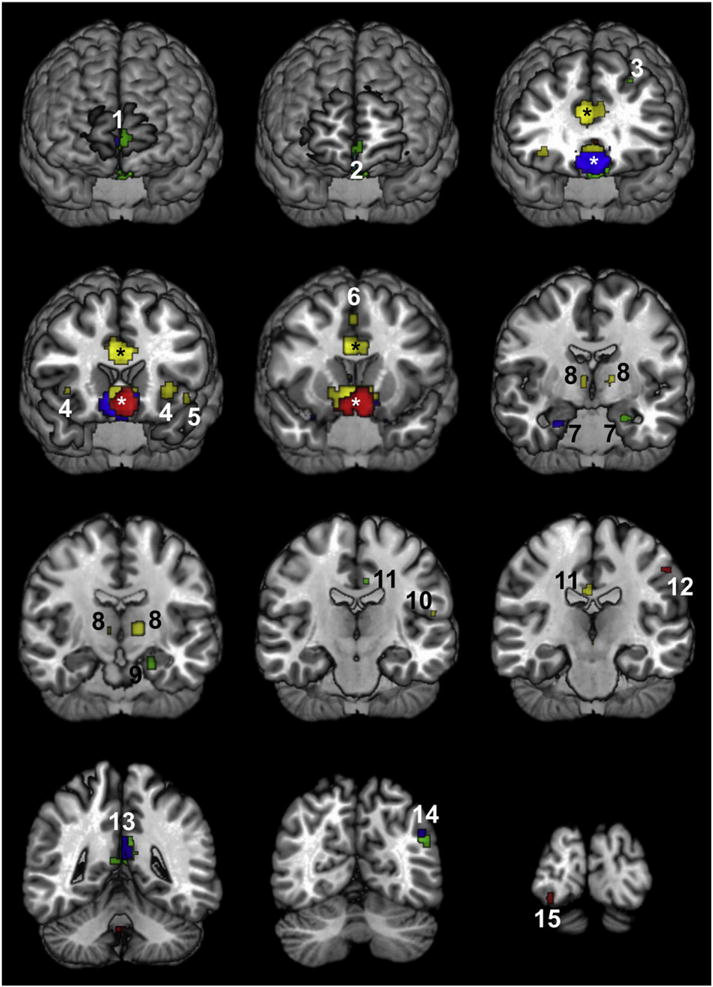
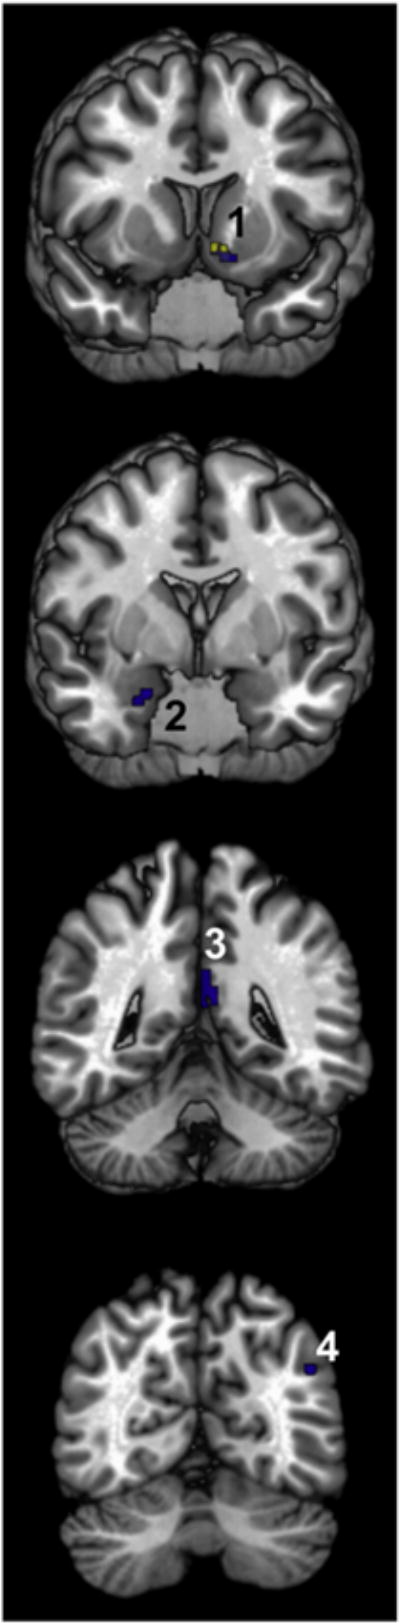
Functional connectivity patterns of areas 25 (red), s24 (blue), s32 (green) and 33 (yellow) displayed on the MNI single subject template. Numbers indicate clusters in area Fp2 (1), the pACC region (2), the superior frontal sulcus (3), the insula (4), the rolandic operculum (5), the superior frontal gyrus (6), the laterobasal group of the amygdala (7), the anterior portion of the thalamus (8), the cornu ammonis region of the hippocampus (9), area OP 1 (10), the dPCC/RSC region (11), area BA1 (12), the vPCC region (13), area PGp (14), and area hOc2 (15). Asterisks indicate clusters surrounding the seed regions. Cluster sizes and assignations are specified in Table 3.
Table 3.
Functional co-activation clusters for areas s24, s32 and 33. Cluster maxima assigned to the most probable cytoarchitectonic area when present in the SPM Anatomy Toolbox (Eickhoff et al., 2005). Cytoarchitectonic parcellation of the cortical areas has been published as follows: 1 (somatosensory area 1; Geyer et al., 1999, 2000), anterior insular region (Kurth et al., 2010), anterior part of the thalamus (projecting to the prefrontal cortex; Behrens et al., 2003), CA (cornu ammonis region of the hippocampus; Amunts et al., 2005), dPCC (dorsal posterior cingulate cortex; encompasses areas 23d, d23 and 31; Vogt et al., 2001, 2006), Fp2 (frontopolar area 2; Bludau et al., 2014), hOc2 (Brodmann’s area 18; Amunts et al., 2000), LB (laterobasal nucleus of the amygdala; Amunts et al., 2005), OP 1 (opercular area 1; Eickhoff et al., 2006a), PGp (inferior parietal area PGp; Caspers et al., 2008), RSC (retrosplenial cortex; encompasses areas 29 and 30; Vogt et al., 2001), and vPCC (ventral posterior cingulate cortex; encompasses areas v23 and 31; Vogt et al., 2001, 2006). l.c. maximum found within the local cluster containing the seed region.
| Macroanatomical location | Hemisphere | Cytoarchitectonic area/brain region | Cluster size [voxel] | Anatomical MNI
|
||
|---|---|---|---|---|---|---|
| x | y | z | ||||
| Area 25 | ||||||
| Postcentral gyrus | L | 1 [42%] | 9 | −52 | −32 | 53 |
| Cerebellum | R | Lobule IX [54%] | 9 | 2 | −52 | −27 |
| Inferior occipital gyrus | R | hOc2 [49%] | 5 | 30 | −102 | −5 |
| Superior cingulate gyrus | R | pACC | 4 | 4 | 38 | 3 |
| Area s24 | ||||||
| Midorbital gyrus | R | Fp2 [64%] | l.c. | 2 | 48 | − 12 |
| Basal ganglia | L | Nucleus accumbens | l.c. | −10 | −2 | −3 |
| Amygdala | R | LB [71%] | 83 | 24 | −8 | −15 |
| Precuneus | L | vPCC | 70 | −4 | −58 | 27 |
| Angular gyrus | L | PGp [59%] | 2 | −46 | −74 | 41 |
| Amygdala | L | LB [79%] | 2 | −22 | −6 | −17 |
| Thalamus | R | Anterior [50%] | 2 | 6 | −16 | 13 |
| Area s32 | ||||||
| Superior cingulate gyrus | L | pACC | l.c. | 0 | 42 | 4 |
| Superior medial gyrus | L | Fp2 [78%] | l.c. | −2 | 62 | 2 |
| Precuneus | L | vPCC | 301 | −6 | −60 | 25 |
| Angular gyrus | L | PGp [50%] | 60 | −48 | −72 | 37 |
| Hippocampus | L | CA [55%] | 45 | −22 | −18 | −15 |
| Basal ganglia | L | Nucleus accumbens | 38 | −8 | 2 | 1 |
| Amygdala | R | LB [49%] | 31 | 22 | −10 | − 17 |
| Superior frontal sulcus | L | 10 | −26 | 20 | 49 | |
| Precuneus | R | vPCC | 9 | 4 | −54 | 21 |
| Cingulate gyrus | L | dPCC | 6 | −8 | −28 | 45 |
| Area 33 | ||||||
| Basal ganglia | L | Nucleus accumbens | l.c. | −12 | −2 | −8 |
| Insular lobe | L | Anterior insula | 100 | −34 | 14 | 5 |
| Insular lobe | R | Anterior insula | 61 | 36 | 20 | −1 |
| Thalamus | L | Anterior [79%] | 57 | −14 | −18 | 11 |
| Cingulate gyrus | R | dPCC/RSC | 34 | 4 | −32 | 39 |
| Superior frontal gyrus | R | 30 | 2 | 6 | 55 | |
| Thalamus | R | Anterior [50%] | 25 | 8 | −16 | 6 |
| Rolandic operculum | L | 15 | −48 | 14 | −6 | |
| Supramarginal gyrus | L | OP 1 [61%] | 3 | −56 | −26 | 23 |
Area s24 (Fig. 4, Table 3) was associated with six co-activation clusters. Maxima within these clusters were located in the inferior parietal lobe (area PGp; Table 3) and the posterior cingulate cortex caudal to the splenium of the corpus callosum (vPCC) of the left hemisphere. The region vPCC encompasses areas 23d, d23 and 31 (Table 3). Further co-activation foci were found bilaterally in the laterobasal group of the amygdala and in the right anterior portion of the thalamus connected with the prefrontal cortex. Furthermore, the cluster surrounding the seed region also contained maxima located within the left frontopolar area Fp2 (Table 3) and the pACC.
Area s32 (Fig. 4, Table 3) also co-activated with both cortical and subcortical structures. Three clusters were located within the posterior cingulate cortex: one on the left cingulate gyrus just above the splenium of the corpus callosum (dPCC), and two in vPCC. Although the latter co-activation was bilateral, the cluster in the left vPCC (301 voxels) was considerably larger than that in the right one (9 voxels). Additionally, area s32 co-activated with inferior parietal area PGp (Table 3) and the hippocampal Cornu Ammonis (CA) region of the left hemisphere as well as with a cluster located on the ventral bank of the superior frontal sulcus. Subcortically, the left globus pallidus and nucleus accumbens as well as the right laterobasal nucleus of the amygdala co-activated with area s32. Furthermore, the cluster surrounding the seed region also contained a maximum located within the right frontopolar area Fp2 (Table 3).
Area 33 (Fig. 4, Table 3) co-activated with a cluster located on the right cingulate gyrus just above the splenium of the corpus callosum. Since this cluster could not be unequivocally assigned to area 23 of the PCC or areas 29 or 30 of the retrosplenial cortex (RSC; Table 3), it was denominated dPCC/RSC. Additionally, area 33 co-activated with clusters located on the medial surface of the right superior frontal gyrus, in the left opercular area OP 1 (Table 3), and in the left rolandic operculum. Furthermore, area 33 co-activated bilaterally with clusters located in the anterior insular cortex and in the anterior portion of the thalamus connected with the prefrontal cortex (Table 3).
The conjunction analyses revealed a relative small overlap in the co-activation patterns of sACC areas, which only involved areas s24, s32 and 33, but excluded area 25 (Fig. 5, Table 4). Areas s24 and s32 had four common co-activation clusters: in area PGp and the vPCC region of the left hemisphere, as well as in the right amygdala and the left nucleus accumbens. Areas s32 and 33 shared one common co-activation cluster, which was also located in the left nucleus accumbens.
Fig. 5.
Clusters revealed by the conjunction analyses. Only areas s24 and s32 (in blue) and areas s32 and 33 (in yellow) had common co-activation clusters. Numbers indicate clusters in the nucleus accumbens (1), the laterobasal group of the amygdala (2), the vPCC region (3), and area PGp (4). Cluster sizes and assignations are specified in Table 4.
Table 4.
Stereotaxic coordinates (specified in anatomical MNI space) of clusters revealed by the conjunction analyses. Cluster maxima assigned to the most probable cytoarchitectonic area when present in the SPM Anatomy Toolbox (Eickhoff et al., 2005). Cytoarchitectonic parcellation of the cortical areas has been published as follows: LB (laterobasal nucleus of the amygdala; Amunts et al., 2005), PGp (inferior parietal area PGp; Caspers et al., 2008), and vPCC (ventral posterior cingulate cortex; encompasses areas v23 and 31; Vogt et al., 2006).
| Macroanatomical location | Hemisphere | Cytoarchitectonic area/brain region | Cluster size [voxel] | Anatomical MNI
|
||
|---|---|---|---|---|---|---|
| x | y | z | ||||
| Areas s32 and s24 | ||||||
| Precuneus | L | vPCC | 69 | −4 | −54 | 22 |
| Basal ganglia | L | Nucleus accumbens | 30 | −8 | 2 | −1 |
| Amygdala | R | LB [58%] | 25 | 22 | −8 | −15 |
| Angular gyrus | L | PGp [59%] | 12 | −46 | −74 | 41 |
| Areas s32 and 33 | ||||||
| Basal ganglia | L | Nucleus accumbens | 38 | −8 | 2 | 1 |
The contrast analyses (Table 5) revealed that s24 was more strongly associated with the left nucleus accumbens than s32. It showed a stronger co-activation with the left vPCC and CA regions and with the left area PGp than did area 33. Area s32 was stronger co-activated with the left frontopolar area Fp2 and with the vPCC region (bilaterally) than was s24. It was also more strongly associated with the left vPCC and CA regions and with the left area PGp than was area 25. Additionally, s32 was stronger co-activated with area PGp and the superior frontal sulcus of the left hemisphere as well as with the laterobasal nucleus of the amygdala and vPCC of the right hemisphere than was area 33. Area 33 was more strongly associated with the left rolandic operculum, left anterior insula, right dPCC/RSC, and bilateral thalamus than were s24 or s32. Additionally, area 33 also showed a stronger co-activation with OP 1 than did s32. Finally, 33 was more strongly co-activated with the left amygdala, anterior insula and area OP 1 as well as with the right dPCC/RSC than was area 25.
Table 5.
Stereotaxic coordinates (specified in anatomical MNI space) of clusters revealed by the contrast analyses. Cluster maxima assigned to the most probable cytoarchitectonic area when present in the SPM Anatomy Toolbox (Eickhoff et al., 2005). Cytoarchitectonic parcellation of the cortical areas has been published as follows: anterior insular region (Kurth et al., 2010), anterior part of the thalamus (projecting to the prefrontal cortex; Behrens et al., 2003), CA (Cornu Ammonis region of the hippocampus; Amunts et al., 2005), Fp2 (frontopolar area 2 Bludau et al., 2014), dPCC (dorsal posterior cingulate cortex; encompasses areas 23d, d23 and 31; Vogt et al., 2001, 2006), LB (laterobasal nucleus of the amygdala; Amunts et al., 2005), OP 1 (opercular area 1; Eickhoff et al., 2006a), PGp (inferior parietal area PGp; Caspers et al., 2008), RSC (retrosplenial cortex; encompasses areas 29 and 30; Vogt et al., 2001), and vPCC (ventral posterior cingulate cortex; encompasses areas v23 and 31; Vogt et al., 2001, 2006).
| Macroanatomical location | Hemisphere | Cytoarchitectonic area/brain region | Cluster size [voxel] | Anatomical MNI
|
||
|---|---|---|---|---|---|---|
| x | y | z | ||||
| s24 stronger than s32 | ||||||
| Basal ganglia | L | Nucleus accumbens | 41 | −8 | −6 | −5 |
| s24 stronger than 33 | ||||||
| Precuneus | L | vPCC | 69 | −4 | −60 | 23 |
| Hippocampus | L | CA [44%] | 61 | 22 | −12 | −19 |
| Angular gyrus | L | PGp [45%] | 17 | −44 | −72 | 41 |
| s32 stronger than s24 | ||||||
| Superior medial gyrus | L | Fp2 [63%] | 57 | −2 | 60 | 3 |
| Precuneus | L | vPCC | 39 | −6 | −64 | 25 |
| Precuneus | R | vPCC | 3 | 4 | −52 | 23 |
| s32 stronger than 25 | ||||||
| Hippocampus | L | CA [51%] | 31 | −20 | −16 | −17 |
| Precuneus | L | vPCC | 12 | 2 | −56 | 33 |
| Angular gyrus | L | PGp [65%] | 7 | −46 | −76 | 35 |
| s32 stronger than 33 | ||||||
| Angular gyrus | L | PGp [65%] | 59 | −46 | −72 | 35 |
| Amygdala | R | LB [67%] | 30 | 24 | −8 | − 19 |
| Superior frontal sulcus | L | 10 | −24 | 18 | 49 | |
| Hippocampus | L | CA [48%] | 10 | −22 | −22 | − 15 |
| Precuneus | R | vPCC | 8 | 2 | −54 | 21 |
| 33 stronger than s24 | ||||||
| Rolandic operculum | L | 72 | −36 | 12 | 9 | |
| Thalamus | L | Anterior [94%] | 56 | −12 | −18 | 9 |
| Cingulate gyrus | R | dPCC/RSC | 34 | 4 | −30 | 35 |
| Insular lobe | L | Anterior insula | 10 | 36 | 20 | −5 |
| Thalamus | R | Prefrontal [87%] | 3 | 8 | −14 | 7 |
| 33 stronger than s32 | ||||||
| Rolandic operculum | L | 97 | −38 | 12 | 7 | |
| Thalamus | L | Anterior [79%] | 57 | −14 | −18 | 11 |
| Insular lobe | R | Anterior insula | 33 | 38 | 20 | −5 |
| Cingulate gyrus | R | dPCC/RSC | 27 | 4 | −32 | 35 |
| Thalamus | R | Anterior [92%] | 9 | 8 | −20 | 9 |
| Supramarginal gyrus | L | OP 1 [61%] | 3 | −56 | −26 | 23 |
| 33 stronger than 25 | ||||||
| Thalamus | L | Anterior [98%] | 57 | −10 | −22 | 9 |
| Insular lobe | L | Anterior insula | 44 | −32 | 16 | 9 |
| Cingulate gyrus | R | dPCC/RSC | 14 | 2 | −30 | 35 |
| Supramarginal gyrus | L | OP 1 [61%] | 3 | −56 | −26 | 23 |
Functional characterization of sACC areas
We performed a functional decoding analysis based on the BrainMap meta-data to outline the functional profiles of areas 25, s24, s32 and 33 and determine the functional domains and paradigm classes with which they were significantly associated (Fig. 6). The additional functional characterization of each area’s co-activation network revealed very similar and, hence, unspecific results for all areas. This was particularly obvious for the reverse inference (Supplementary Fig. 1). Therefore, we constrain the functional profiling to the area-specific analysis.
Fig. 6.
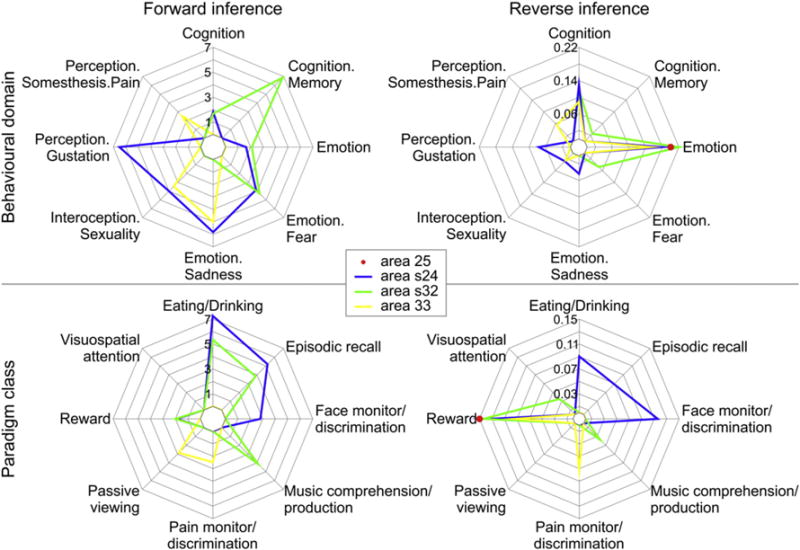
Functional fingerprint of areas 25, s24, s32 and 33. Significant associations with behavioral domains (top row; P(Activation|Domain)) and paradigm classes (bottom row; P(Domain|Activation)) of the BrainMap meta-data (www.brainmap.org; category labeling). Forward inference determines above-chance brain activity given the presence of a psychological term (left column; axis labeling indicates the likelihood ratio values), and reverse inference determines the above-chance probability of a psychological term given the observed brain activity (right column; axis labeling indicates probability values).
Notably, there were significant effects for area 25 only in the reverse inference approach, where it belonged to the emotion behavioral domain and the reward paradigm class (Fig. 6). Therefore, we did not further characterize functions assigned to this area because results were considered robust only in the case of congruent forward and inverse inferences (see Material and methods).
Area s24 (Fig. 6) was significantly associated with emotion, i.e. the mental faculty of experiencing an affective state of consciousness. Additionally, it was specifically found to be activated by emotions of sorrow or mourning characterized by unhappiness or grief. Area s24 was also significantly activated by the face monitor/discrimination task and by cognitive processes, in particular with the reward and episodic recall tasks, and associated with the sense of tasting and with interoception, i.e. the processing of stimuli originating inside of the body.
Area s32 (Fig. 6) was also found to be significantly associated with emotion and cognition, in particular with memory processes. However, in contrast to area s24, area s32 was linked to the processing of fear rather than to that of sadness. Area s32 was also activated by reward tasks, which can be grouped under both the cognition and the emotion behavioral domains, as well as with music comprehension/production tasks, which are coupled with the cognitive behavioral domain.
Area 33 (Fig. 6) was assigned to the interoception and pain perception domains, in particular monitoring and discrimination of painful thermal or electrical stimulation.
Discussion
The present study provides an analysis of the organization of the human subgenual anterior cingulate cortex by determining the functional domains and connectivity of the cytoarchitectonically defined sACC areas 25, s24, s32, and 33 (Palomero-Gallagher et al., 2008). To this end we generated continuous and maximum probability maps, the latter of which were used as seed volumes for subsequent database-driven analysis of task-dependent functional connectivity and functional decoding. Hereby, functions of cytoarchitectonic areas and their interactions with other brain regions could be inferred. Areas 25, s24, s32 and 33 differed in their functional connectivity profiles and behavioral domains. s24 and s32 co-activated with different components of the affective (George et al., 1995) and executive control (Seeley et al., 2007) networks. Additionally, s32 co-activated with elements of the emotional–arousal (George et al., 1995; Lévesque et al., 2003) and default mode networks. Area 33 co-activated with components of the sensorimotor (Hänggi et al., 2010) and pain (Apkarian and Shi, 1994; Frot and Mauguiere, 2003; Treede et al., 2000) networks, whereas 25 did so with areas of the autonomic afferent processing network (Labus et al., 2008). Areas s24 and s32 shared a common functional profile involving the cognition and emotion behavioral domains. Areas s24 and s32 were both associated with emotion, but are involved in the processing of sadness and fear, respectively. Areas s24 and 33 are both activated during interoception. s24 was involved in the perception of taste, and area 33 in that of pain.
Notably, no co-activation clusters could be determined for the 36 experiments activating area 25, nor could it be associated with a specific domain in both forward and reverse inference procedures, indicating that either the functional categories which activate area 25 are not consistently represented in psychological domains as covered by the BrainMap database (Fox and Lancaster, 2002).
sACC and volumetric analyses
None of the sACC areas showed interhemispheric differences. Likewise, Gittins and Harrison (2004) did not find differences in neuronal densities between left and right human area 24. Further support comes from studies assessing gray matter volume by means of voxel-based morphometry (VBM; Almeida et al., 2009; Kong et al., 2013; Liao et al., 2014) or by definition of volumes of interest based on macroscopical landmarks (Coryell et al., 2005; Fornito et al., 2009; Koo et al., 2008; Zetzsche et al., 2007). They revealed no interhemispheric differences within the sACC of healthy volunteers. Additionally, a meta-analysis examining the effect of emotional valence on regional brain activations found no lateralization of emotional function in the sACC of healthy male or female subjects (Wager et al., 2003).
Functional imaging studies have revealed gender-specific differences in the sACC at rest (Filippi et al., 2013; Gur et al., 1995) and in response to tasks probing for different aspects of affect and emotion processing (Butler et al., 2005; Grossman and Wood, 1993; Kohn et al., 2011; Lebron-Milad and Milad, 2012). The present results suggest the contribution of specific cytoarchitectonically identified areas, namely s24 and s32, to these regional gender differences, and may shed light on the neurobiologic substrates of behavioral gender differences in healthy volunteers. Since male brains are larger than female brains, it is important to control the gender difference for the effect of absolute brain size (Luders et al., 2014; Perlaki et al., 2014). In the present study, s32 and s24 were larger in the brains of males than in those of females even after correction for absolute brain size. A recent VBM study found smaller sACC/orbitofrontal volumes in women than in men (Li et al., 2014), although other studies assessing gray matter volume by means of VBM (Almeida et al., 2009; Kong et al., 2013; Liao et al., 2014) or by definition of volumes of interest based on macroscopical landmarks (Coryell et al., 2005; Fornito et al., 2009; Koo et al., 2008; Zetzsche et al., 2007) did not describe gender differences within the sACC of healthy volunteers.
The controversial results reported in the literature may be caused by different definitions of the structural entities. In many areas of the cerebral cortex, such entities cannot be reliably defined, even in high resolution MR images, because, as shown in the present study, the borders of cytoarchitectonically defined sACC areas are not consistently associated with macroscopical landmarks. E.g., although cytoarchitectonically defined area 33 is buried in the callosal sulcus, its lateral border cannot be defined by a landmark. The parolfactory sulcus was the anterior border of area 25 in many cases, but cannot be considered a reliable landmark in all cases, since it was absent in 20% of our examined hemispheres (n = 20). Furthermore, area 25 extended rostral to this landmark in 25% of the cases in which the sulcus was present. The situation for s24 was even more complicated: the rostral border of this area could not be aligned to any landmark, the caudal border varied depending on the extent of area 25 or the presence of the anterior parolfactory sulcus, and its ventral border was the cingulate sulcus, but in 20% of the hemispheres this sulcus did not extend sufficiently in the ventro-caudal direction to serve as a reliable border. Since the dorsal and caudal borders of s32 were found in the cingulate sulcus, where it adjoined s24, this landmark provided the same difficulties as discussed for s24, i.e., the cingulate sulcus was not always present at this position. A comparable problem applied to the ventral border of s32, since the superior rostral sulcus did not always extend far enough caudally to provide a reliable ventral macroscopical landmark. The rostral border of s32 could not be aligned to any macroscopical landmark either. It clearly extended rostral to the most frequently used landmark, i.e., the coronal plane defined through the most rostral tip of the genu corporis callosi. Thus, no macroscopical landmark highlighted the border between sACC and pACC. The variable relationship between macroscopical landmarks and cytoarchitectonically defined borders is shown in Fig. 1. Therefore, we can conclude, probabilistic cytoarchitectonic brain maps are necessary for a reliable and precise anatomical localization of functional imaging data or of volumetric MRI-based studies. Although it is true that in some cases sulci are good predictors of Brodmann’s areas (Fischl et al., 2008), probabilistic maps are necessary to quantify variability in the position, size and extent of cytoarchitectonic areas, and enable statistical analysis of topographical relationships between the localization of cytoarchitectonical borders and macroanatomical landmarks (Amunts et al., 2007; Weiner et al., 2014; Zilles et al., 2002).
Finally, existing volumetric studies have mostly underestimated the volume of human sACC, since its rostral boundary is often set at the coronal plane defined by the rostral extreme of the genu of the corpus callosum (Asami et al., 2008; Frodl et al., 2008; Malykhin et al., 2012; Yucel et al., 2009). This also holds true for studies in non-human primates (Blatchley and Hopkins, 2010). These studies underestimate the volume of sACC, i.e. the sum of the volumes of cytoarchitectonically defined areas 25, s24 and s32, by 32%. When considering each area individually, they underestimate the volume of areas s24 and s32 by 6% and 60%, respectively, though not that of area 25.
Functional connectivity and functional domains of sACC areas
Meta-analytic co-activation analyses place the functional aspects of a single area into the context of a neural network. This may be particularly fruitful to infer brain–behavior relationships according to the functional integration perspective on brain function (Fox and Friston, 2012). Hence, we discuss the functional organization of the sACC and the putative roles of areas 25, s24, s32 and 33 based on commonalities as well as on differences between co-activation networks. Areas s24 and s32 share the greatest degree of overlap in their co-activation networks, as revealed by the conjunction analysis, while contrasts highlight distinct connectivity patterns for areas 25 and 33, and less so for s24 and s32. Although functional connectivity does not imply a direct anatomical connection between the respective brain regions (Eickhoff and Grefkes, 2011), co-activations of s24 and s32 with the amygdala may be based on the anatomical connectivity, as identified in fiber tracking studies in the human brain based on diffusion weighted imaging (Johansen-Berg et al., 2008), or in tracer studies in non-human primates (Freedman et al., 2000). Likewise, co-activations of s24 and s32 with different parts of the PCC may be explained by the intracingulate connections described for the monkey (Vogt and Pandya, 1987).
Area 25, the main hub of the cortical autonomic network (Gianaros et al., 2005; Kimmerly et al., 2005; Wong et al., 2007), was found to co-activate with the cerebellum and pACC regions, which have also been described as belonging to the cortical autonomic (Gianaros et al., 2005; Kimmerly et al., 2005; Wong et al., 2007). Area 25 has been associated with the more automated bottom-up aspects of emotional processing and, therefore, functional neuroimaging using contrasts between different experimental conditions in the MR scanner rarely finds functional specific activation of area 25. Indeed, only 36 of the ~12,000 experiments currently stored in the BrainMap database result in an activation of this area. Therefore, it is not surprising that no behavioral domain or paradigm class could be significantly associated with area 25 in the present study.
Area 33 co-activated with areas of the previously defined sensorimotor network (Hänggi et al., 2010), including cytoarchitectonically defined area OP 1 (Eickhoff et al., 2006c), which has been involved in the perception of painful stimuli (Eickhoff et al., 2006a; Farrell et al., 2005; Frot and Mauguiere, 2003). Area 33 also co-activated with the anterior insula, which is considered to be part of both medial and lateral pain systems due to its output into the amygdala and anterior cingulate cortex, and its input from lateral thalamic nuclei (Apkarian and Shi, 1994; Frot and Mauguiere, 2003; Treede et al., 2000). The specificity of these co-activations was confirmed by the conjunction and contrasts analyses. Therefore, and given that ACC is also thought to mediate the affective-motivational component in pain perception, on which emotional reflexes following the painful sensation depend (Farrell et al., 2005; Price, 2000; Vogt, 2005), it is not surprising to find that area 33, a cytoarchitectonical entity within the ACC, is significantly associated with the processing of pain, as revealed by the functional decoding analysis. However, at this point it is also important to emphasize, that area 33 is not restricted to sACC, but that it extends rostrally and dorsally into pACC and the midcingulate cortex. Therefore, the assignment of pain as a function of area 33 remains to be supported by further observations.
The functional connectivity patterns of areas s24 and s32 presented the greatest degree of overlap. The conjunction analysis revealed that they both co-activated with cytoarchitectonically identified area PGp (Caspers et al., 2006), the vPCC, and the nucleus accumbens of the left hemisphere, as well as with the laterobasal nucleus of the right amygdala. Additionally, both areas co-activated with cytoarchitectonically defined medial frontopolar area Fp2 (Bludau et al., 2014), although s24 did so in the right hemisphere and s32 in the left one. Co-activation of areas s24 and s32 with area Fp2 and the laterobasal nucleus of the amygdala is in accordance with the fact that the sACC, medial frontopolar cortex and amygdala have been described as being components of the affective network, which attaches an emotional significance to external stimuli (George et al., 1995). Co-activation of s24 and s32 with Fp2 also provides further evidence for the involvement of the mesial part of the human frontal pole in emotional control and social cognition (Bludau et al., 2014; Dreher et al., 2008). We found areas s24 and s32 to be associated with the processing of emotion. Indeed, numerous studies have linked the ACC with the processing of emotions such as happiness, sadness and fear. Specifically, sACC activity plays a crucial role in regulating the impact of aversive stimuli and is associated with sadness, whereas happiness-related activations have been assigned to pACC (George et al., 1995; Karama et al., 2011; Liotti et al., 2000; Smith et al., 2011; Vogt, 2005). In accordance with these reports, our functional decoding analysis revealed the existence of an association of sACC areas with tasks involving the processing of sadness, and not with that of happiness. sACC is also associated with fear conditioning and its inhibition during extinction of learned fear (Etkin et al., 2011; Linnman et al., 2012; Mechias et al., 2010), and may represent the domain-general controller of perceived fear and aversiveness thought to modulate negative affective responses in phylogenetically older structures of the emotion processing system (Diekhof et al., 2011; Etkin et al., 2011; Linares et al., 2012).
However, it is important to note that areas s24 and s32 also showed significant differences in co-activations, with area s24 in contrast to s32 more connected to the basal ganglia and s32 more related to the vPCC. The basal ganglia, and in particular the nucleus accumbens, are more involved in bottom-up emotional processing, whereas the vPCC is associated in top-down processing, as the internal representation and evaluation of emotion. This functional difference between the preferential co-activation of s24 and s32 is paralleled by each area’s respective functional characterization. We found that s24 was the only sACC area specifically involved in the processing of sadness, and s32 was the specific site within sACC to be activated during the processing of fear. The present study shows that the definition of areas s24 and s32 within the region of Brodmann’s areas 24 and 32, respectively, and within sACC (Palomero-Gallagher et al., 2008) is not a simple “anatomical” refinement. Rather, the present results demonstrate for the first time the existence of a structural/functional entity different from the rest of BA24 and sACC, since s24 differs by its cyto- and receptorarchitecture from the other areas of BA24 and of sACC (Palomero-Gallagher et al., 2008), and is specifically involved in the processing of sadness. Likewise, s32 is also a distinct structural and functional entity which must be clearly separated as a cortical area from the rest of BA32 and sACC.
The whole region of the anterior cingulate cortex has been described as the site involved in the integration of information concerning the consonance of taste and olfactory components in order to assess pleasantness during food intake, i.e. reward-related information, whereas cortical activity in the anterior insula is associated with the processing of physical properties such as intensity of odor or taste (McCabe and Rolls, 2007; Rolls, 2009; Small, 2012). The amygdala also plays a pivotal role in the encoding of aversive and appetitive stimuli, as well as in the amygdala–cingulate interactions occurring during potential threat assessment (Fernando et al., 2013; Fiddick, 2011; Fossati, 2012; Shin and Liberzon, 2010; Toyoda et al., 2011). Although we found both s24 and s32 to be co-activated with the laterobasal nucleus of the amygdala, only area s24 was associated with the perception of gustation, i.e., it was the only cyto- and receptorarchitectonical distinct cortical area within sACC(Palomero-Gallagher et al., 2008), which is activated during the emotional evaluation of taste.
Furthermore, sACC has been shown to play a modulatory role in the suppressed processing of emotional stimuli under cognitive demand (Kellermann et al., 2013), and we found an association of areas s24 and s32 with the cognition domain of the BrainMap database (Fox and Lancaster, 2002), i.e. with the integration of awareness, perception, reasoning, and judgment. This is in accordance with the hypothesis that sACC forms part of a network subserving the cognitive control of emotion (Cromheeke and Mueller, 2014). sACC is activated when a cognitive control task is carried out in an emotional context, or the emotional stimuli are relevant to the cognitive task being carried out (Cromheeke and Mueller, 2014). Both areas are activated by tasks such as the reward task, which involve a cognition–emotion interaction within a cognitive control setting, which is mirrored in their shared co-activation network comprising the basal ganglia, amygdala, vPCC and area PGp. However, only area s32 was associated with the cognition memory subdomain, i.e. with the mental faculty of retaining and reviving facts, events, or impressions, or of recalling or recognizing previous experiences.
In conclusion, the sACC is a structurally and functionally heterogeneous brain region. We have shown that functions which have previously been attributed to the complete sACC should in fact be attributed to cytoarchitectonically distinct areas within this region: area s24 is activated during the processing of sadness and the emotional evaluation of taste, whereas areas s32 and 33 are associated with fear extinction and pain perception, respectively. Additionally, areas s24, s32 and 33 differ in their functional connectivity profiles, and co-activate with a widespread, minimally overlapping network of cortical and subcortical structures which have been attributed to affective, executive control, or sensorimotor networks.
Supplementary Material
Acknowledgments
This study was partly supported by the Deutsche Forschungs-gemeinschaft (EI 816/4-1 to S.B.E. and 3071/3-1 to S.B.E.), the National Institute of Mental Health (R01-MH074457 to S.B.E.), and the European Union Seventh Framework Programme (FP7/2007-2013) under grant agreement no. 604102 (HBP).
Footnotes
Supplementary data to this article can be found online at http://dx.doi.org/10.1016/j.neuroimage.2015.04.053.
Conflict of interest
The authors have no conflict of interest to declare.
References
- Almeida JR, Akkal D, Hassel S, Travis MJ, Banihashemi L, Kerr N, Kupfer DJ, Phillips ML. Reduced gray matter volume in ventral prefrontal cortex but not amygdala in bipolar disorder: significant effects of gender and trait anxiety. Psychiatry Res Neuroimaging. 2009;171:54–68. doi: 10.1016/j.pscychresns.2008.02.001. [DOI] [PMC free article] [PubMed] [Google Scholar]
- Amunts K, Malikovic A, Mohlberg H, Schormann T, Zilles K. Brodmann’s areas 17 and 18 brought into stereotaxic space—where and how variable? NeuroImage. 2000;11:66–84. doi: 10.1006/nimg.1999.0516. [DOI] [PubMed] [Google Scholar]
- Amunts K, Kedo O, Kindler M, Pieperhoff P, Mohlberg H, Shah NJ, Habel U, Schneider F, Zilles K. Cytoarchitectonic mapping of the human amygdala, hippocampal region and entorhinal cortex: intersubject variability and probability maps. Anat Embryol. 2005;210:343–352. doi: 10.1007/s00429-005-0025-5. [DOI] [PubMed] [Google Scholar]
- Amunts K, Schleicher A, Zilles K. Cytoarchitecture of the cerebral cortex—more than localization. NeuroImage. 2007;37:1061–1065. doi: 10.1016/j.neuroimage.2007.02.037. [DOI] [PubMed] [Google Scholar]
- An X, Bandler R, Öngür D, Price JL. Prefrontal cortical projections to longitudinal columns in the midbrain periaqueductal gray in macaque monkeys. J Comp Neurol. 1998;401:479–544. [PubMed] [Google Scholar]
- Apkarian AV, Shi T. Squirrel monkey lateral thalamus. I Somatic nociresponsive neurons and their relation to spinothalamic terminals. J Neurosci. 1994;14:6779–6795. doi: 10.1523/JNEUROSCI.14-11-06779.1994. [DOI] [PMC free article] [PubMed] [Google Scholar]
- Asami T, Hayano F, Nakamura M, Yamasue H, Uehara K, Otsuka T, Roppongi T, Nihashi N, Inoue T, Hirayasu Y. Anterior cingulate cortex volume reduction in patients with panic disorder. Psychiatry Clin Neurosci. 2008;62:322–330. doi: 10.1111/j.1440-1819.2008.01800.x. [DOI] [PubMed] [Google Scholar]
- Behrens TE, Johansen-Berg H, Woolrich MW, Smith SM, Wheeler-Kingshott CA, Boulby PA, Barker GJ, Sillery EL, Sheehan K, Ciccarelli O, Thompson AJ, Brady JM, Matthews PM. Non-invasive mapping of connections between human thalamus and cortex using diffusion imaging. Nat Neurosci. 2003;6:750–757. doi: 10.1038/nn1075. [DOI] [PubMed] [Google Scholar]
- Blatchley BJ, Hopkins WD. Subgenual cingulate cortex and personality in chimpanzees (Pan troglodytes) Cogn Affec Behav Neurosci. 2010;10:414–421. doi: 10.3758/CABN.10.3.414. [DOI] [PMC free article] [PubMed] [Google Scholar]
- Bludau S, Eickhoff SB, Mohlberg H, Caspers S, Laird AR, Fox PT, Schleicher A, Zilles K, Amunts K. Cytoarchitecture, probability maps and functions of the human frontal pole. NeuroImage. 2014;93:260–275. doi: 10.1016/j.neuroimage.2013.05.052. [DOI] [PMC free article] [PubMed] [Google Scholar]
- Butler T, Pan H, Epstein J, Protopopescu X, Tuescher O, Goldstein M, Cloitre M, Yang Y, Phelps E, Gorman J, Ledoux J, Stern E, Silbersweig D. Fear-related activity in subgenual anterior cingulate differs between men and women. NeuroReport. 2005;16:1233–1236. doi: 10.1097/00001756-200508010-00020. [DOI] [PubMed] [Google Scholar]
- Caspers S, Geyer S, Schleicher A, Mohlberg H, Amunts K, Zilles K. The human inferior parietal cortex: cytoarchitectonic parcellation and interindividual variability. NeuroImage. 2006;33:430–448. doi: 10.1016/j.neuroimage.2006.06.054. [DOI] [PubMed] [Google Scholar]
- Caspers S, Eickhoff SB, Geyer S, Scheperjans F, Mohlberg H, Zilles K, Amunts K. The human inferior parietal lobule in stereotaxic space. Brain Struct Funct. 2008;212:481–495. doi: 10.1007/s00429-008-0195-z. [DOI] [PubMed] [Google Scholar]
- Chiba T, Kayahara T, Nakano K. Efferent projections of infralimbic and prelimbic areas of the medial prefrontal cortex in the Japanese monkey, Macaca fuscata. Brain Res. 2001;888:83–101. doi: 10.1016/s0006-8993(00)03013-4. [DOI] [PubMed] [Google Scholar]
- Cieslik EC, Zilles K, Caspers S, Roski C, Kellermann TS, Jakobs O, Langner R, Laird AR, Fox PT, Eickhoff SB. Is there “one” DLPFC in cognitive action control? Evidence for heterogeneity from co-activation-based parcellation. Cereb Cortex. 2013;23:2677–2689. doi: 10.1093/cercor/bhs256. [DOI] [PMC free article] [PubMed] [Google Scholar]
- Clos M, Amunts K, Laird AR, Fox PT, Eickhoff SB. Tackling the multifunctional nature of Broca’s region meta-analytically: co-activation-based parcellation of area 44. NeuroImage. 2013;83:174–188. doi: 10.1016/j.neuroimage.2013.06.041. [DOI] [PMC free article] [PubMed] [Google Scholar]
- Collins DL, Neelin P, Peters TM, Evans AC. Automatic 3D intersubject registration of MR volumetric data in standardized Talairach space. J Comput Assist Tomogr. 1994;18:192–205. [PubMed] [Google Scholar]
- Coryell W, Nopoulos P, Drevets W, Wilson T, Andreasen NC. Subgenual prefrontal cortex volumes in major depressive disorder and schizophrenia: diagnostic specificity and prognostic implications. Am J Psychiatry. 2005;162:1706–1712. doi: 10.1176/appi.ajp.162.9.1706. [DOI] [PubMed] [Google Scholar]
- Cromheeke S, Mueller SC. Probing emotional influences on cognitive control: an ALE meta-analysis of cognition emotion interactions. Brain Struct Funct. 2014;219:995–1008. doi: 10.1007/s00429-013-0549-z. [DOI] [PubMed] [Google Scholar]
- Diekhof EK, Geier K, Falkai P, Gruber O. Fear is only as deep as the mind allows: a coordinate-based meta-analysis of neuroimaging studies on the regulation of negative affect. NeuroImage. 2011;58:275–285. doi: 10.1016/j.neuroimage.2011.05.073. [DOI] [PubMed] [Google Scholar]
- Dreher JC, Koechlin E, Tierney M, Grafman J. Damage to the fronto-polar cortex is associated with impaired multitasking. PLoS ONE. 2008;3:e3227. doi: 10.1371/journal.pone.0003227. [DOI] [PMC free article] [PubMed] [Google Scholar]
- Duerden EG, Albanese MC. Localization of pain-related brain activation: a meta-analysis of neuroimaging data. Hum Brain Mapp. 2013;34:109–149. doi: 10.1002/hbm.21416. [DOI] [PMC free article] [PubMed] [Google Scholar]
- Eickhoff SB, Grefkes C. Approaches for the integrated analysis of structure, function and connectivity of the human brain. Clin EEG Neurosci. 2011;42:107–121. doi: 10.1177/155005941104200211. [DOI] [PMC free article] [PubMed] [Google Scholar]
- Eickhoff SB, Stephan KE, Mohlberg H, Grefkes C, Fink GR, Amunts K, Zilles K. A new SPM toolbox for combining probabilistic cytoarchitectonic maps and functional imaging data. NeuroImage. 2005;25:1325–1335. doi: 10.1016/j.neuroimage.2004.12.034. [DOI] [PubMed] [Google Scholar]
- Eickhoff SB, Amunts K, Mohlberg H, Zilles K. The human parietal operculum. II. Stereotaxic maps and correlation with functional imaging results. Cereb Cortex. 2006a;16:268–279. doi: 10.1093/cercor/bhi106. [DOI] [PubMed] [Google Scholar]
- Eickhoff SB, Heim S, Zilles K, Amunts K. Testing anatomically specified hypotheses in functional imaging using cytoarchitectonic maps. NeuroImage. 2006b;32:570–582. doi: 10.1016/j.neuroimage.2006.04.204. [DOI] [PubMed] [Google Scholar]
- Eickhoff SB, Schleicher A, Zilles K, Amunts K. The human parietal operculum. I. Cytoarchitectonic mapping of subdivisions. Cereb Cortex. 2006c;16:254–267. doi: 10.1093/cercor/bhi105. [DOI] [PubMed] [Google Scholar]
- Eickhoff SB, Laird AR, Grefkes C, Wang LE, Zilles K, Fox PT. Coordinate-based activation likelihood estimation meta-analysis of neuroimaging data: a random—effects approach based on empirical estimates of spatial uncertainty. Hum Brain Mapp. 2009;30:2907–2926. doi: 10.1002/hbm.20718. [DOI] [PMC free article] [PubMed] [Google Scholar]
- Eickhoff SB, Jbabdi S, Caspers S, Laird AR, Fox PT, Zilles K, Behrens TE. Anatomical and functional connectivity of cytoarchitectonic areas within the human parietal operculum. J Neurosci. 2010;30:6409–6421. doi: 10.1523/JNEUROSCI.5664-09.2010. [DOI] [PMC free article] [PubMed] [Google Scholar]
- Eickhoff SB, Bzdok D, Laird AR, Kurth F, Fox PT. Activation likelihood estimation meta-analysis revisited. NeuroImage. 2012;59:2349–2361. doi: 10.1016/j.neuroimage.2011.09.017. [DOI] [PMC free article] [PubMed] [Google Scholar]
- Etkin A, Egner T, Kalisch R. Emotional processing in anterior cingulate and medial prefrontal cortex. Trends Cogn Sci. 2011;15:85–93. doi: 10.1016/j.tics.2010.11.004. [DOI] [PMC free article] [PubMed] [Google Scholar]
- Evans AC, Janke AL, Collins DL, Baillet S. Brain templates and atlases. NeuroImage. 2012;62:911–922. doi: 10.1016/j.neuroimage.2012.01.024. [DOI] [PubMed] [Google Scholar]
- Farrell MJ, Laird AR, Egan GF. Brain activity associated with painfully hot stimuli applied to the upper limb: a meta-analysis. Hum Brain Mapp. 2005;25:129–139. doi: 10.1002/hbm.20125. [DOI] [PMC free article] [PubMed] [Google Scholar]
- Fernando AB, Murray JE, Milton AL. The amygdala: securing pleasure and avoiding pain. Front Behav Neurosci. 2013;7:190. doi: 10.3389/fnbeh.2013.00190. [DOI] [PMC free article] [PubMed] [Google Scholar]
- Fiddick L. There is more than the amygdala: potential threat assessment in the cingulate cortex. Neurosci Biobehav Rev. 2011;35:1007–1018. doi: 10.1016/j.neubiorev.2010.09.014. [DOI] [PubMed] [Google Scholar]
- Filippi M, Valsasina P, Misci P, Falini A, Comi G, Rocca MA. The organization of intrinsic brain activity differs between genders: a resting-state fMRI study in a large cohort of young healthy subjects. Hum Brain Mapp. 2013;34:1330–1343. doi: 10.1002/hbm.21514. [DOI] [PMC free article] [PubMed] [Google Scholar]
- Fischl B, Rajendran N, Busa E, Augustinack J, Hinds O, Yeo BT, Mohlberg H, Amunts K, Zilles K. Cortical folding patterns and predicting cytoarchitecture. Cereb Cortex. 2008;18:1973–1980. doi: 10.1093/cercor/bhm225. [DOI] [PMC free article] [PubMed] [Google Scholar]
- Fornito A, Yucel M, Wood SJ, Bechdolf A, Carter S, Adamson C, Velakoulis D, Saling MM, McGorry PD, Pantelis C. Anterior cingulate cortex abnormalities associated with a first psychotic episode in bipolar disorder. Br J Psychiatry. 2009;194:426–433. doi: 10.1192/bjp.bp.107.049205. [DOI] [PubMed] [Google Scholar]
- Fossati P. Neural correlates of emotion processing: from emotional to social brain. Eur Neuropsychopharmacol. 2012;22(Suppl. 3):S487–S491. doi: 10.1016/j.euroneuro.2012.07.008. [DOI] [PubMed] [Google Scholar]
- Fox PT, Friston KJ. Distributed processing; distributed functions? NeuroImage. 2012;61:407–426. doi: 10.1016/j.neuroimage.2011.12.051. [DOI] [PMC free article] [PubMed] [Google Scholar]
- Fox PT, Lancaster JL. Opinion: mapping context and content: the BrainMap model. Nat Rev Neurosci. 2002;3:319–321. doi: 10.1038/nrn789. [DOI] [PubMed] [Google Scholar]
- Freedman LJ, Insel TR, Smith Y. Subcortical projections of area 25 (subgenual cortex) of the macaque monkey. J Comp Neurol. 2000;421:172–188. [PubMed] [Google Scholar]
- Frodl T, Jager M, Born C, Ritter S, Kraft E, Zetzsche T, Bottlender R, Leinsinger G, Reiser M, Moller HJ, Meisenzahl E. Anterior cingulate cortex does not differ between patients with major depression and healthy controls, but relatively large anterior cingulate cortex predicts a good clinical course. Psychiatry Res. 2008;163:76–83. doi: 10.1016/j.pscychresns.2007.04.012. [DOI] [PubMed] [Google Scholar]
- Frot M, Mauguiere F. Dual representation of pain in the operculo-insular cortex in humans. Brain. 2003;126:438–450. doi: 10.1093/brain/awg032. [DOI] [PubMed] [Google Scholar]
- George MS, Ketter TA, Parekh PI, Horwitz B, Herscovitch P, Post RM. Brain activity during transient sadness and happiness in healthy women. Am J Psychiatry. 1995;152:341–351. doi: 10.1176/ajp.152.3.341. [DOI] [PubMed] [Google Scholar]
- Geyer S, Schleicher A, Zilles K. Areas 3a, 3b, and 1 of human primary somatosensory cortex. 1. Microstructural organization and interindividual variability. NeuroImage. 1999;10:63–83. doi: 10.1006/nimg.1999.0440. [DOI] [PubMed] [Google Scholar]
- Geyer S, Schormann T, Mohlberg H, Zilles K. Areas 3a, 3b, and 1 of human primary somatosensory cortex. 2. Spatial normalization to standard anatomical space. NeuroImage. 2000;11:684–696. doi: 10.1006/nimg.2000.0548. [DOI] [PubMed] [Google Scholar]
- Gianaros PJ, Derbyshire SW, May JC, Siegle GJ, Gamalo MA, Jennings JR. Anterior cingulate activity correlates with blood pressure during stress. Psychophysiology. 2005;42:627–635. doi: 10.1111/j.1469-8986.2005.00366.x. [DOI] [PMC free article] [PubMed] [Google Scholar]
- Gittins R, Harrison PJ. A quantitative morphometric study of the human anterior cingulate cortex. Brain Res. 2004;1013:212–222. doi: 10.1016/j.brainres.2004.03.064. [DOI] [PubMed] [Google Scholar]
- Grossman M, Wood W. Sex differences in intensity of emotional experience: a social role interpretation. J Pers Soc Psychol. 1993;65:1010–1022. doi: 10.1037//0022-3514.65.5.1010. [DOI] [PubMed] [Google Scholar]
- Gur RC, Mozley LH, Mozley PD, Resnick SM, Karp JS, Alavi A, Arnold SE, Gur RE. Sex differences in regional cerebral glucose metabolism during a resting state. Science. 1995;267:528–531. doi: 10.1126/science.7824953. [DOI] [PubMed] [Google Scholar]
- Hänggi J, Koeneke S, Bezzola L, Jäncke L. Structural neuroplasticity in the sensorimotor network of professional female ballet dancers. Hum Brain Mapp. 2010;31:1196–1206. doi: 10.1002/hbm.20928. [DOI] [PMC free article] [PubMed] [Google Scholar]
- Henn S, Schormann T, Engler K, Zilles K, Witsch K. Elastische Anpassung in der digitalen Bildverarbeitung auf mehreren Auflösungsstufen mit Hilfe von Mehrgitterverfahren. In: Paulus E, Wahl FM, editors. Mustererkennung. Springer; Wien: 1997. pp. 392–399. [Google Scholar]
- Hömke L. A multigrid method for anisotropic PDE’s in elastic image registration. Numer Linear Algebra Appl. 2006;13:215–229. [Google Scholar]
- Jakobs O, Langner R, Caspers S, Roski C, Cieslik EC, Zilles K, Laird AR, Fox PT, Eickhoff SB. Across-study and within-subject functional connectivity of a right temporo-parietal junction subregion involved in stimulus-context integration. NeuroImage. 2012;60:2389–2398. doi: 10.1016/j.neuroimage.2012.02.037. [DOI] [PMC free article] [PubMed] [Google Scholar]
- Johansen-Berg H, Gutman DA, Behrens TE, Matthews PM, Rushworth MF, Katz E, Lozano AM, Mayberg HS. Anatomical connectivity of the subgenual cingulate region targeted with deep brain stimulation for treatment-resistant depression. Cereb Cortex. 2008;18:1374–1383. doi: 10.1093/cercor/bhm167. [DOI] [PMC free article] [PubMed] [Google Scholar]
- Karama S, Armony J, Beauregard M. Film excerpts shown to specifically elicit various affects lead to overlapping activation foci in a large set of symmetrical brain regions in males. PLoS ONE. 2011;6:e22343. doi: 10.1371/journal.pone.0022343. [DOI] [PMC free article] [PubMed] [Google Scholar]
- Kellermann TS, Caspers S, Fox PT, Zilles K, Roski C, Laird AR, Turetsky BI, Eickhoff SB. Task- and resting-state functional connectivity of brain regions related to affection and susceptible to concurrent cognitive demand. NeuroImage. 2013;72:69–82. doi: 10.1016/j.neuroimage.2013.01.046. [DOI] [PMC free article] [PubMed] [Google Scholar]
- Kimmerly DS, O’Leary DD, Menon RS, Gati JS, Shoemaker JK. Cortical regions associated with autonomic cardiovascular regulation during lower body negative pressure in humans. J Physiol. 2005;569:331–345. doi: 10.1113/jphysiol.2005.091637. [DOI] [PMC free article] [PubMed] [Google Scholar]
- Kohn N, Kellermann T, Gur RC, Schneider F, Habel U. Gender differences in the neural correlates of humor processing: implications for different processing modes. Neuropsychologia. 2011;49:888–897. doi: 10.1016/j.neuropsychologia.2011.02.010. [DOI] [PubMed] [Google Scholar]
- Kong L, Chen K, Womer F, Jiang W, Luo X, Driesen N, Liu J, Blumberg H, Tang Y, Xu K, Wang F. Sex differences of gray matter morphology in corticolimbic–striatal neural system in major depressive disorder. J Psychiatr Res. 2013;47:733–739. doi: 10.1016/j.jpsychires.2013.02.003. [DOI] [PMC free article] [PubMed] [Google Scholar]
- Koo MS, Levitt JJ, Salisbury DF, Nakamura M, Shenton ME, McCarley RW. A cross-sectional and longitudinal magnetic resonance imaging study of cingulate gyrus gray matter volume abnormalities in first-episode schizophrenia and first-episode affective psychosis. Arch Gen Psychiatry. 2008;65:746–760. doi: 10.1001/archpsyc.65.7.746. [DOI] [PMC free article] [PubMed] [Google Scholar]
- Kross E, Davidson M, Weber J, Ochsner K. Coping with emotions past: the neural bases of regulating affect associated with negative autobiographical memories. Biol Psychiatry. 2009;65:361–366. doi: 10.1016/j.biopsych.2008.10.019. [DOI] [PMC free article] [PubMed] [Google Scholar]
- Kurth F, Zilles K, Fox PT, Laird AR, Eickhoff SB. A link between the systems: functional differentiation and integration within the human insula revealed by meta-analysis. Brain Struct Funct. 2010;214:519–534. doi: 10.1007/s00429-010-0255-z. [DOI] [PMC free article] [PubMed] [Google Scholar]
- Labus JS, Naliboff BN, Fallon J, Berman SM, Suyenobu B, Bueller JA, Mandelkern M, Mayer EA. Sex differences in brain activity during aversive visceral stimulation and its expectation in patients with chronic abdominal pain: a network analysis. NeuroImage. 2008;41:1032–1043. doi: 10.1016/j.neuroimage.2008.03.009. [DOI] [PMC free article] [PubMed] [Google Scholar]
- Laird AR, Eickhoff SB, Rottschy C, Bzdok D, Ray KL, Fox PT. Networks of task co-activations. NeuroImage. 2013;80:505–514. doi: 10.1016/j.neuroimage.2013.04.073. [DOI] [PMC free article] [PubMed] [Google Scholar]
- Lebron-Milad K, Milad MR. Sex differences, gonadal hormones and the fear extinction network: implications for anxiety disorders. Biol Mood Anxiety Disord. 2012;2:3. doi: 10.1186/2045-5380-2-3. [DOI] [PMC free article] [PubMed] [Google Scholar]
- Lévesque J, Joanette Y, Mensour B, Beaudoin G, Leroux JM, Bourgouin P, Beauregard M. Neural correlates of sad feelings in healthy girls. Neuroscience. 2003;121:545–551. doi: 10.1016/s0306-4522(03)00528-1. [DOI] [PubMed] [Google Scholar]
- Li HJ, Sun JZ, Zhang QL, Wei DT, Li WF, Jackson T, Hitchman G, Qiu J. Neuroanatomical differences between men and women in help-seeking coping strategy. Sci Rep. 2014;4(5700):1–5. doi: 10.1038/srep05700. [DOI] [PMC free article] [PubMed] [Google Scholar]
- Liao M, Yang F, Zhang Y, He Z, Su L, Li L. Lack of gender effects on gray matter volumes in adolescent generalized anxiety disorder. J Affect Disord. 2014;155:278–282. doi: 10.1016/j.jad.2013.10.049. [DOI] [PubMed] [Google Scholar]
- Linares IM, Trzesniak C, Chagas MH, Hallak JE, Nardi AE, Crippa JA. Neuroimaging in specific phobia disorder: a systematic review of the literature. Rev Bras Psiquiatr. 2012;34:101–111. [PubMed] [Google Scholar]
- Linnman C, Zeidan MA, Furtak SC, Pitman RK, Quirk GJ, Milad MR. Resting amygdala and medial prefrontal metabolism predicts functional activation of the fear extinction circuit. Am J Psychiatry. 2012;169:415–423. doi: 10.1176/appi.ajp.2011.10121780. [DOI] [PMC free article] [PubMed] [Google Scholar]
- Liotti M, Mayberg HS, Brannan SK, McGinnis S, Jerabek P, Fox PT. Differential limbic–cortical correlates of sadness and anxiety in healthy subjects: implications for affective disorders. Biol Psychiatry. 2000;48:30–42. doi: 10.1016/s0006-3223(00)00874-x. [DOI] [PubMed] [Google Scholar]
- Luders E, Toga AW, Thompson PM. Why size matters: differences in brain volume account for apparent sex differences in callosal anatomy: the sexual dimorphism of the corpus callosum. NeuroImage. 2014;84:820–824. doi: 10.1016/j.neuroimage.2013.09.040. [DOI] [PMC free article] [PubMed] [Google Scholar]
- Malykhin NV, Carter R, Hegadoren KM, Seres P, Coupland NJ. Fronto-limbic volumetric changes in major depressive disorder. J Affect Disord. 2012;136:1104–1113. doi: 10.1016/j.jad.2011.10.038. [DOI] [PubMed] [Google Scholar]
- McCabe C, Rolls ET. Umami: a delicious flavor formed by convergence of taste and olfactory pathways in the human brain. Eur J Neurosci. 2007;25:1855–1864. doi: 10.1111/j.1460-9568.2007.05445.x. [DOI] [PubMed] [Google Scholar]
- Mechias ML, Etkin A, Kalisch R. A meta-analysis of instructed fear studies: implications for conscious appraisal of threat. NeuroImage. 2010;49:1760–1768. doi: 10.1016/j.neuroimage.2009.09.040. [DOI] [PubMed] [Google Scholar]
- Merker B. Silver staining of cell bodies by means of physical development. J Neurosci Methods. 1983;9:235–241. doi: 10.1016/0165-0270(83)90086-9. [DOI] [PubMed] [Google Scholar]
- Mohlberg H, Eickhoff S, Schleicher A, Zilles K, Amunts K. A New Processing Pipeline and Release of Cytoarchitectonic Probabilistic Maps — JuBrain. 2012:798. [Google Scholar]
- Neafsey EJ, Terreberry RR, Hurley KM, Ruit KG, Frysztak RJ. Anterior cingulate cortex in rodents: connections, visceral control functions, and implications for emotion. In: Kolb B, Tees RC, editors. The Cerebral Cortex of the Rat. MIT; Cambridge, MA: 1993. pp. 206–223. [Google Scholar]
- Palomero-Gallagher N, Mohlberg H, Zilles K, Vogt BA. Cytology and receptor architecture of human anterior cingulate cortex. J Comp Neurol. 2008;508:906–926. doi: 10.1002/cne.21684. [DOI] [PMC free article] [PubMed] [Google Scholar]
- Perlaki G, Orsi G, Plozer E, Altbacker A, Darnai G, Nagy SA, Horvath R, Toth A, Doczi T, Kovacs N, Bogner P, Schwarcz A, Janszky J. Are there any gender differences in the hippocampus volume after head-size correction? A volumetric and voxel-based morphometric study. Neurosci Lett. 2014;570:119–123. doi: 10.1016/j.neulet.2014.04.013. [DOI] [PubMed] [Google Scholar]
- Phan KL, Wager T, Taylor SF, Liberzon I. Functional neuroanatomy of emotion: a meta-analysis of emotion activation studies in PET and fMRI. NeuroImage. 2002;16:331–348. doi: 10.1006/nimg.2002.1087. [DOI] [PubMed] [Google Scholar]
- Price DD. Psychological and neural mechanisms of the affective dimension of pain. Science. 2000;288:1769–1772. doi: 10.1126/science.288.5472.1769. [DOI] [PubMed] [Google Scholar]
- Rolls ET. Functional neuroimaging of umami taste: what makes umami pleasant? Am J Clin Nutr. 2009;90:804S–813S. doi: 10.3945/ajcn.2009.27462R. [DOI] [PubMed] [Google Scholar]
- Rottschy C, Caspers S, Roski C, Reetz K, Dogan I, Schulz JB, Zilles K, Laird AR, Fox PT, Eickhoff SB. Differentiated parietal connectivity of frontal regions for “what” and “where” memory. Brain Struct Funct. 2013;218:1551–1567. doi: 10.1007/s00429-012-0476-4. [DOI] [PMC free article] [PubMed] [Google Scholar]
- Schleicher A, Palomero-Gallagher N, Morosan P, Eickhoff SB, Kowalski T, de Vos K, Amunts K, Zilles K. Quantitative architectural analysis: a new approach to cortical mapping. Anat Embryol. 2005;210:373–386. doi: 10.1007/s00429-005-0028-2. [DOI] [PubMed] [Google Scholar]
- Seeley WW, Menon V, Schatzberg AF, Keller J, Glover GH, Kenna H, Reiss AL, Greicius MD. Dissociable intrinsic connectivity networks for salience processing and executive control. J Neurosci. 2007;27:2349–2356. doi: 10.1523/JNEUROSCI.5587-06.2007. [DOI] [PMC free article] [PubMed] [Google Scholar]
- Shin LM, Liberzon I. The neurocircuitry of fear, stress, and anxiety disorders. Neuropsychopharmacology. 2010;35:169–191. doi: 10.1038/npp.2009.83. [DOI] [PMC free article] [PubMed] [Google Scholar]
- Small DM. Flavor is in the brain. Physiol Behav. 2012;107:540–552. doi: 10.1016/j.physbeh.2012.04.011. [DOI] [PubMed] [Google Scholar]
- Smith R, Fadok RA, Purcell M, Liu S, Stonnington C, Spetzler RF, Baxter LC. Localizing sadness activation within the subgenual cingulate in individuals: a novel functional MRI paradigm for detecting individual differences in the neural circuitry underlying depression. Brain Imaging Behav. 2011;5:229–239. doi: 10.1007/s11682-011-9127-2. [DOI] [PubMed] [Google Scholar]
- Takagishi M, Chiba T. Efferent projections of the infralimbic (area 25) region of the medial prefrontal cortex in the rat: an anterograde tracer PHA-L study. Brain Res. 1991;566:26–39. doi: 10.1016/0006-8993(91)91677-s. [DOI] [PubMed] [Google Scholar]
- Toyoda H, Li XY, Wu LJ, Zhao MG, Descalzi G, Chen T, Koga K, Zhuo M. Interplay of amygdala and cingulate plasticity in emotional fear. Neural Plast. 2011;2011:813749. doi: 10.1155/2011/813749. [DOI] [PMC free article] [PubMed] [Google Scholar]
- Treede RD, Apkarian AV, Bromm B, Greenspan JD, Lenz FA. Cortical representation of pain: functional characterization of nociceptive areas near the lateral sulcus. Pain. 2000;87:113–119. doi: 10.1016/S0304-3959(00)00350-X. [DOI] [PubMed] [Google Scholar]
- Turkeltaub PE, Eickhoff SB, Laird AR, Fox M, Wiener M, Fox P. Minimizing within-experiment and within-group effects in Activation Likelihood Estimation meta-analyses. Hum Brain Mapp. 2012;33:1–13. doi: 10.1002/hbm.21186. [DOI] [PMC free article] [PubMed] [Google Scholar]
- Vogt BA. Pain and emotion interactions in subregions of the cingulate gyrus. Nat Rev Neurosci. 2005;6:533–544. doi: 10.1038/nrn1704. [DOI] [PMC free article] [PubMed] [Google Scholar]
- Vogt BA, Pandya DN. Cingulate cortex of the rhesus monkey: II. Cortical afferents. J Comp Neurol. 1987;262:271–289. doi: 10.1002/cne.902620208. [DOI] [PubMed] [Google Scholar]
- Vogt BA, Vogt L, Perl DP, Hof PR. Cytology of human caudomedial cingulate, retrosplenial, and caudal parahippocampal cortices. J Comp Neurol. 2001;438:353–376. doi: 10.1002/cne.1320. [DOI] [PubMed] [Google Scholar]
- Vogt BA, Vogt L, Laureys S. Cytology and functionally correlated circuits of human posterior cingulate areas. NeuroImage. 2006;29:452–466. doi: 10.1016/j.neuroimage.2005.07.048. [DOI] [PMC free article] [PubMed] [Google Scholar]
- Wager TD, Phan KL, Liberzon I, Taylor SF. Valence, gender, and lateralization of functional brain anatomy in emotion: a meta-analysis of findings from neuroimaging. NeuroImage. 2003;19:513–531. doi: 10.1016/s1053-8119(03)00078-8. [DOI] [PubMed] [Google Scholar]
- Weiner KS, Golarai G, Caspers J, Chuapoco MR, Mohlberg H, Zilles K, Amunts K, Grill-Spector K. The mid-fusiform sulcus: a landmark identifying both cytoarchitectonic and functional divisions of human ventral temporal cortex. NeuroImage. 2014;84:453–465. doi: 10.1016/j.neuroimage.2013.08.068. [DOI] [PMC free article] [PubMed] [Google Scholar]
- Wong SW, Masse N, Kimmerly DS, Menon RS, Shoemaker JK. Ventral medial prefrontal cortex and cardiovagal control in conscious humans. NeuroImage. 2007;35:698–708. doi: 10.1016/j.neuroimage.2006.12.027. [DOI] [PubMed] [Google Scholar]
- Yucel K, McKinnon M, Chahal R, Taylor V, Macdonald K, Joffe R, MacQueen G. Increased subgenual prefrontal cortex size in remitted patients with major depressive disorder. Psychiatry Res Neuroimaging. 2009;173:71–76. doi: 10.1016/j.pscychresns.2008.07.013. [DOI] [PubMed] [Google Scholar]
- Zetzsche T, Preuss U, Frodl T, Watz D, Schmitt G, Koutsouleris N, Born C, Reiser M, Moller HJ, Meisenzahl EM. In-vivo topography of structural alterations of the anterior cingulate in patients with schizophrenia: new findings and comparison with the literature. Schizophr Res. 2007;96:34–45. doi: 10.1016/j.schres.2007.07.027. [DOI] [PubMed] [Google Scholar]
- Zilles K, Schleicher A, Palomero-Gallagher N, Amunts K. Quantitative analysis of cyto- and receptorarchitecture of the human brain. In: Toga AW, Mazziotta JC, editors. Brain Mapping: The Methods. 2nd ed. Elsevier; Amsterdam: 2002. pp. 573–602. [Google Scholar]
Associated Data
This section collects any data citations, data availability statements, or supplementary materials included in this article.