

Abstract
Purpose
Digitally reconstructed radiographs (DRRs) are routinely used as an a priori reference for setup correction in radiotherapy. The spatial resolution of DRRs may be improved to reduce setup error in fractionated radiotherapy treatment protocols. The influence of finer CT slice thickness reconstruction (STR) and resultant increased resolution DRRs on physician setup accuracy was prospectively evaluated.
Methods
Four head and neck patient CT-simulation images were acquired and used to create DRR cohorts by varying STRs at 0.5, 1, 2, 2.5, and 3 mm. DRRs were displaced relative to a fixed isocenter using 0–5 mm random shifts in the three cardinal axes. Physician observers reviewed DRRs of varying STRs and displacements and then aligned reference and test DRRs replicating daily KV imaging workflow. A total of 1,064 images were reviewed by four blinded physicians. Observer errors were analyzed using nonparametric statistics (Friedman’s test) to determine whether STR cohorts had detectably different displacement profiles. Post hoc bootstrap resampling was applied to evaluate potential generalizability.
Results
The observer-based trial revealed a statistically significant difference between cohort means for observer displacement vector error (p = 0.02) and for Z-axis (p < 0.01). Bootstrap analysis suggests a 15% gain in isocenter translational setup error with reduction of STR from 3 mm to ≤2 mm, though interobserver variance was a larger feature than STR-associated measurement variance.
Conclusions
Higher resolution DRRs generated using finer CT scan STR resulted in improved observer performance at shift detection and could decrease operator-dependent geometric error. Ideally, CT STRs ≤2 mm should be utilized for DRR generation in the head and break neck.
Keywords: Image-guided radiotherapy, Quality assurance, IGRT, Setup error, Image informatics
Introduction
In the era of intensity modulated radiotherapy, sharp dosimetric gradients provide an avenue for dose reduction to adjacent non-target organs at risk while maintaining tumoricidal doses to clinical target volumes (CTVs). However, these sharp gradients raise the potential for geometric miss of viable tumor cells should insufficient appreciation of potential setup error lead to suboptimal planning target volume (PTV) margination [1]. Image-guided radiotherapy (IGRT) provides a mechanism to reduce PTV margins by assuring reliable mitigation of setup error [2]. Nonetheless, despite widespread implementation [3], quality assurance/quality improvement assessments of image-guidance systems may often be overlooked [4]. As distinct IGRT systems may provide distinct data distributions with regard to setup error [5], aggressive efforts at optimizing not only image acquisitions, but also optimizing human performance in radiotherapy tasks is a critical consideration [6].
Specifically, kilovoltage orthogonal X-rays are frequently utilized for operator-determined assessment of setup shift for head and neck radiotherapy [7]. The typical system utilizes digital reconstructed radiographs (DRRs) derived from helical computed tomography (CT) as a reference “gold-standard” (Fig. 1). However, while considerable efforts have been made to evaluate kilovoltage portal imaging [8–10], few reports address the fact that the reference DRR image must likewise be optimized [11] (Fig. 2). Conceivably, if image quality of “gold-standard” reference could be improved, portal radiography might be potentially improved.
Fig. 1.
Screen capture of typical clinical display of anteroposterior projection DRR (left) and kilovoltage X-ray for alignment verification (Mosaiq, Elekta AB, Stockholm, SE)
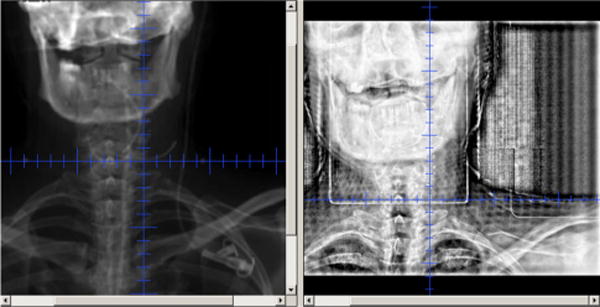
Fig. 2.

Screen capture of implemented DRR tasks, showing unmodified 0.5-mm STR (left) and 3-mm STR (right) in the utilized IGRT software (Mosaiq, Elekta AB, Stockholm, SE)
Observing, subjectively, that more finely reconstructed DRRs appeared clearer, and bony landmarks appeared subjectively more identifiable, we sought to determine, in a prospective study, the relative potential benefit of high-resolution DRRs as an input for kilovoltage portal imaging using human performance assessment with the aim of optimizing DRR input quality.
To this end, we undertook the following specific aims:
Evaluation of the relative difference in human performance associated with DRR resolution for manual alignment assessment using a known rigid translation as a comparator
Identification of the optimal level of reconstruction resolution in head and neck for institutional use
Methods and materials
Our project received IRB approval and complied with all HIPAA requirements. A series of four patient CT simulations were performed using (AcqSim, Koninklijke Philips Electronics NV, Eindhoven, NL) using (Phillips Brilliance 64 slice CT settings: 120 kVp, matrix size 512 × 512 with 35 cm field of view, tube current 297 mA, helical acquisition). All patients had T1-2 N2b supraglottic or tonsillar cancers. We used the minimum manufacturer supplied nominal STR reconstruction, which was 0.5 mm. DRR calculation grid size was performed with a 512 × 512 matrix, 8-bit pixel depth, using a ray casting algorithm. The CT scan was subsequently reconstructed with the following axial slice thickness reconstruction (STR): 0.5, 1, 2, 2.5, and 3 mm, and anonymized. Anonymized files were imported into a commercial treatment planning system (Pinnacle v8, Koninklijke Philips Electronics NV, Eindhoven, NL), an isocenter defined, and “reference” DRRs created for anteroposterior and lateral projections. Test DRRs were manually translated with random shifts in the X, Y, and Z directions relative to the isocenter, with fixed magnitudes ranging between 0–5 mm. Reference DRR images were created from the same CT images using the 3 mm slice thickness to eliminate other variables interfering with the study hypothesis.
Reference DRRs and test DRRs were loaded into a commercial record and verify system (RV) system (Mosaiq, Elekta AB, Stockholm, SE), and the IGRT modules were used to display the images side by side (Fig. 2). Four (4) radiation oncologists observers consisting of attendings and residents who regularly review DRR images as part of their practice, blinded as to the X/Y/Z translations, were allowed to visually inspect and recommend fixed X/Y/Z alignments for each paired STR DRR projection set in 1 mm increments. All relevant reviewing parameters (filter, window and level, graticule, annotation, etc.) were set as per institutional standard and adjusted per observer preference. Observers were not allowed to use any automated tools as this would invalidate the test of STR on human performance. Users were asked to view no more than ten paired (i.e., anteroposterior/lateral) projection sets at a sitting to prevent fatigue. The design sought to emulate the current practice workflow where physicians review KV IGRT images prior to the next days treatment. As we sought to isolate the impact of a single index variable (image STR) on observer performance in a setting approximating normal physician workflow, the current analysis did not account for unidentified covariates (e.g., monitor calibration, physician reported fatigue, number of non-protocol images aligned daily, physician experience level). Our data contained repeated (i.e., at least five replicate) assessments of identical “repeat” offset images, with images shown in random order to physicians.
Statistical analysis was powered to detect a vector displacement difference between slice thickness reconstruction cohort using parametric statistics (e.g., ANOVA, t test); however, non-normally distributed data necessitated use of nonparametric statistics. Pre-experimental power and sample size calculations were powered to detect a vector displacement difference between slice thickness reconstruction cohorts for X/Y/Z vector displacement, assuming an α = 0.05, exploratory 1 − β = 0.8, with 50 repeated images evaluated by each observer in five reconstruction groups (i.e., 250 images total), in order to reliably detect a small effect size (Cohen’s d = 0.2). In the absence of any extant data regarding interobserver kV X-ray interobserver variability, we estimated effect size based on the method described by Cohen [12], who denoted effect sizes with Cohen’s d (i.e., maximum difference in categorical means divided by the pooled standard deviation of measures) “small, d = 0.2,” “medium, d = 0.5,” and “large, d = 0.8.” Experimental sample size estimation was performed using G*Power 3 software [13] (http://www.psycho.uni-duesseldorf.de/abteilungen/aap/gpower3). Since nonparametric equivalent tests (e.g., Friedman’s test for ANOVA, Wilcoxon for t tests) were used after study completion, based on observed non-normality of distributions by the Shapiro–Wilks test [14], post-experimental confirmation of effect sizes was performed using the nonparametric test with the same software, with a minimum asymptotic relative effectiveness specification of 0.864 compared to the equivalent parametric test [15].
Comparison of potential improvement in setup error reduction was evaluated using Friedman’s test [16] (the nonparametric equivalent to a matched pair ANOVA) to determine whether a differential in distribution could be observed between STR cohorts. If Friedman’s test was statistically significant, serial matched pair Wilcoxon tests [17] were performed to further differentiate STR rank-order differences. Equality of variance was tested using the Brown–Forsythe test [18], as it is comparatively impervious to deviations from the normal distribution [19]. Interobserver effects were similarly investigated using the Wilcoxon rank sum test, stratifying by observer.
In order to estimate robust effect size of potential three-dimensional observer error attributable to STR with sufficient granularity, as well as to assess the proportional variance contribution from interobserver error through variance component estimation, a post hoc bootstrap resampling with 10,000 replicates per STR cohort (e.g., 0.5, 1, 2, 2.5, and 3 mm STR) was performed using the initial 1,064 images and stratified by observer. The resultant 50,000 distributions, with stratification variables (observer, STR), were assessed though means testing using Tukey’s HSD evaluation to compare differences between cohorts.
Post hoc variance component estimation was performed on the resampled population as a crossed variable linear mixed effect model, using restricted maximum likelihood (REML) methodology, specifying observer and STR as both independent and interacting variables, as per Reece [20].
Statistical assessment was performed using JMP 11Pro (SAS Institute, Cary, NC, USA), SPSS 19.0 (IBM SPSS Statistics, Armon, NY, USA), and StataMP 13.1 (Stata Corp., College Station, TX, USA).
Results
A total of 1,064 images were reviewed by four users, consisting of 266 distinct paired DRR image sets. Mean±SD observer error (i.e., the absolute magnitude difference in mm between the known shift and the observer suggested shift) for all users for each reconstruction thickness is reported in Table 1 and graphically in Fig. 3. Freidman’s test revealed a statistically significant omnibus distributional difference between STR cohorts for total X/Y/Z vector displacement error (p = 0.02), and for Z-axis (p =0.02, X-axis (p = 0.065), and Y -axis (0.153) (Table 1).
Table 1.
Mean±SD (in mm) observer error (i.e., difference between known and suggested displacement) for all users by axis and vector and stratified by STR cohort (*primary study endpoint for a priori sample size calculation)
| Axis | All cohorts | 0.5 mm | 1 mm | 2 mm | 2.5 mm | 3 mm | p < 0.05 |
|---|---|---|---|---|---|---|---|
| X | 0.40 ± 0.61 | 0.36 ± 0.54 | 0.39 ± 0.58 | 0.39 ± 0.57 | 0.48 ± 0.74 | 0.38 ± 0.57 | n.s. |
| Y | 0.47 ± 0.57 | 0.48 ± 0.56 | 0.42 ± 0.56 | 0.44 ± 0.56 | 0.49 ± 0.55 | 0.54 ± 0.63 | n.s. |
| Z | 0.48 ± 0.61 | 0.40 ± 0.50 | 0.42 ± 0.63 | 0.45 ± 0.57 | 0.40 ± 0.64 | 0.62 ± 0.63 | <0.001 |
| Vector | 1.05 ± 0.75 | 0.98 ± 0.64 | 0.98 ± 0.78 | 1.00 ± 0.72 | 1.14 ± 0.81 | 1.16 ± 0.76 | <0.01* |
Fig. 3.

Boxplot of X-axis, Y -axis, and Z axis distributions of observer error (i.e., absolute value of difference between known and observer-reported displacement), by STR cohort; mean is shown by green line, with error bars representing 95% CI of mean; exterior blue ticks indicate standard deviation
Post hoc experimental power analysis for Freidman’s test for 3D observer error (X/Y/Z vector) was performed given 1,064 image sets, observed within group dispersion (σ) of 0.74 mm, and observed between group dispersion (δ) of 0.08 mm. Consequently, our protocol achieved a power (1 − β) of 0.8, at a p value threshold (α) of <0.05, with a calculated Cohen’s d = 0.24 (with maximum difference in categorical means of 0.18 mm, and pooled standard of 0.75) for the experimental dataset, nearly approximating our pre-experimental power–sample estimates (Table 2).
Table 2.
Difference matrix of mean vector (X/Y/Z) error difference by STR cohort; paired means which are statistically significant at the p < 0.05 level are indicated by an asterisk
| Mean vector error difference [meanx−meany] (mm)
|
|||||
|---|---|---|---|---|---|
| 3 mm | 2.5 mm | 2 mm | 1 mm | 0.5 mm | |
| 3 mm | – | 0.02 | 0.15* | 0.18* | 0.18* |
| 2.5 mm | −0.02 | – | 0.14 | 0.16* | 0.16* |
| 2 mm | −0.15* | −0.14 | – | 0.02 | 0.02 |
| 1 mm | −0.18* | −0.16* | −0.02 | – | −0.00 |
| 0.5 mm | −0.18* | −0.16* | −0.02 | 0.00 | – |
Wilcoxon rank sum assessment revealed that differences were most pronounced for comparisons between ≥2.5 mm and 0.5–1.0-mm STR cohorts in the X/Y/Z vector and Z-axis within the experimental dataset, suggesting minimal differences in observer error between 0.5–2.0 mm STR. Brown– Forsythe assessment revealed no difference in error variance between X-axis, Y -axis, nor X/Y/Z vector, (p > 0.05); however, observer error variance was distinct between STR cohorts for the Z-axis (p = 0.04).
Interobserver analysis of experimental data revealed a statistically significant difference between observers (p < 0.01) for all axes and X/Y/Z vector displacement; one observer demonstrated a distinct performance profile, with singularly lower mean and higher standard deviation compared to other users (Fig. 4).
Fig. 4.

Quartile boxplot showing 95% CI of mean (green diamond), mean (green line), and SD (blue lines) of observer error, by observer
In order to estimate robust effect size of potential three-dimensional observer error attributable to STR granularity, a post hoc bootstrap resampling with 10,000 replicates per STR cohort (e.g., 0.5-, 1-, 2-, 2.5-, and 3-mm STR) was performed using the initial 1,064 images. The subsequent 50,000 distributions were assessed though means testing using Tukey’s HSD evaluation to compare between cohorts (Supplemental Figure 1). There was no statistically significant bootstrapped three-dimensional observer error mean difference between the 0.5-mm, 1-mm, and 2-mm STR cohorts; however, statistically significant differentials were observed when comparing 3-mm and 2.5-mm cohorts to those with STR of <2 mm. Bootstrap analysis suggests that the majority of performance gain might be realized in reducing STR from 3 to 2 mm and is primarily in the Z-axis (Supplemental Figure 2).
Additionally, we sought to ascertain, in our resampled (bootstrapped) population (n = 50,000), an estimate of the relative variance attributable to observer/STR interactions. REML analysis was performed, stratifiying by observer and STR using a crossed variable design. REML analysis revealed observer variance of 44% of observed measurement system variation, STR variance 7.1%, observer/STR crossed effects at 20.4%, and within-system variance of 22.3% (summing to 100% cumulative measurement system variance).
Discussion
The widespread use of IGRT systems belies the fact that, in many cases, the reference DRRs are infrequently optimized with regard to image quality. As, when using DRRs as a reference set for kilovoltage imaging, the resolution (in lp/mm) of DRRs routinely is less than that of a high-quality radiograph [7], and this may be exacerbated by poor physics modeling of kVp X-ray physics. In the era of megavoltage portal radiography, then, DRRs were not the limiting factor; however, kilovoltage X-ray imaging resolution of bony landmarks routinely exceeds that of typical DRRs. Further, while software has shown DRRs to be quite geometrically reliable [11], DRR resolution is limited by the voxel size reconstruction of the acquired CT [7]. Our data suggest that this limitation may be mitigated by finer STR, resulting in detectably improved observer alignment error reduction.
Our data suggest that STR can detectably alter observer performance of DRR bony alignment tasks in the head and neck region, with smaller STR resulting in reduced observer error (Table 1). Furthermore, a STR of 0.5 mm performed demonstrably better in terms of observer error variance reduction (Fig. 3). Consequently, we recommend considering of utilization of smaller DRR voxel reconstructions be implemented when utilizing 2D–2D kilovoltage imaging systems. Our data suggest that while interobserver error was least with 0.5 mm STR (Fig. 3), the use of DRRs in the 0.5–2-mm range resulted in non-significant mean differences in experimental observer error. Consequently, while 0.5 mm was the optimal tested STR in this series, conceivably, up to 2 mm, STR could be used with limited clinically evident differential in observer performance.
Additionally, our data appear to suggest that improvement in alignment tasks was most notable in the Z-axis [craniocaudal; (See Supplemental Figure 2)]. Conceptually, since STR results in reduction of Z-axis voxel size, this effect is not unexpected. However, the magnitude of Z-axis DRR alignment error reduction suggest that in scenarios where craniocaudal alignment (e.g., skull base tumors) is of critical import, finer DRR reconstruction may be warranted.
Our data also showed a surprising difference between a single observer’s error distribution, and those of the other users. A single observer (designated user 2) showed, perplexingly, lower mean error, with a larger standard deviation compared to colleagues (Fig. 4). This observation serves as a reminder of the inherent operator dependence of current IGRT systems. Furthermore, our data, limited as it was by sampled operator experience (e.g., two attending head and neck specialist radiation oncologists with 10 and 8 years of experience, a PGY-5 resident, and a PGY-6 fellow), may not necessarily reflect the image–alignment capacity of all radiation oncologists, precluding over-generalization of the current observations. Conceivably, the use of automated registration algorithms [21] could perform with lower variability and potentially, improved error distribution profiles; however, the current implementation of automated or semi-automated registration remains a research effort rather than a realized reality.
Nonetheless, this protocol represents the first, to our knowledge, prospective systematic assessment of human observer alignment task performance improvement by DRR quality alteration. Our number of observers (n = 4) was limited; however, our use of paired replicates provides statistical robustness. In an effort to characterize “best- case” performance of DRR alignment, we opted to use a known translated DRR as a comparator; “real-life” operator performance on DRR kV X-ray matching could be different. For example, our data fail to account for bony articular motion, or the fact that setup error in head and neck (even when using bony landmarks) may present differential regional setup variation distributions [22], depending on the landmark of interest [23]. By limiting our alignments to isocentric offsets, we utilized an artificial manual registration task; likely, the true observer error in practice is larger than that reflected in the current report. Consequently, consideration of IGRT observer bias is a necessary consideration for IGRT platform selection and margination protocols [6].
Admittedly, the relative magnitude of likely observer error reduction (<1 mm) may lead some to conclude that more granular STR is of limited interest. However, finer STR acquisition requires no additional equipment, no increase in patient dose, and adds neither observer (physician) nor physicist effort. Finer STR reconstruction also has relatively few negative features in terms of workflow. While there is a small increase in the data storage required (minimal relative to modern PACS capabilities), and a minor time increase in the computational digital reconstruction, it is almost axiomatic that, when possible, better image quality is preferable clinically. The gain in performance associated with reduced STR from 3 to ≤2 mm STR, for instance, would improve translational setup localization by 15% (supplemental Figure 1) with no significant effort.
In conclusion, our prospective assessment of the role of CT slice thickness reconstruction on operator performance for DRR alignment in the head and neck, in an idealized simulation of kv IGRT systems utilizing four blinded radiation oncologists, demonstrated reducing slice thickness to 0.5–2.0 mm decreased physician error. This reduced error could, conceivably, translate into reduced probability of a geometric miss. In situations where the patient longitudinal axis is of primary importance, our results suggest using a slice thickness of 0.5 mm will be optimum. Our data confirm that the reliability of IGRT continues to have detectable user dependencies. Finally, these improvements in accuracy entail only minor costs in time or resources and can be easily instituted into clinics using 2D–2D KV image verification.
Supplementary Material
Acknowledgments
This work was supported in part by National Institutes of Health Cancer Center Support (Core) Grant CA016672 to The University of Texas MD Anderson Cancer Center. Clifton Fuller received/receives Grant support from the SWOG/Hope Foundation Dr. Charles A. Coltman, Jr., Fellowship in Clinical Trials, the National Institutes of Health Paul Calabresi Clinical Oncology Award (5K12 CA088084-14) and Clinician Scientist Loan Repayment Program (L30 CA136381-02), Elekta AB (Stockholm, SE), the Center for Radiation Oncology Research at MD Anderson Cancer Center, and the MD Anderson Institutional Research Grant Program. These listed funders/supporters played no role in the study design, collection, analysis, interpretation of data, manuscript writing, or decision to submit the report for publication.
Footnotes
Conflict of interest: Jared D. Sturgeon, John A. Cox, Lauren L. Mayo, G. Brandon Gunn, Lifei Zhang, Peter A. Balter, Lei Dong, Musaddiq Awan, Esengul Kocak-Uzel, Abdallah Sherif Radwan Mohamed, David I. Rosenthal, and Clifton David Fuller declare that they have no conflict of interest.
Electronic supplementary material: The online version of this article (doi:10.1007/s11548-014-1127-4) contains supplementary material, which is available to authorized users.
Contributor Information
Jared D. Sturgeon, Department of Radiation Oncology, The University of Texas MD Anderson Cancer Center, 1515 Holcombe Blvd., Unit 97, Houston, TX 77030, USA Department of Radiation Oncology, The University of Texas Medical Branch, Galveston, TX, USA.
John A. Cox, Department of Radiation Oncology, The University of Texas Medical Branch, Galveston, TX, USA Department of Radiation Oncology, Indiana University School of Medicine, Indianapolis, IN, USA.
Lauren L. Mayo, Department of Radiation Oncology, The University of Texas Medical Branch, Galveston, TX, USA
G. Brandon Gunn, Department of Radiation Oncology, The University of Texas MD Anderson Cancer Center, 1515 Holcombe Blvd., Unit 97, Houston, TX 77030, USA.
Lifei Zhang, Department of Radiation Oncology, The University of Texas MD Anderson Cancer Center, 1515 Holcombe Blvd., Unit 97, Houston, TX 77030, USA.
Peter A. Balter, Department of Radiation Oncology, The University of Texas MD Anderson Cancer Center, 1515 Holcombe Blvd., Unit 97, Houston, TX 77030, USA The University of Texas Graduate School of Biomedical Sciences, Houston, TX, USA.
Lei Dong, Scripps Proton Therapy Center, San Diego, CA, USA.
Musaddiq Awan, Department of Radiation Oncology, The University of Texas MD Anderson Cancer Center, 1515 Holcombe Blvd., Unit 97, Houston, TX 77030, USA.
Esengul Kocak-Uzel, Department of Radiation Oncology, The University of Texas MD Anderson Cancer Center, 1515 Holcombe Blvd., Unit 97, Houston, TX 77030, USA; Department of Radiation Oncology, Şişli Etfal Teaching and Research Hospital, Istanbul, Turkey.
Abdallah Sherif Radwan Mohamed, Department of Radiation Oncology, The University of Texas MD Anderson Cancer Center, 1515 Holcombe Blvd., Unit 97, Houston, TX 77030, USA; Department of Clinical Oncology and Nuclear Medicine, Faculty of Medicine, Alexandria University, Alexandria, Egypt.
David I. Rosenthal, Department of Radiation Oncology, The University of Texas MD Anderson Cancer Center, 1515 Holcombe Blvd., Unit 97, Houston, TX 77030, USA
Clifton David Fuller, Email: cdfuller@mdanderson.org, Department of Radiation Oncology, The University of Texas MD Anderson Cancer Center, 1515 Holcombe Blvd., Unit 97, Houston, TX 77030, USA; The University of Texas Graduate School of Biomedical Sciences, Houston, TX, USA.
References
- 1.van Herk M. Errors and margins in radiotherapy. Semin Radiat Oncol. 2004;14(1):52–64. doi: 10.1053/j.semradonc.2003.10.003. [DOI] [PubMed] [Google Scholar]
- 2.Chen AM, Farwell DG, Luu Q, Donald PJ, Perks J, Purdy JA. Evaluation of the planning target volume in the treatment of head and neck cancer with intensity-modulated radiotherapy: what is the appropriate expansion margin in the setting of daily image guidance? Int J Radiat Oncol Biol Phys. 2011;81(4):943–949. doi: 10.1016/j.ijrobp.2010.07.017. [DOI] [PubMed] [Google Scholar]
- 3.Simpson DR, Lawson JD, Nath SK, Rose BS, Mundt AJ, Mell LK. A survey of image-guided radiation therapy use in the United States. Cancer. 2010;116(16):3953–3960. doi: 10.1002/cncr.25129. [DOI] [PMC free article] [PubMed] [Google Scholar]
- 4.Serago CF, Buskirk SJ, Igel TC, Gale AA, Serago NE, Earle JD. Comparison of daily megavoltage electronic portal imaging or kilovoltage imaging with marker seeds to ultrasound imaging or skin marks for prostate localization and treatment positioning in patients with prostate cancer. Int J Radiat Oncol Biol Phys. 2006;65(5):1585–1592. doi: 10.1016/j.ijrobp.2006.04.019. [DOI] [PubMed] [Google Scholar]
- 5.Fuller CD, Scarbrough TJ, Sonke JJ, Rasch CR, Choi M, Ting JY, Wang SJ, Papanikolaou N, Rosenthal DI. Method comparison of automated matching software-assisted cone-beam CT and stereoscopic kilovoltage x-ray positional verification image-guided radiation therapy for head and neck cancer: a prospective analysis. Phys Med Biol. 2009;54(24):7401–7415. doi: 10.1088/0031-9155/54/24/010. [DOI] [PMC free article] [PubMed] [Google Scholar]
- 6.Gill S, Thomas J, Fox C, Kron T, Thompson A, Chander S, Williams S, Tai KH, Duchesne G, Foroudi F. Electronic portal imaging vs kilovoltage imaging in fiducial marker image-guided radiotherapy for prostate cancer: an analysis of set-up uncertainties. Br J Radiol. 2012;85(1010):176–182. doi: 10.1259/bjr/13553326. [DOI] [PMC free article] [PubMed] [Google Scholar]
- 7.Galvin JM, Sims C, Dominiak G, Cooper JS. The use of digitally reconstructed radiographs for three-dimensional treatment planning and CT-simulation. Int J Radiat Oncol Biol Phys. 1995;31(4):935–942. doi: 10.1016/0360-3016(94)00503-6. [DOI] [PubMed] [Google Scholar]
- 8.Kang H, Lovelock DM, Yorke ED, Kriminski S, Lee N, Amols HI. Accurate positioning for head and neck cancer patients using 2D and 3D image guidance. J Appl Clin Med Phys. 2011;12(1):3270. doi: 10.1120/jacmp.v12i1.3270. [DOI] [PMC free article] [PubMed] [Google Scholar]
- 9.Palombarini M, Mengoli S, Fantazzini P, Cadioli C, Degli Esposti C, Frezza GP. Analysis of inter-fraction setup errors and organ motion by daily kilovoltage cone beam computed tomography in intensity modulated radiotherapy of prostate cancer. Radiat Oncol. 2012;7(1):56. doi: 10.1186/1748-717X-7-56. [DOI] [PMC free article] [PubMed] [Google Scholar]
- 10.Russo GA, Qureshi MM, Truong MT, Hirsch AE, Orlina L, Bohrs H, Clancy P, Willins J, Kachnic LA. Daily orthogonal kilovoltage imaging using a gantry-mounted on-board imaging system results in a reduction in radiation therapy delivery errors. Int J Radiat Oncol Biol Phys. 2012;84(3):596–601. doi: 10.1016/j.ijrobp.2012.01.033. [DOI] [PubMed] [Google Scholar]
- 11.Pallotta S, Bucciolini M. A simple method to test the geometrical reliability of digital reconstructed radiograph (DRR) J Appl Clin Med Phys. 2010;11(1):3128. doi: 10.1120/jacmp.v11i1.3128. [DOI] [PMC free article] [PubMed] [Google Scholar]
- 12.Cohen J. Statistical power analysis for the behavioral sciences. 2nd. L. Erlbaum Associates; Hillsdale: 1988. [Google Scholar]
- 13.Faul F, Erdfelder E, Lang AG, Buchner A. G*Power 3: a flexible statistical power analysis program for the social, behavioral, and biomedical sciences. Behav Res Methods. 2007;39(2):175–191. doi: 10.3758/Bf03193146. [DOI] [PubMed] [Google Scholar]
- 14.Shapiro SS, Wilk MB. An analysis of variance test for normality (complete samples) Biometrika. 1965;52:591. doi: 10.2307/2333709. [DOI] [Google Scholar]
- 15.Feustal EA, Davisson LD. Asymptotic relative efficiency of mixed statistical tests. IEEE Trans Inf Theory. 1967;13(2):247. doi: 10.1109/Tit.1967.1053980. [DOI] [Google Scholar]
- 16.Friedman M. The use of ranks to avoid the assumption of normality implicit in the analysis of variance. J Am Stat Assoc. 1937;32(200):675–701. doi: 10.2307/2279372. [DOI] [Google Scholar]
- 17.Wilcoxon F. Individual comparisons by ranking methods. Biom Bull. 1945;1(6):80–83. doi: 10.2307/3001968?ref=search-gateway:5782ff2ca47afd3c584def4008d48a96. [DOI] [Google Scholar]
- 18.Brown MB, Forsythe AB. Robust tests for the equality of variances. J Am Stat Assoc. 1974;69(346):364–367. doi: 10.1080/01621459.1974.10482955. [DOI] [Google Scholar]
- 19.Iachine I, Petersen HC, Kyvik KO. Robust tests for the equality of variances for clustered data. J Stat Comput Sim. 2010;80(4):365–377. doi: 10.1080/00949650802641841. [DOI] [Google Scholar]
- 20.Reece JE. Measurement, analysis, and control using JMP: quality techniques for manufacturing. SAS Press, SAS Institute; Cary: 2007. [Google Scholar]
- 21.Sharma SD, Dongre P, Mhatre V, Heigrujam M. Evaluation of automated image registration algorithm for image-guided radiotherapy (IGRT) Australas Phys Eng Sci Med. 2012;35(3):311–319. doi: 10.1007/s13246-012-0158-9. [DOI] [PubMed] [Google Scholar]
- 22.Yang J, Garden AS, Zhang Y, Zhang L, Dong L. Variable planning margin approach to account for locoregional variations in setup uncertainties. Med Phys. 2012;39(8):5136–5144. doi: 10.1118/1.4737891. [DOI] [PMC free article] [PubMed] [Google Scholar]
- 23.van Kranen S, van Beek S, Rasch C, van Herk M, Sonke JJ. Setup uncertainties of anatomical sub-regions in head-and-neck cancer patients after offline CBCT guidance. Int J Radiat Oncol Biol Phys. 2009;73(5):1566–1573. doi: 10.1016/j.ijrobp.2008.11.035. [DOI] [PubMed] [Google Scholar]
Associated Data
This section collects any data citations, data availability statements, or supplementary materials included in this article.