

Summary
Forced overexpression and/or downregulation of proteins regulating epithelial-to-mesenchymal transition (EMT) has been reported to alter metastasis by changing migration and stem cell capacity of tumor cells. However, these manipulations artificially keep cells in fixed states, while in vivo cells may adapt transient and reversible states. Here, we have tested the existence and role of epithelial-mesenchymal plasticity in metastasis of mammary tumors without artificially modifying EMT regulators. In these tumors, we found by intravital microscopy that the motile tumor cells have undergone EMT, while their epithelial counterparts were not migratory. Moreover, we found that epithelial-mesenchymal plasticity renders any EMT-induced stemness differences, as reported previously, irrelevant for metastatic outgrowth, because mesenchymal cells that arrive at secondary sites convert to the epithelial state within one or two divisions, thereby obtaining the same stem cell potential as their arrived epithelial counterparts. We conclude that epithelial-mesenchymal plasticity supports migration but additionally eliminates stemness-enhanced metastatic outgrowth differences.
Keywords: cancer, epithelial-to-mesenchymal transition (EMT), intravital microscopy
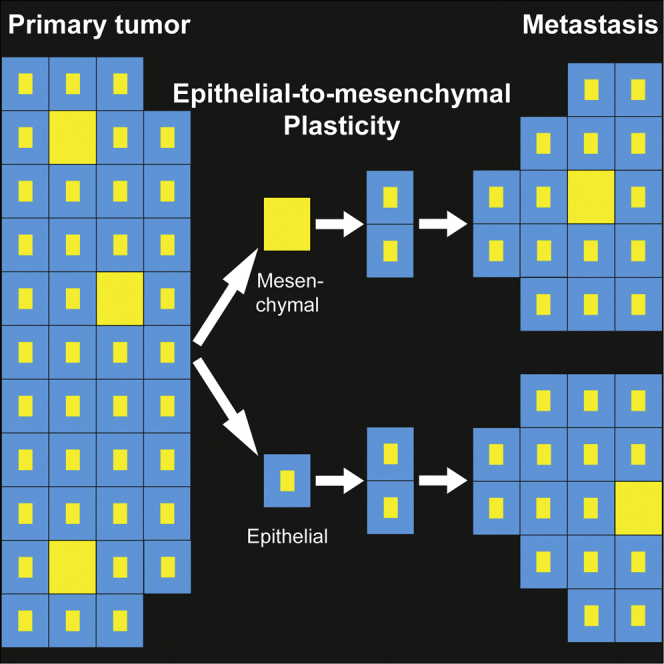
Graphical Abstract
Highlights
-
•
Direct evidence of EMT obtained in unperturbed breast tumors by real-time visualization
-
•
EMT exists in breast tumors without experimentally altering EMT inducers
-
•
Tumor cells that underwent EMT are the migratory cells within a tumor
-
•
Outgrowth potential differences between states are irrelevant due to plasticity
Beerling et al. identified a previously undetectable pool of cells in epithelial breast tumors that have undergone EMT without experimental induction. These cells are motile when disseminating and revert back to the epithelial state upon metastatic outgrowth. This epithelial-mesenchymal plasticity equalizes metastatic outgrowth potential between epithelial and mesenchymal tumor cells.
Introduction
Metastatic growth is the major cause of cancer-associated mortality. To successfully grow metastases, epithelial tumor cells need to acquire invasive properties to disseminate and stem cell properties to grow new tumors at distant sites (Hanahan and Weinberg, 2011). Metastasizing cancer cells have been suggested to hijack a developmental program named epithelial-to-mesenchymal transition (EMT) (Bill and Christofori, 2015, Kalluri and Weinberg, 2009, Lim and Thiery, 2012). During developmental EMT, cells lose cell-cell contacts and concomitantly decrease the expression of the epithelial adherens junction molecule E-cadherin (E-cad) and gain expression of proteins involved in, e.g., invasion and stemness (Kalluri and Weinberg, 2009, Lim and Thiery, 2012, Thiery and Sleeman, 2006).
The effect of EMT on stemness, as well as the role and even the very existence of EMT during metastasis, are heavily debated (Del Pozo Martin et al., 2015, Fischer et al., 2015, Zheng et al., 2015). For example, contradicting findings were published on the stem cell potential of tumor cells with an epithelial or mesenchymal state. Some studies found that EMT-inducing transcription factors, such as Twist, coincide with the acquisition of stem cell properties, thereby supporting metastatic growth (Mani et al., 2008, Morel et al., 2008, Wellner et al., 2009, Yang et al., 2004). Other studies found that a forced reversion to an epithelial state through Twist knockdown leads to metastasis-initiating abilities (Ocaña et al., 2012, Tsai et al., 2012). Importantly, both experimental approaches may not represent the true in vivo status of cells because they require gene manipulations that artificially force cells into fixed states, while in vivo cells may be able to transiently and reversibly switch between states, a process that from here on is referred to as epithelial-mesenchymal plasticity. Moreover, the non-physiological overexpression or complete loss of EMT-regulators, such as Twist1, may induce expression profiles and subsequently stem cell phenotypes that do not exist under physiological conditions. Finally, EMT regulators can have oncogenic functions independently of their ability to induce EMT, thus observed phenotypes that result from gene manipulation may not be exclusively due to EMT induction (Beck et al., 2015). These data and concerns illustrate the importance of studying EMT in non-manipulated in vivo settings.
Although EMT would best be studied in the physiological in vivo settings, non-experimentally induced EMT during metastasis has yet to be observed. For example, extensive histological examination of human invasive ductal mammary carcinomas shows that, even in tumors that have metastasized, tumor cells in the primary tumor, as well as the metastases, display an epithelial phenotype (e.g., Bukholm et al., 2000, Jeschke et al., 2007, Kowalski et al., 2003). This means that either EMT does not exist when it is not experimentally induced or EMT remains undetected in these static images because only a small population of cells temporarily adapts a mesenchymal state. Therefore, in addition to the development of models in which EMT can occur without modifying EMT-regulators, techniques are required that are able to reveal and study the potentially rare and undetectable pool of cells going through EMT.
Here, we combine high-resolution intravital imaging, single-cell sequencing, and transplantation techniques to investigate the role of EMT and epithelial-mesenchymal plasticity in metastasis of invasive ductal carcinomas. Our data suggest that epithelial-mesenchymal plasticity supports tumor cell migration and causes metastasis-enhancing stem cell capacity differences between epithelial and mesenchymal states to be irrelevant.
Results and Discussion
To determine whether EMT occurs without artificial induction, we used polyomavirus middle T antigen (PyMT) mice that develop ductal mammary carcinomas that recapitulate the progression of human mammary adenoma to late carcinoma stages and metastasize primarily to lymph nodes, lungs, and, occasionally, liver (Guy et al., 1992, Lin et al., 2003, Welm et al., 2007). Similar to human ductal carcinomas, these mammary tumors highly express E-cad, even in the late carcinoma stage and metastases (Figure 1A). To visualize EMT in vivo, we crossed these MMTV-PyMT mice with MMTV-Cre and R26R-loxP-stop-loxP-YFP (R26R-YFP) mice (Srinivas et al., 2001) to specifically label all tumor cells with yellow fluorescent protein (YFP). Next, we crossed these animals with E-cad-mCFP mice in which a monomeric cyan fluorescent protein (mCFP) is fused to endogenous E-cad (Snippert et al., 2010), in order to label all endogenous E-cad with mCFP (Figure 1B). The resultant MMTV-PyMT; MMTV-Cre; R26R-YFP; E-cad-mCFP animals develop ductal mammary tumors and metastases in which all tumor cells are YFP-labeled and endogenous E-cad is tagged with mCFP (Figure 1C). Microscopic inspection (Figure 1C) and flow cytometry (Figure S1) of these fluorescent tumors showed that the vast majority of cells appear to have high levels of membrane-localized E-cad (E-cadHI cells).
Figure 1.

Development of a Fluorescent Mouse Model for Metastatic E-cad-Positive Invasive Ductal Carcinomas
(A) Human invasive ductal carcinoma (upper) and a late-stage MMTV-PyMT tumor (lower), stained for E-cad and counterstained with H&E. Scale bar, 30 μm.
(B) Schematic representation of the fluorescent mouse model in which all tumor cells express YFP and in which the endogenous E-cad is labeled with CFP. The western blot shows wild-type and CFP-tagged E-cad.
(C) Multi-photon images of fluorescent PyMT mammary tumors. Scale bars, 30 μm.
To test whether these tumors also contain a population of tumor cells that have undergone EMT in which E-cad is not functional by either downregulation of the expression or by decreasing membrane-localized E-cad, we dissociated fluorescent PyMT tumors and exposed the extracellular domain of E-cad to a fluorescently labeled antibody. We sorted YFP-expressing tumor cells, excluding, for example, lymphocytes (see Figure S1). In contrast to analysis of histological images, careful analysis of the flow cytometry data showed that in addition to the population of E-cadHI tumor cells another, much smaller population of tumor cells could be found. In this population the expression of E-cad-mCFP was low and/or E-cad was non-functional due to intracellular localization as determined by low extracellular antibody staining (E-cadLO; Figure S1B). Western blot analysis confirmed that E-cadLO cells have low levels of E-CAD and a concomitant upregulation of VIMENTIN (Figure 2A), which is consistent with mesenchymal characteristics (Kalluri and Weinberg, 2009). Moreover, using mRNA deep sequencing, we observed differential expression in the E-cadHI and E-cadLO cells of typical EMT genes, such as Vimentin, Fibronectin, and N-cadherin, and transcription factors that regulate EMT, including Snail, Slug, Twist, ZEB1, and ZEB2, referred to as the E-cadLO gene set (Figures 2B and 2C; Table S1). These results were confirmed by qPCR (Figures 2C and S2A).
Figure 2.

Rare E-cadLO Cells Isolated from Mouse Invasive Ductal Carcinomas Have Undergone EMT
(A) Western blot of indicated samples. n = 3 mice.
(B) Scatterplot showing expression values for E-cadHI and E-cadLO cells. Red dots that are encircled in red represent genes that are significantly upregulated in E-cadLO cells (q value < 0.01).
(C) The relative mRNA expression of EMT-related genes determined by RNA sequencing (RNA-seq) and RT. n = 4 mice, except for ZEB1, where n = 3 mice.
(D) T-distributed stochastic neighbor embedding (t-SNE) plot. Using unsupervised K-medoids clustering, two separate clusters were identified indicated as squares and triangles that overlap with E-cadHI (blue) and E-cadLO (red) tumor cells.
(E) t-SNE intensity plot for genes differentially upregulated in (B).
Related to Figures S1, S2, and S3 and Table S1.
These data show that in our system E-cad status can be used to distinguish between epithelial and mesenchymal phenotypes on the population level. To test whether this holds true at the single-cell level, we performed single-cell mRNA sequencing of 72 E-cadHI and 25 E-cadLO cells. When performing unsupervised K-medoids clustering of the individual expression profiles, two separate clusters were identified that overlapped with the E-cadHI and E-cadLO cells (Figure 2D; p < 1−8). The single E-cadLO cells had higher expression of the E-cadLO gene set from the bulk sequencing data, confirming the mesenchymal identity of the E-cadLO cells on the single-cell level (Figure 2E; t test p < 1−4; Figures S2B and S2C). Furthermore, E-cadLO and E-cadHI cells clustered separately in a heatmap (Figure S2D), and we observed that the expression profiles of E-cadHI cells were more similar to each other (Pearson correlation of 0.45) than to the profiles of E-cadLO cells (Pearson correlation of 0.35, Wilcoxon two-sided test = p < 10−15; Figures 2D and S2D). Collectively, these data show that in PyMT tumors at the single-cell level that E-cad status can be used to discriminate between cells with epithelial and mesenchymal features.
Next, we tested whether human tumors also contain E-cadLO cells. As a first indication, we found that the E-cadLO gene set (marked with red dots in Figure 2B) is upregulated in human cells in which EMT is induced upon E-cad knockdown or expression of dominant-negative E-cad (Onder et al., 2008) (Figure 3A, p < 0.0001 hypergeometric test). Next, we obtained tumors directly after patients underwent mastectomy and selected four tumors that stained positive for E-cad on histological sections (Figure 3B). We dissociated the tumors into single cells, stained the cells with DAPI to exclude apoptotic cells, EpCAM to select for tumor cells (Yu et al., 2013), and E-cad to distinguish between E-cadHI and E-cadLO cells. By flow cytometry we indeed detected both E-cadHI and E-cadLO cells (Figure 3B). To test whether human E-cadLO and mouse E-cadLO cells are similar, we used a recently published dataset of gene expression in epithelial- and mesenchymal-circulating tumor cells (CTCs) from breast cancer patients (Yu et al., 2013). Importantly, the mouse E-cadLO gene set was also upregulated in the human mesenchymal CTCs, but not in the human epithelial CTCs or in healthy blood specimens (Figure 3C). Combined, these results show that we have identified a subpopulation of mouse tumor cells (E-cadLO) that is similar to that of human mesenchymal CTCs.
Figure 3.

E-cadLO Cells Are Similar to Human Mesenchymal Tumor Cells
(A) From a published dataset (Onder et al., 2008), the expression level in human mammary epithelial cells (HMLE) of the human orthologs of the mouse E-cadLO gene set in Figure 2B was retrieved. Differential expression levels per gene as the deviation of the median across all experiments are shown.
(B) The image shows an E-cad+ human invasive ductal carcinoma, and the graph shows the percentage of E-cadHI and E-cadLO cells (n = 4 tumors). Scale bar, 20 μm.
(C) From published RNA-seq experiments of human breast cancer CTCs (Yu et al., 2013), the relative expression levels of human-mouse orthologs were retrieved. Plots show the average differential expression found in the Yu et al. (2013) dataset for the E-cadLO-upregulated (red bars) or non-upregulated genes (black bars). Expression levels for circulating cells were determined for blood draws from ten healthy donors (left two bars), four blood draws from one patient with CTCs with an epithelial phenotype (middle two bars), and one of the same patient with CTCs with a mesenchymal phenotype (right two bars).
Since tumors are genetically very heterogeneous, the E-cadLO CTCs from breast cancer patients and from our mouse model may either adapt a permanent mesenchymal state by, e.g., mutations in EMT-regulators, or represent a transient reversible mesenchymal state. To test whether the mesenchymal state is reversible, we first generated organoids from the MMTV-PyMT; MMTV-Cre; R26R-YFP; E-cad-mCFP carcinomas. We stimulated these organoids with transforming growth factor beta (TGF-beta) and hepatocyte growth factor (HGF) and indeed observed an increase in the number of E-cadLO cells (Figure S3A), showing that the mesenchymal state of E-cadLO cells can be stimulated. This state can also be lost, since orthotopic transplantation of E-cadLO cells always resulted in mammary tumors containing tumor cells with a predominantly epithelial phenotype as indicated by E-cad expression (Figure S3B). This reversibility is not necessarily dependent on cell division, since sorted E-cadLO cells plated into a 3D matrix and stained with a CellTracker dye to visualize cell division, reverted to an epithelial state both before (Figure S3C, upper) and after cell division (Figure S3C, lower). Combined, these results show that the mesenchymal state of E-cadLO cells is plastic and can be gained and lost by tumor cells.
Similar to previously identified invasive signatures of tumor cells (Wang et al., 2004, Wang et al., 2007), many categories of E-cadLO gene set were related to tissue development, morphogenesis, migration, and adhesion (Figures S3D–S3F). This result prompted us to visualize the behavior of these E-cadHI and E-cadLO tumor cells in vivo using multi-photon microscopy. To exclude YFP expression in non-epithelial lineages, tumors were imaged that developed upon transplantation of E-cadHI tumor cells into the mammary glands of wild-type mice (Figure 4A). In addition to endogenous mCFP-labeled E-cad and YFP, we visualized type I collagen by imaging the second harmonic generation signal. As reported previously (Wyckoff et al., 2007), we found that the migratory behavior of tumor cells in these genetic PyMT tumors is very heterogeneous: while no migratory cells were found in the majority of imaging fields (Figure 4B; Movie S1), we found many migratory cells in some imaging fields (Figure 4C; Movie S2; in Figure S4A we demonstrate that cell motility is not due to Z-drift of the focal plane). The tumor cells migrated either individually or as streams in which single cells appeared to follow each other’s migration path (Figure 4C), as has been demonstrated before in other tumor models (Patsialou et al., 2013, Roussos et al., 2011), but collective migration of cohesive epithelial clusters was not observed in this model. While on average E-cadHI cells were non-motile, the rare E-cadLO cells were either protruding or displaying migratory behavior (Figure 4D). These migratory E-cadLO cells do not relate to the CK14-positive cells (Figures S4B and S4C) that lead collective migration in organoids (Cheung et al., 2013). Collectively, our data show that E-cadLO cells represent a rare population of motile cells that have undergone spontaneous EMT without experimental induction, within otherwise non-motile epithelial tumors.
Figure 4.

Behavioral Characterization of Rare E-cadLO Tumor Cells in Mouse Mammary Carcinomas that Highly Express E-cad
(A) Cartoon of the experimental setup.
(B and C) Intravital images of PyMT tumors containing non-motile (B) and migratory (C) tumor cells. The rectangular box highlights migrating E-cadLO cells. Scale bars, 50 μm.
(D) The percentage of protruding (left) and motile cells (right) plotted against E-cad status. Red lines indicate the median. The graph represents data from imaging fields with moving cells (11 out of 45 imaging fields from four mice, where symbols represent different mice).
Since we found that the small population of migratory cells in tumors has undergone EMT, we questioned whether these tumor cells enter the circulation in this mesenchymal state only or whether they can revert and/or enter in an epithelial state. Despite a large variation between mice regarding the total number of CTCs and the percentage of E-cadHI and E-cadLO CTCs, both types of CTCs were present in the blood of tumor-bearing MMTV-PyMT mice (Figure 5A). Next, we tested whether the E-cadLO-circulating tumor cells show the same expression profile as the E-cadLO tumor cells in the primary tumor. We performed single-cell sequencing and observed that the circulating E-cadLO and E-cadHI cells cluster into two populations and that the circulating E-cadLO cells show the same expression profile as the primary E-cadLO tumor cells (Figures S5A and S5B). Since in this mouse model tumor cells do not stay long enough in the circulation to switch to another state (99.99% of IV-injected tumor cells get cleared from circulation within 30 s [Figure S5C]), we can conclude from our data that disseminating tumor cells that enter the circulation are in a mesenchymal, but also an epithelial, state.
Figure 5.

Epithelial-Mesenchymal Plasticity Renders Potential Stem Cell Differences Irrelevant for Metastatic Outgrowth
(A) The percentage of E-cadLO- and E-cadHI-circulating tumor cells. n = 13 mice.
(B) Representative images of single E-cadLO and E-cadHI cells and a multi-cellular metastasis in the lung. White rectangle highlights single cells. Scale bars, 20 μm.
(C) Percentages of E-cadLO and E-cadHI tumor cells in blood and lungs. Blood: n = 13 mice; lungs: n = 143 metastases in 16 mice.
(D) Representative images of liver metastases grown from E-cadHI cells (left) and E-cadLO cells (right). Scale bars, 40 μm.
(E) Table indicating the metastatic outgrowth potential of E-cadLO and E-cadHI cells. Tumor-initiating cell frequency as tested by the Elda-limiting dilution test: E-cadHI cells 1/21,228; E-cadLO cells 1/17,545, p = 0.82.
Related to Figure S5.
Next, we investigated the epithelial and mesenchymal state of endogenous spontaneous metastases to the lung. In line with the percentages of E-cadHI and E-cadLO cells in the blood, 40% of single metastasized tumor cells appeared to be E-cadHI cells, and 60% were E-cadLO cells (Figures 5B and 5C). In contrast to findings in prior studies in which EMT was induced (Stoletov et al., 2010), our data suggest that naturally occurring EMT does not influence the arrival and extravasation of the CTCs at the site of metastatic outgrowth. To investigate the cells that grow out to metastases, we examined endogenous metastases with a size of two and more than three cells. Although 20% of the two-cell micrometastases were E-cad negative, all metastases larger than three cells were E-cad positive (Figures 5C and 5D).
Since our histological analysis shows that all metastases larger than three cells contain E-cadHI cells, we hypothesized that either only E-cadHI cells are able to grow metastases or E-cadLO cells convert to an epithelial state during the first cell divisions. Interestingly, E-cadHI and E-cadLO cells do not differ in their proliferative capacity (Figures S5D and S5E). To further test the impact of each state, and especially epithelial-mesenchymal plasticity, on metastatic potential, we investigated the ability of E-cadHI and E-cadLO cells to initiate liver metastases. In contrast to previous reports with fixed states (Fantozzi et al., 2014, Ocaña et al., 2012, Shibue and Weinberg, 2009, Shibue and Weinberg, 2011, Tsai et al., 2012), the potential to grow metastases from plastic E-cadHI cells and E-cadLO cells is approximately equal (Figure 5E). The outgrowth of epithelial metastases from the E-cadLO cells strongly suggest that at least a significant fraction of the spontaneous metastases as found in Figure 5B are grown from mesenchymal E-cadLO cells that have converted to an epithelial state during the first few cell divisions. Considering all these data together, we conclude that, although intrinsically epithelial and mesenchymal cells may differ in their stem cell potential, this difference does not provide a large metastatic outgrowth advantage as mesenchymal cells adapt an epithelial state after the first few cell divisions, thereby abolishing any potential initial differences in stem cell properties.
Collectively, our data provide evidence for the existence of EMT in vivo without experimentally altering EMT-inducers. Artificial interference of EMT regulators does not reflect the moderate fluctuations of expression levels that occurs under physiological conditions and therefore is likely to lead to more extreme phenotypes. Moreover, these manipulations artificially keep cells in fixed states, whereas we here show that cells adapt transient and reversible states. Our data support the notion that temporal acquisition of the mesenchymal state is important for migration, but not for entering the circulation. We observed that mesenchymal cells that arrive at the secondary site adapt an epithelial state after a few cell divisions. These cells therefore acquire the same stemness properties as their epithelial counterparts. Thus, due to epithelial-mesenchymal plasticity, any differences in stemness between epithelial and mesenchymal states will be lost and become irrelevant for metastatic outgrowth. In conclusion, we have demonstrated plasticity between epithelial and mesenchymal states, thereby ruling out a critical role for differential stemness capacities and ultimately the potential to grow metastases.
Experimental Procedures
Mice
All experiments were carried out in accordance with the guidelines of the Animal Welfare Committee of the Royal Netherlands Academy of Arts and Sciences, the Netherlands. For more details, see the Supplemental Experimental Procedures.
Human Material
Human tissues were obtained in compliance with Dutch law that does not require informed consent when leftover materials are used anonymously.
Flow Cytometry on Mouse Material
After putting cells through a 70-μm strainer cap (BD Falcon), cells were sorted on a fluorescence-activated cell sorting AriaII special-ordered research product (BD Biosciences). The sort strategy is illustrated in Figure S1B. For more details, see the Supplemental Experimental Procedures.
Intravital Imaging
Imaging was performed on an inverted Leica TCS SP5 AOBS multi-photon microscope with a chameleon Ti:Sapphire pumped Optical Parametric Oscillator (Coherent). For more details, see the Supplemental Experimental Procedures.
Author Contributions
E.B., D.S., N.V., and J.v.R. designed the experiments. E.B., D.S., C.M., R.S., and P.v.D. performed the experiments. E.B., D.S., and N.V. analyzed the data. E.d.W. analyzed the mRNA deep-sequencing data. L.K. performed single-cell sequencing experiments. A.v.O. and L.K. analyzed the single-cell sequencing experiments. D.v.d.V., P.v.D., and E.V. helped to obtain patient material. E.B., D.S., E.d.W., N.V., and J.v.R. wrote the manuscript. J.v.R. conceived of the conceptual ideas and supervised the study.
Acknowledgments
We would like to thank Anko de Graaff, Stefan van der Elst, Reinier van der Linden, and Rinske Drost for technical assistance, Hans Clevers and Hugo Snippert for mice, and the NKI/AVL Core Facility Molecular Pathology & Biobanking (CFMPB) of the NKI/AVL Biobank for material and lab support. This work was supported by NWO (91710330, 700.10.402, 175.010.2007.00, and 834.11.002), ERC (648804), and KWF (HUBR 2009-4621).
Published: March 3, 2016
Footnotes
This is an open access article under the CC BY-NC-ND license (http://creativecommons.org/licenses/by-nc-nd/4.0/).
Supplemental Information includes Supplemental Experimental Procedures, five figures, one table, and two movies and can be found with this article online at http://dx.doi.org/10.1016/j.celrep.2016.02.034.
Contributor Information
Nienke Vrisekoop, Email: n.vrisekoop@umcutrecht.nl.
Jacco van Rheenen, Email: j.vanrheenen@hubrecht.eu.
Accession Numbers
The accession number for the mRNA sequencing data reported in this paper has been uploaded to European Nucleotide Archive: PRJEB5939. The accession number for the single-cell mRNA sequencing data reported in this paper has been uploaded to GEO: GSE77107.
Supplemental Information
The supplemental table contains a list of the genes that were differentially upregulated in the E-cadLO gene set.
All tumor cells express YFP and fusion protein of mCFP to the endogenous E-cad. Shown are the separate channels for CFP (E-cad-mCFP, left), YFP (YFP, middle) and the merged images (Merge, right). The still images of this video are shown in Figure 4B. Scale bars, 50 μm.
All tumor cells express YFP and fusion protein of mCFP to the endogenous E-cad. Shown are the separate channels for CFP (E-cad-mCFP, left), YFP (YFP, middle) and the merged images (Merge, right). The still images of this video are shown in Figure 4C. Scale bars, 50 μm.
References
- Beck B., Lapouge G., Rorive S., Drogat B., Desaedelaere K., Delafaille S., Dubois C., Salmon I., Willekens K., Marine J.C., Blanpain C. Different levels of Twist1 regulate skin tumor initiation, stemness, and progression. Cell Stem Cell. 2015;16:67–79. doi: 10.1016/j.stem.2014.12.002. [DOI] [PubMed] [Google Scholar]
- Bill R., Christofori G. The relevance of EMT in breast cancer metastasis: correlation or causality? FEBS Lett. 2015;589:1577–1587. doi: 10.1016/j.febslet.2015.05.002. [DOI] [PubMed] [Google Scholar]
- Bukholm I.K., Nesland J.M., Børresen-Dale A.L. Re-expression of E-cadherin, alpha-catenin and beta-catenin, but not of gamma-catenin, in metastatic tissue from breast cancer patients [seecomments] J. Pathol. 2000;190:15–19. doi: 10.1002/(SICI)1096-9896(200001)190:1<15::AID-PATH489>3.0.CO;2-L. [DOI] [PubMed] [Google Scholar]
- Cheung K.J., Gabrielson E., Werb Z., Ewald A.J. Collective invasion in breast cancer requires a conserved basal epithelial program. Cell. 2013;155:1639–1651. doi: 10.1016/j.cell.2013.11.029. [DOI] [PMC free article] [PubMed] [Google Scholar]
- Del Pozo Martin Y., Park D., Ramachandran A., Ombrato L., Calvo F., Chakravarty P., Spencer-Dene B., Derzsi S., Hill C.S., Sahai E., Malanchi I. Mesenchymal cancer cell-stroma crosstalk promotes niche activation, epithelial reversion, and metastatic colonization. Cell Rep. 2015;13:2456–2469. doi: 10.1016/j.celrep.2015.11.025. [DOI] [PMC free article] [PubMed] [Google Scholar]
- Fantozzi A., Gruber D.C., Pisarsky L., Heck C., Kunita A., Yilmaz M., Meyer-Schaller N., Cornille K., Hopfer U., Bentires-Alj M., Christofori G. VEGF-mediated angiogenesis links EMT-induced cancer stemness to tumor initiation. Cancer Res. 2014;74:1566–1575. doi: 10.1158/0008-5472.CAN-13-1641. [DOI] [PubMed] [Google Scholar]
- Fischer K.R., Durrans A., Lee S., Sheng J., Li F., Wong S.T., Choi H., El Rayes T., Ryu S., Troeger J. Epithelial-to-mesenchymal transition is not required for lung metastasis but contributes to chemoresistance. Nature. 2015;527:472–476. doi: 10.1038/nature15748. [DOI] [PMC free article] [PubMed] [Google Scholar]
- Guy C.T., Cardiff R.D., Muller W.J. Induction of mammary tumors by expression of polyomavirus middle T oncogene: a transgenic mouse model for metastatic disease. Mol. Cell. Biol. 1992;12:954–961. doi: 10.1128/mcb.12.3.954. [DOI] [PMC free article] [PubMed] [Google Scholar]
- Hanahan D., Weinberg R.A. Hallmarks of cancer: the next generation. Cell. 2011;144:646–674. doi: 10.1016/j.cell.2011.02.013. [DOI] [PubMed] [Google Scholar]
- Jeschke U., Mylonas I., Kuhn C., Shabani N., Kunert-Keil C., Schindlbeck C., Gerber B., Friese K. Expression of E-cadherin in human ductal breast cancer carcinoma in situ, invasive carcinomas, their lymph node metastases, their distant metastases, carcinomas with recurrence and in recurrence. Anticancer Res. 2007;27(4A):1969–1974. [PubMed] [Google Scholar]
- Kalluri R., Weinberg R.A. The basics of epithelial-mesenchymal transition. J. Clin. Invest. 2009;119:1420–1428. doi: 10.1172/JCI39104. [DOI] [PMC free article] [PubMed] [Google Scholar]
- Kowalski P.J., Rubin M.A., Kleer C.G. E-cadherin expression in primary carcinomas of the breast and its distant metastases. Breast Cancer Res. 2003;5:R217–R222. doi: 10.1186/bcr651. [DOI] [PMC free article] [PubMed] [Google Scholar]
- Lim J., Thiery J.P. Epithelial-mesenchymal transitions: insights from development. Development. 2012;139:3471–3486. doi: 10.1242/dev.071209. [DOI] [PubMed] [Google Scholar]
- Lin E.Y., Jones J.G., Li P., Zhu L., Whitney K.D., Muller W.J., Pollard J.W. Progression to malignancy in the polyoma middle T oncoprotein mouse breast cancer model provides a reliable model for human diseases. Am. J. Pathol. 2003;163:2113–2126. doi: 10.1016/S0002-9440(10)63568-7. [DOI] [PMC free article] [PubMed] [Google Scholar]
- Mani S.A., Guo W., Liao M.J., Eaton E.N., Ayyanan A., Zhou A.Y., Brooks M., Reinhard F., Zhang C.C., Shipitsin M. The epithelial-mesenchymal transition generates cells with properties of stem cells. Cell. 2008;133:704–715. doi: 10.1016/j.cell.2008.03.027. [DOI] [PMC free article] [PubMed] [Google Scholar]
- Morel A.P., Lièvre M., Thomas C., Hinkal G., Ansieau S., Puisieux A. Generation of breast cancer stem cells through epithelial-mesenchymal transition. PLoS ONE. 2008;3:e2888. doi: 10.1371/journal.pone.0002888. [DOI] [PMC free article] [PubMed] [Google Scholar]
- Ocaña O.H., Córcoles R., Fabra A., Moreno-Bueno G., Acloque H., Vega S., Barrallo-Gimeno A., Cano A., Nieto M.A. Metastatic colonization requires the repression of the epithelial-mesenchymal transition inducer Prrx1. Cancer Cell. 2012;22:709–724. doi: 10.1016/j.ccr.2012.10.012. [DOI] [PubMed] [Google Scholar]
- Onder T.T., Gupta P.B., Mani S.A., Yang J., Lander E.S., Weinberg R.A. Loss of E-cadherin promotes metastasis via multiple downstream transcriptional pathways. Cancer Res. 2008;68:3645–3654. doi: 10.1158/0008-5472.CAN-07-2938. [DOI] [PubMed] [Google Scholar]
- Patsialou A., Bravo-Cordero J.J., Wang Y., Entenberg D., Liu H., Clarke M., Condeelis J.S. Intravital multiphoton imaging reveals multicellular streaming as a crucial component of in vivo cell migration in human breast tumors. Intravital. 2013;2:e25294. doi: 10.4161/intv.25294. [DOI] [PMC free article] [PubMed] [Google Scholar]
- Roussos E.T., Balsamo M., Alford S.K., Wyckoff J.B., Gligorijevic B., Wang Y., Pozzuto M., Stobezki R., Goswami S., Segall J.E. Mena invasive (MenaINV) promotes multicellular streaming motility and transendothelial migration in a mouse model of breast cancer. J. Cell Sci. 2011;124:2120–2131. doi: 10.1242/jcs.086231. [DOI] [PMC free article] [PubMed] [Google Scholar]
- Shibue T., Weinberg R.A. Integrin beta1-focal adhesion kinase signaling directs the proliferation of metastatic cancer cells disseminated in the lungs. Proc. Natl. Acad. Sci. USA. 2009;106:10290–10295. doi: 10.1073/pnas.0904227106. [DOI] [PMC free article] [PubMed] [Google Scholar]
- Shibue T., Weinberg R.A. Metastatic colonization: settlement, adaptation and propagation of tumor cells in a foreign tissue environment. Semin. Cancer Biol. 2011;21:99–106. doi: 10.1016/j.semcancer.2010.12.003. [DOI] [PubMed] [Google Scholar]
- Snippert H.J., van der Flier L.G., Sato T., van Es J.H., van den Born M., Kroon-Veenboer C., Barker N., Klein A.M., van Rheenen J., Simons B.D., Clevers H. Intestinal crypt homeostasis results from neutral competition between symmetrically dividing Lgr5 stem cells. Cell. 2010;143:134–144. doi: 10.1016/j.cell.2010.09.016. [DOI] [PubMed] [Google Scholar]
- Srinivas S., Watanabe T., Lin C.S., William C.M., Tanabe Y., Jessell T.M., Costantini F. Cre reporter strains produced by targeted insertion of EYFP and ECFP into the ROSA26 locus. BMC Dev. Biol. 2001;1:4. doi: 10.1186/1471-213X-1-4. [DOI] [PMC free article] [PubMed] [Google Scholar]
- Stoletov K., Kato H., Zardouzian E., Kelber J., Yang J., Shattil S., Klemke R. Visualizing extravasation dynamics of metastatic tumor cells. J. Cell Sci. 2010;1:2332–2341. doi: 10.1242/jcs.069443. [DOI] [PMC free article] [PubMed] [Google Scholar]
- Thiery J.P., Sleeman J.P. Complex networks orchestrate epithelial-mesenchymal transitions. Nat. Rev. Mol. Cell Biol. 2006;7:131–142. doi: 10.1038/nrm1835. [DOI] [PubMed] [Google Scholar]
- Tsai J.H., Donaher J.L., Murphy D.A., Chau S., Yang J. Spatiotemporal regulation of epithelial-mesenchymal transition is essential for squamous cell carcinoma metastasis. Cancer Cell. 2012;22:725–736. doi: 10.1016/j.ccr.2012.09.022. [DOI] [PMC free article] [PubMed] [Google Scholar]
- Wang W., Goswami S., Lapidus K., Wells A.L., Wyckoff J.B., Sahai E., Singer R.H., Segall J.E., Condeelis J.S. Identification and testing of a gene expression signature of invasive carcinoma cells within primary mammary tumors. Cancer Res. 2004;64:8585–8594. doi: 10.1158/0008-5472.CAN-04-1136. [DOI] [PubMed] [Google Scholar]
- Wang W., Wyckoff J.B., Goswami S., Wang Y., Sidani M., Segall J.E., Condeelis J.S. Coordinated regulation of pathways for enhanced cell motility and chemotaxis is conserved in rat and mouse mammary tumors. Cancer Res. 2007;67:3505–3511. doi: 10.1158/0008-5472.CAN-06-3714. [DOI] [PubMed] [Google Scholar]
- Wellner U., Schubert J., Burk U.C., Schmalhofer O., Zhu F., Sonntag A., Waldvogel B., Vannier C., Darling D., zur Hausen A. The EMT-activator ZEB1 promotes tumorigenicity by repressing stemness-inhibiting microRNAs. Nat. Cell Biol. 2009;11:1487–1495. doi: 10.1038/ncb1998. [DOI] [PubMed] [Google Scholar]
- Welm A.L., Sneddon J.B., Taylor C., Nuyten D.S., van de Vijver M.J., Hasegawa B.H., Bishop J.M. The macrophage-stimulating protein pathway promotes metastasis in a mouse model for breast cancer and predicts poor prognosis in humans. Proc. Natl. Acad. Sci. USA. 2007;104:7570–7575. doi: 10.1073/pnas.0702095104. [DOI] [PMC free article] [PubMed] [Google Scholar]
- Wyckoff J.B., Wang Y., Lin E.Y., Li J.F., Goswami S., Stanley E.R., Segall J.E., Pollard J.W., Condeelis J. Direct visualization of macrophage-assisted tumor cell intravasation in mammary tumors. Cancer Res. 2007;67:2649–2656. doi: 10.1158/0008-5472.CAN-06-1823. [DOI] [PubMed] [Google Scholar]
- Yang J., Mani S.A., Donaher J.L., Ramaswamy S., Itzykson R.A., Come C., Savagner P., Gitelman I., Richardson A., Weinberg R.A. Twist, a master regulator of morphogenesis, plays an essential role in tumor metastasis. Cell. 2004;117:927–939. doi: 10.1016/j.cell.2004.06.006. [DOI] [PubMed] [Google Scholar]
- Yu M., Bardia A., Wittner B.S., Stott S.L., Smas M.E., Ting D.T., Isakoff S.J., Ciciliano J.C., Wells M.N., Shah A.M. Circulating breast tumor cells exhibit dynamic changes in epithelial and mesenchymal composition. Science. 2013;339:580–584. doi: 10.1126/science.1228522. [DOI] [PMC free article] [PubMed] [Google Scholar]
- Zheng X., Carstens J.L., Kim J., Scheible M., Kaye J., Sugimoto H., Wu C.C., LeBleu V.S., Kalluri R. Epithelial-to-mesenchymal transition is dispensable for metastasis but induces chemoresistance in pancreatic cancer. Nature. 2015;527:525–530. doi: 10.1038/nature16064. [DOI] [PMC free article] [PubMed] [Google Scholar]
Associated Data
This section collects any data citations, data availability statements, or supplementary materials included in this article.
Supplementary Materials
The supplemental table contains a list of the genes that were differentially upregulated in the E-cadLO gene set.
All tumor cells express YFP and fusion protein of mCFP to the endogenous E-cad. Shown are the separate channels for CFP (E-cad-mCFP, left), YFP (YFP, middle) and the merged images (Merge, right). The still images of this video are shown in Figure 4B. Scale bars, 50 μm.
All tumor cells express YFP and fusion protein of mCFP to the endogenous E-cad. Shown are the separate channels for CFP (E-cad-mCFP, left), YFP (YFP, middle) and the merged images (Merge, right). The still images of this video are shown in Figure 4C. Scale bars, 50 μm.