

Abstract
Background
Infusion of allogeneic cardiosphere‐derived cells (allo‐CDCs) postreperfusion elicits cardioprotective cellular postconditioning in pigs with acute myocardial infarction. However, the long‐term effects of allo‐CDCs have not been assessed. We performed a placebo‐controlled pivotal study for long‐term evaluation, as well as shorter‐term mechanistic studies.
Methods and Results
Minipigs underwent 1.5‐hour mid‐left anterior descending balloon occlusion followed by reperfusion and were randomized to receive intracoronary allo‐CDCs or vehicle 30 minutes postreperfusion. Left ventriculography (LVG) demonstrated preserved ejection fraction (EF) and attenuation of LV remodeling in CDC‐treated pigs. Pigs underwent cardiac magnetic resonance imaging (MRI) and LVG 1 hour and 8 weeks after therapy to evaluate efficacy. MRI showed improvement of EF and attenuation of LV remodeling immediately after allo‐CDC infusion. In addition, allo‐CDCs improved regional function and decreased hypertrophy 2 months post‐treatment. Histological analysis revealed increased myocardial salvage index, enhanced vascularity, sustained reductions in infarct size/area at risk and scar transmurality, and attenuation of collagen deposition in the infarct zone of allo‐CDC‐treated pigs at 2 months. Allo‐CDCs did not evoke lymphohistiocytic infiltration or systemic humoral memory response. Short‐term experiments designed to probe mechanism revealed antiapoptotic effects of allo‐CDCs on cardiomyocytes and increases in cytoprotective macrophages, but no increase in overall inflammatory cell infiltration 2 hours after cell therapy.
Conclusions
Allo‐CDC infusion postreperfusion is safe, improves cardiac function, and attenuates scar size and remodeling. The favorable effects persist for at least 2 months after therapy. Thus, cellular postconditioning confers not only acute cardioprotection, but also lasting structural and functional benefits.
Keywords: allogeneic transplantation, cardioprotective effect, cardiosphere‐derived cells
Subject Categories: Cell Therapy, Translational Studies, Catheter-Based Coronary and Valvular Interventions, Myocardial Infarction
Introduction
Decades of work have attempted to limit acute myocardial infarction (AMI)‐related heart damage. Though numerous interventions work when applied before or during ischemia or in the immediate reperfusion period, nothing seems to work after a delay of 30 minutes or more.1 A notable exception is the phenomenon of cellular postconditioning: Administration of allogeneic cardiosphere‐derived cells (allo‐CDCs) after reperfusion reduces infarct size, prevents microvascular obstruction, and attenuates adverse remodeling of the left ventricle (LV).2 The use of 48‐hour endpoints in the initial description of cellular postconditioning demonstrated that the benefits were attributable to true cardioprotection, rather than to regeneration, which plays out over several weeks. However, a cardioprotective strategy would need to produce lasting benefits in order to be clinically useful, and the long‐term consequences of cellular postconditioning have yet to be investigated.
Here, we sought to test the long‐term safety and efficacy of allo‐CDC administration postreperfusion in pigs with AMI. We also probed the mechanism of the cardioprotective effect.
Methods
All animal studies were performed in an American Association for Accreditation of Laboratory Animal Care–accredited facility with approval from the institutional animal care and use committee of the Cedars‐Sinai Health System. Thirty‐two Yucatan minipigs were studied, in either a placebo‐controlled pivotal trial (n=28; Figure 1A) or in a short‐term mechanistic study (n=6; Figure 1B). Allo‐CDCs were grown from a freshly explanted Sinclair male minipig heart.
Figure 1.
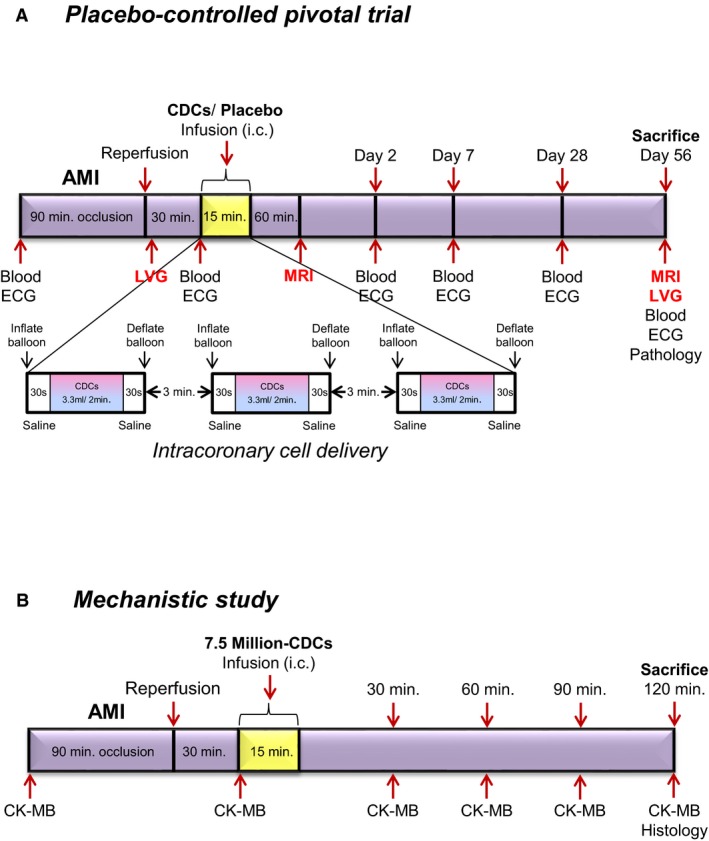
Study protocols. Placebo‐controlled pivotal trial (A) and mechanistic study (B). AMI indicates acute myocardial infarction; CDCs, cardiosphere‐derived cells; CK, creatine kinase; ECG, electrocardiogram; LVG, left ventriculography; MRI, magnetic resonance imaging.
Culture of Porcine CDCs
We obtained allogeneic CDCs from a Sinclair minipig heart from Sinclair Bio Resources, LLC (Columbia, MO), for the placebo‐controlled pivotal study and the mechanism assessment study to create a master cell bank (MCB). The heart arrived on ice submerged in cardioplegic solution. Hearts were grossly dissected, and biopsy‐sized pieces (≈25 mg) were seeded to create explant‐derived cells (EDCs). After ≈14 days, EDCs were harvested to create an MCB. MCB vials were thawed and cultured as cardiospheres (CSps) in suspension culture. CSps were grown on Ultra Low Cell STACK vessels (Corning Life Sciences, Tewksbury, MA). allo‐CDCs were grown by seeding CSps on Nunc Triple Flasks (Thermo Fisher Scientific, Waltham, MA) and passaging when confluent. allo‐CDCs were resuspended (1.25 M/mL for a total dose of 12.5 million CDCs in 10 mL) in CryoStorCS10 (BioLife Solutions, Inc., Bothell, WA) in cryobags (PL07 PermaLife Bags; Origen Biomedical, Inc., Austin, TX), placed directly in a CryoMed controlled‐rate freezer, and then transferred to liquid nitrogen. CDCs were thawed at the day of the infusion. Upon thawing, 1 mL of heparin (100 USP units/mL) and 0.1 mL of nitroglycerin (50 μg/mL) were added as diluents for a total 10‐mL dose for administration. Cell‐dose preparation was performed by Capricor, Inc. (Beverly Hills, CA).
Myocardial Infarct Creation and CDC Infusion
On day 0, animals were premedicated with ketamine 20 mg/kg intramuscularly (IM), atropine 0.05 mg/kg IM, and acepromazine 0.25 mg/kg IM. Animals were subsequently induced with propofol 2 to 4 mg/kg intravenously (IV) to effect, intubated, and maintained on isoflurane 2% to 3%. Amiodarone 10 mg/kg IV loading dose, then 0.5 mg/kg IV, as needed, and lidocaine 0.03 μg/kg/min were given for ventricular arrhythmias. Heparin 100 IU/kg IV was given for anticoagulation. AMIs were created in adult Yucatan minipigs by inflation of an angioplasty balloon in the mid‐left anterior descending artery (LAD) for 1.5 hours. For the placebo‐controlled pivotal study, a total of 28 minipigs received placebo or allo‐CDCs. allo‐CDCs were formulated, frozen, and count‐verified just before intracoronary infusion, which was performed 30 minutes postreperfusion by an over‐the‐wire balloon catheter, placed in the mid‐LAD. Cells were administered in 3 equally divided cycles of balloon inflation separated by 3 minutes of deflation (Figure 1A).3 For the mechanism assessment study, intracoronary infusion of allo‐CDCs in thawed bags (exact cell number was 7.5 million in 10 mL) was performed 30 minutes post‐MI (myocardial infarction) using a standard clinical over‐the‐wire angioplasty balloon (TREK, Abbott Vascular, Abbott Park, IL) in 3 boluses of 3.3 mL with intermediate washes of 2 mL between each bolus to ensure complete cell delivery.
Left Ventriculography
To measure global LV function and volumes, left ventriculography (LVG) was performed before infusion and before sacrifice on day 56 using a pigtail catheter inserted retrogradely into the LV, with imaging in the 40‐degree left anterior oblique projection (30 frames per second) using nonionic contrast (27≈30 mL/3 sec). The value of LV volume should be matched for indexed to body surface area (BSA). BSA can be calculated as per the formula (=0.121×BW kg0.575).4
Cardiac Magnetic Resonance Imaging
All magnetic resonance imaging (MRI) studies were performed on a 3.0T clinical scanner (Siemens MAGNETOM Verio; Siemens Healthcare GmbH, Erlangen, Germany). An early post‐treatment cardiac MRI was performed ≈60 minutes postinfusion of either allo‐CDCs or placebo. Typical in‐plane resolution was 1.3×1.3 mm, and slice thickness was 6 mm, with no gaps. Global LV function, regional systolic thickening, and regional end systolic thickness were assessed using retrospectively (ECG)‐gated and breath‐held cine steady‐state free precession acquisitions.3 Follow‐up MRIs were performed 2 months post‐AMI. LV ejection fraction (EF), volumes, global function and regional function were assessed. Contrast‐enhanced MRI was performed to assess area at risk (AAR; acutely)5 and scar mass (at 2 months).3
Minipigs undergoing baseline MRI subsequently received an IV injection of gadolinium (Gd)‐based contrast agent gadoversetamide (0.2 mmol/kg body weight; OptiMARK; Covidien Imaging Solutions, Hazelwood, MO), and, 8 minutes later, delayed contrast‐enhanced images were acquired with an prospectively (ECG) gated, breath‐hold, interleaved, two‐dimensional Turbo FLASH sequence. Inversion time was adjusted by the technician performing the scan to null signal from noninfarcted remote myocardium.
Image analyses related to tissue viability, that is, scar mass, viable myocardial mass (total mass minus scar mass), relative scar size (scar mass divided by total mass), and regional function, were performed using a validated imaging processing software (QMass MR; Medis Medical Imaging Systems BV, Leiden, The Netherlands).
For transmurality calculation, delayed enhancement images were used to quantify the infarct's endocardial length (length of the endocardium that is occupied by scar), scar thickness, and wall thickness. The center of the scar on the endothelial border was noted, and scar thickness and wall thickness were measured at this point. Then, the same measurements were performed at half the distance between the center of the scar and the lateral edges of the scar, as previously described.6 Scar transmurality was calculated as the percentage of scar thickness over wall thickness. All values (3 values per each MRI slice containing scar) were averaged for each animal.
Regional function was evaluated by dividing each of the short‐axis slices at end‐systole into 6 segments. The posterior right ventricular insertion was used as a reference point. Scar size from late Gd‐enhanced cardiac MR images was defined based on full width at half maximum to delineate scarred myocardium. Global function was reevaluated using ARGUS software (Syngo Multiple Modality Workplace, version 40A; ARGUS Software, Houston, TX).
Safety Evaluation (Coronary Flow and Arrhythmia)
Coronary flow of the LAD was evaluated utilizing the classical Thrombolysis In Myocardial Infarction (TIMI) grading system pre– and post–cell infusion according to 4 grades of flow, as described.7, 8 ECGs were recorded before induction of AMI, before CDC/vehicle infusion, immediately after CDC/vehicle infusion, day 2, 7, and 28 after CDC/vehicle infusion, and before sacrifice on day 56. In addition, ECGs were continuously monitored during intracoronary infusion for arrhythmias.
Histopathological Evaluation
Minipigs were euthanized and hearts explanted and sectioned into 1‐cm‐thick short‐axis slices to measure infarct size (IS). Then, transverse ventricular slices were incubated with 2% TTC (2,3,5‐triphenyl tetrazolium chloride) for 20 minutes at 37°C to stain viable myocardium. TTC stains viable myocardium brick red, whereas the infarct appears as non‐TTC‐stained tissue (white/yellow). Each slice was imaged digitally; infarcted areas were determined by manual tracing by a researcher blinded to treatment allocation (Adobe Photoshop CS2; Adobe Inc, San Jose, CA). ISs were expressed as the weight percent of AAR or LV (ImageJ, version 1.45s; National Institutes of Health [NIH], Bethesda, MA). Myocardial salvage index was calculated by formula with AAR‐IS/AAR, as described previously.9 Then, 8‐μm sections from myocardial samples (fixed in 10% formalin, paraffin‐embedded) were obtained from the infarct, border, and remote zones for immunostaining.
To measure myocyte cross‐sectional area, sections underwent immunostaining for α‐sarcomeric actinin (ab9465; Abcam, Cambridge, MA) and wheat‐germ agglutinin (Molecular Probes, Grand Island, NY) (to visualize cell borders). Vascular density was quantified in pigs sacrificed 48 hours postreperfusion. A total of 3 to 5 sections obtained from the border zones were evaluated per heart with immunostaining for Isolectin (Invitrogen I21411; Invitrogen, Carlsbad, CA) and α‐smooth muscle actin (α‐SMA; ab5694; Abcam). Masson's trichrome staining (Sigma‐Aldrich, St. Louis, MO) was performed on serial sections for tissue collagen quantification.10 To measure apoptotic cardiomyocytes, sections from myocardial samples underwent immunostaining for terminal deoxynucleotidyl transferase dUTP nick end labeling (TUNEL; Roche 12156792910; Roche, Indianapolis, IN) and α‐sarcomeric actinin (ab9465; Abcam). For inflammatory infiltration, CD3 (ab16669; Abcam), CD45 (A1222GA; AbD Serotec, Oxford, UK), CD68 (MAB1715; Abnova, Taipei City, Taiwan), CD206 (M2 marker; sc‐48758; Santa Cruz Biotechnology, Santa Cruz, CA), and inducble nitric oxide synthase (iNos; M1 marker; NBP1‐50606; Novus, Saint Charles, MO), and rhodamine phalloidin (R415; Invitrogen) were used for immunostaining. Alexa Fluor–conjugated secondary antibodies (Molecular Probes, Eugene, OR) were used, and counterstaining with 4′,6‐diamidino‐2‐phenylindole (DAPI; Molecular Probes) was performed. Sections were imaged using a confocal laser scan microscope (Leica Microsystems, Wetzlar, Germany) and images were processed by Leica Application Suite software. Border (peri‐infarct) zone was defined as the region at the edges of the scar (comprising areas of both viable and scarred myocardium).
To evaluate possible immune responses in the heart, hematoxylin and eosin (H&E) staining was performed in sections obtained from the infarct, the border, and the remote LV myocardium. Sections were analyzed by independent pathologists blinded to treatment allocation. Analysis was graded according to the International Society for Heart and Lung Transplantation (ISHLT) guidelines, a system used in clinical practice to grade cardiac allograft rejection.11
Histocompatibility
To assess histocompatibility, low‐resolution swine leukocyte antigen typing was performed on the donor Sinclair minipig and all recipient Yucatan minipigs, as described.12, 13 Divergent pig strains were used to stimulate the typical allogeneic conditions in human transplantation where donor and recipient are frequently mismatched with regard to human leukocyte antigen (HLA). Complete mismatch of HLA was confirmed if there was at least one Class I or one Class II antigen mismatch at the allele group level between donor and recipient.
Circulating Donor‐Specific Antibodies
In the placebo‐controlled pivotal study, to evaluate humoral immune response, recipient pig serum was obtained at baseline and day 2, 7, 28, and 56 postinfusion. Serum was screened for circulating antidonor immunoglobulin G (IgG) antibodies utilizing flow cytometry at each point.14
Blood Examination
In the placebo‐controlled study, complete blood count, chemistry panel, C‐reactive protein, and erythrocyte sedimentation rate were analyzed before induction of AMI, day 2, 7, and 28 after CDC/vehicle infusion, and before sacrifice on day 56. In the mechanism assessment study, blood samples were taken at baseline, before infusion, and 30, 60, 90, and 120 minutes postinfusion to measure creatine kinase (CK)‐MB as a cardiac injury.
Statistical Analysis
Results both in text and in figures are presented as mean±SEM, unless specified otherwise. Comparisons between any 2 groups were performed using the 2–tailed unpaired Student t test for comparison between placebo and treatment groups, the paired t test for comparison between baseline and endpoint, and repeated‐measures ANOVA for comparison of data measured serially in time in the 2 groups. Differences were considered statistically significant when P<0.05.
Results
Adverse Events and Mortality
The placebo‐controlled pivotal trial (Figure 2) and the mechanistic study were performed contemporaneously. Two of 34 pigs (5.8%) died because of ventricular arrhythmia during myocardial infarction (MI) creation. Three pigs were excluded because of technical failure or incomplete MI creation. There was no further mortality (0%), nor were there were any adverse events during the infusion procedure in either study. In the pivotal trial, 4 and 3 animals died in the perioperative period in placebo‐ and allo‐CDC‐infused groups, respectively. One pig was excluded because of death during anesthesia for a blood draw on day 28. One pig in placebo and 3 pigs in allo‐CDC‐treated groups were excluded with EF ≥55% in the 1‐hour MRI, per prespecified exclusion criteria. Thus, a total of 11 pigs completed the placebo‐controlled pivotal trial. There was no further mortality, nor were there any other adverse events in the mechanistic study.
Figure 2.
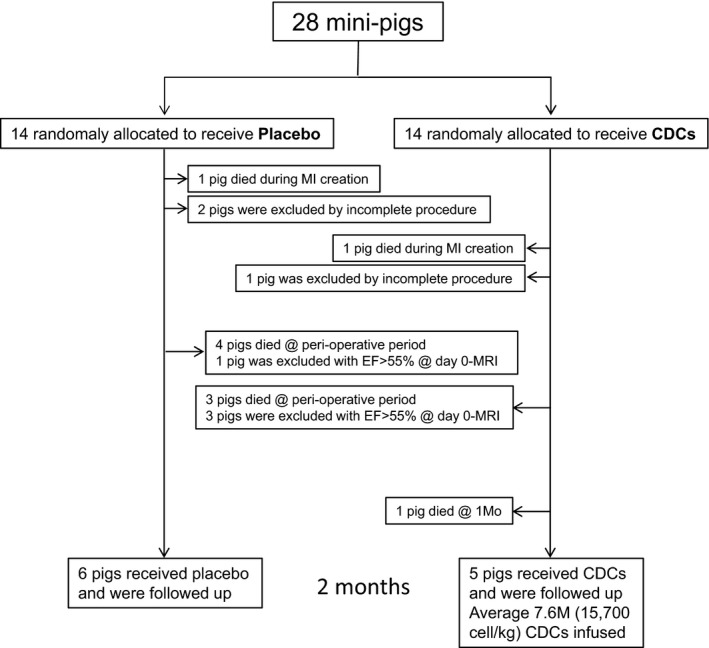
Flow chart of experimental design. CDCs indicates cardiosphere‐derived cells; EF, ejection fraction; MI, myocardial infarction; MRI, magnetic resonance imaging.
Placebo‐Controlled Pivotal Trial
We performed the pivotal trial with animals randomized to placebo or allo‐CDC groups. The allo‐CDC group mimicked the clinical situation in which a preformulated bag is acutely thawed for infusion at the site of reperfusion. From cell counting before infusion, actual delivered cell dosage was estimated at 7.58 million, with postthaw cell recoveries of 75.9±5.9% and cell viability of 89.8±2.7% (n=6; Table 1).
Table 1.
Summary of Coronary Flow and Dosing Data in Placebo‐ and CDC‐Treated Pigs
| Pig No. | Group | BW (kg) | TIMI | Cell Dose (M) | Cell/kg | Recovery (%) | Viability (%) | |
|---|---|---|---|---|---|---|---|---|
| Pre | Post | |||||||
| 1 | Placebo | 54 | 3 | 3 | N/A | |||
| 2 | Placebo | 48 | 3 | 3 | ||||
| 3 | Placebo | 51 | 3 | 3 | ||||
| 4 | Placebo | 42 | 3 | 3 | ||||
| 5 | Placebo | 51 | 3 | 3 | ||||
| 6 | Placebo | 52 | 3 | 2 | ||||
| Mean | 49.2 | 3 | 2.8 | |||||
| 1 | CDCs | 51 | 3 | 2.5 | 7.48 | 146 000 | 74.8 | 85.0 |
| 2 | CDCs | 49 | 3 | 3 | 8.2 | 167 300 | 82.0 | 89.0 |
| 3 | CDCs | 49 | 2.5 | 2 | 7.7 | 157 100 | 77.6 | 90.0 |
| 4 | CDCs | 45 | 3 | 3 | 7.6 | 168 900 | 76.0 | 90.0 |
| 5 | CDCs | 43 | 2 | 2.5 | 8 | 186 047 | 80.0 | 92.0 |
| 6 | CDCs | 55 | 3 | 3 | 6.5 | 118 000 | 65.0 | 92.8 |
| Mean | 48.7 | 2.8 | 2.7 | 7.58 | 157 224 | 75.9 | 89.8 | |
BW indicates body weight; CDCs, cardiosphere‐derived cells; N/A, not applicable; TIMI, Thrombolysis in Myocardial Infarction.
Long‐Term Functional Efficacy of Allogeneic CDCs Assessed by LVG
To assess the functional efficacy of allo‐CDCs, we measured cardiac function and volumes by LVG. Unlike MRI, LVG could logistically be used post‐AMI, but before treatment, to establish the baseline value of function and thus to confirm the fidelity of randomization. Indeed, EF is comparable at baseline (43–44%) in the 2 treatment groups (Figure 3B). Representative ventriculograms at 2 months post‐MI show amelioration of LV anterior wall motion in the CDC‐treated heart compared to placebo (yellow arrows indicate akinetic region; Figure 3A), but there was no difference in absolute EF between 2 groups at 2 months. Although the EF from baseline post‐MI to endpoint (2 months) in the placebo group was decreased (P<0.05), EF in the CDC‐treated group was not significantly changed (Figure 3B). left ventricular end‐diastolic volume index (LVEDVI) at endpoint was higher in placebo than in CDC‐treated pigs (P<0.05; Figure 3C). In addition, paired left ventricular end‐systolic volume index (LVESVI) shows that placebo (P<0.01) underwent more LV dilatation (P<0.05), with significantly greater LV end‐systolic volumes at endpoint (P<0.05; Figure 3D). Thus, infusion of allo‐CDCs preserved global cardiac function and minimized adverse remodeling.
Figure 3.
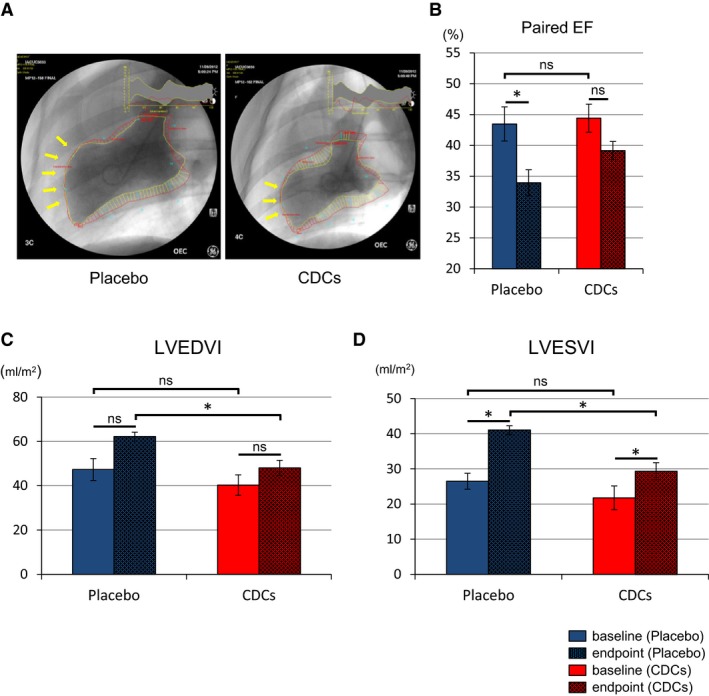
Allogeneic CDCs preserve cardiac function and attenuate adverse remodeling compared to placebo pigs, as assessed by left ventriculography. Representative cine pictures of left ventriculography in placebo and CDC‐treated pig at endpoint (2 months; A). Yellow arrow indicates akinetic anterior wall of left ventricle. Paired EF in each groups at baseline (≈15 minutes postreperfusion) and endpoint (B). Paired end‐diastolic volume index (C) and end‐systolic volume index (D) in placebo and CDC groups at baseline and endpoint. CDCs indicates cardiosphere‐derived cells; EF, ejection fraction; LVEDVI, left ventricular end‐diastolic volume index; LVESVI, left ventricular end‐systolic volume index. Values are means±SEM. *P<0.05 between 2 groups.
Functional Benefit After allo‐CDC Infusion Assessed by Cardiac MRI
To assess detailed cardiac function and tissue characteristics, we performed cardiac MRI ≈60 minutes postintervention and at endpoint. By the time of the first MRI, EF was already significantly better in allo‐CDC‐treated pigs than in placebo (Figure 4A and 4B; Videos S1 through S4). Likewise, LV dilatation was significantly attenuated in allo‐CDC pigs both at end‐diastole (Figure 4C) and end‐systole (Figure 4D) 1 hour post‐treatment. These differences between placebo‐ and allo‐CDC‐infused groups cannot be attributed to baseline differences pretreatment (Figure 3). Thus, the functional and structural benefits of cellular postconditioning are apparent with little delay. By 2 months of follow‐up, all the differences of indices are less than in the short term and there were no significant differences in the 2 groups. Nevertheless, regional wall motion and percent thickening are greater in CDC‐treated pigs compared to placebo at 2 months (Figure 4F and 4G). Taken together, these data indicate that allo‐CDCs preserve cardiac function and prevent acute LV remodeling promptly after CDC infusion. Furthermore, allo‐CDC infusion improves regional wall motion in the chronic phase.
Figure 4.
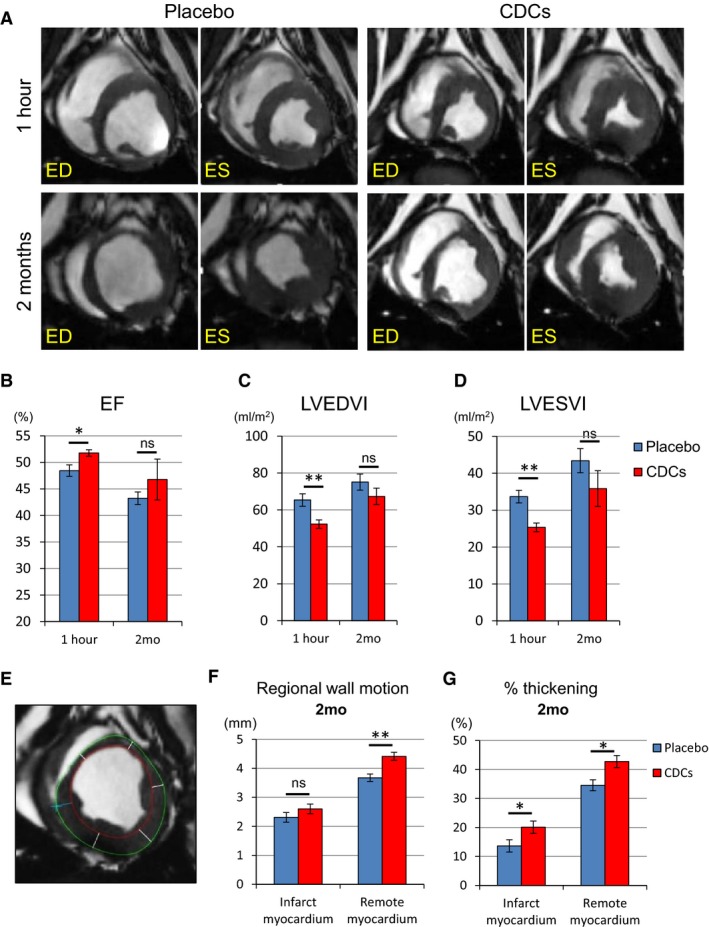
Allogeneic CDCs exhibit improved global function and remodeling 1 hour after cell treatment compared to placebo, as assessed by MRI. Matched cine short‐axis images (at end‐diastole [ED] and end‐systole [ES]) at 1 hour and 2 months post‐treatment for pigs treated with placebo and allogeneic CDCs (A). Comparison of ejection fraction (B), LVEDVI (C), and LVESVI (D) at 1 hour and 2 months in placebo‐ and CDC‐treated pigs. Endocardial (red) and epicardial (green) contours of the LV are shown. Cardiac slices were divided into 6 segments to calculate regional wall motion and thickening in infarct and remote myocardium at 2 months (E). Regional wall motion (F) and percent thickening (G) in infarct and remote myocardium in placebo and CDC groups at 2 months. CDCs indicates cardiosphere‐derived cells; EF, ejection fraction; LVEDVI, left ventricular end‐diastolic volume index; LVESVI, left ventricular end‐systolic volume index; MRI, magnetic resonance imaging. Values are means±SEM. *P<0.05 and **P<0.01 between 2 groups.
Assessment of Cardiac MRI With Structural Effect After allo‐CDC Infusion
Gd contrast enhancement in the acute phase of MI is not a reliable measure of scar,15 but it does correlate with AAR16 (the borders of AAR appear bright, but regions of microvascular occlusion in the center exclude Gd and remain dark; Figure 5A, left panels, yellow arrows). The volume of myocardium bounded by early Gd‐enhancement was equal in placebo‐ and CDC‐treated pigs at 1 hour (pooled data in Figure 5B), consistent with the notion that AARs are identical in the 2 groups. Two months later, MRI analysis showed that the zone of late Gd enhancement, a reporter of scar size (Figure 5C), was not significantly different in the 2 groups at 2 months. However, total LV mass was lower in allo‐CDC‐treated animals relative to placebo (Figure 5D), presumably reflective of a decrease in compensatory hypertrophy; likewise, scar transmurality was lower in CDC‐treated hearts (Figure 5E). All of the conclusions regarding tissue characteristics at 2 months were subjected to histological validation, as discussed next.
Figure 5.
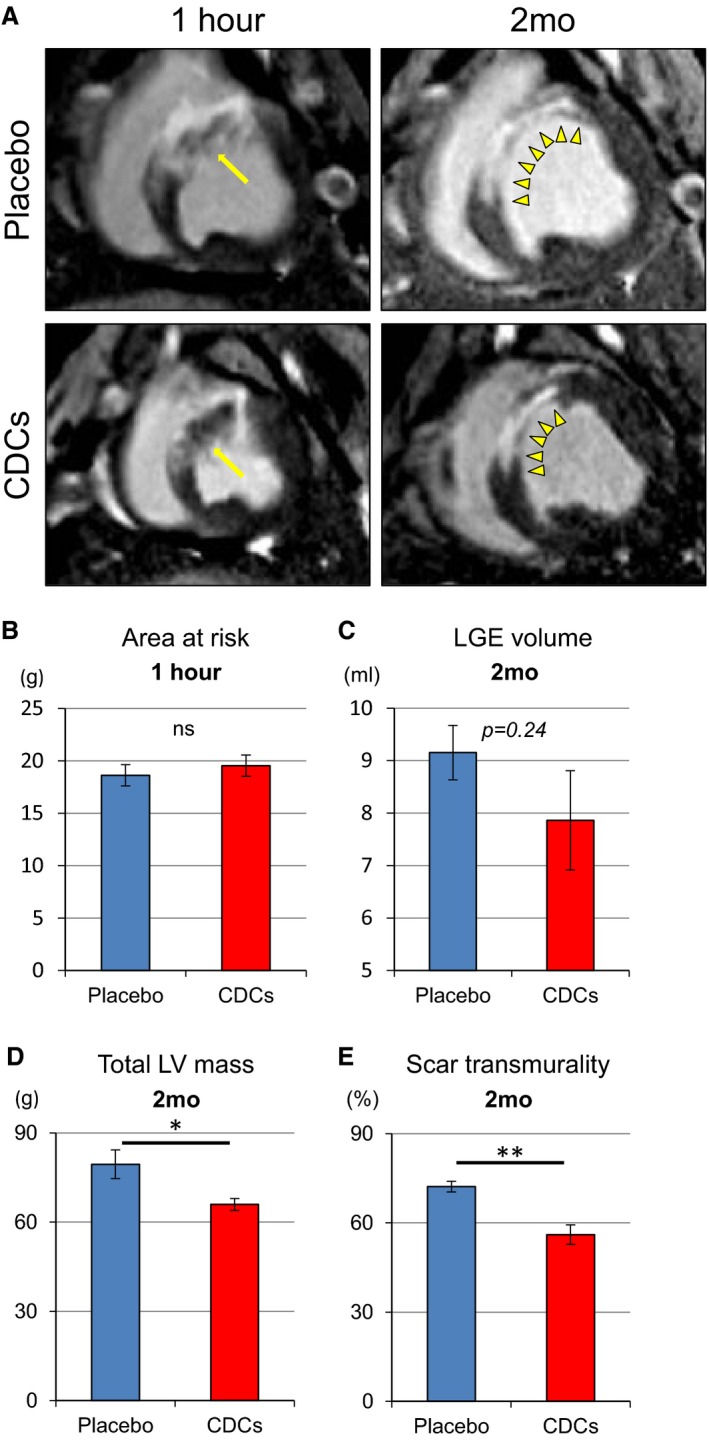
Allogeneic CDCs improve regional wall motion and thickening, as assessed by MRI. Representative early and delayed Gd‐enhanced MRI images of heart in short‐axis section at 1 hour and 2 months in a placebo‐ and a CDC‐treated pig (A). One hour post–cell infusion, risk area (ischemic myocardium) is evident by areas of hyperintensity, including dark zone (yellow arrows). Arrows point to no‐reflow area. At 2 months, infarcted scar area (yellow arrow heads) appears hyperintense (white) whereas viable myocardium appears dark. Scar area decreased in CDC‐treated pig compared to placebo pig. Comparison of area at risk at 1 hour (B), volume of late Gd enhancement (LGE; C), total LV mass (D), and scar transmurality (E) at 2 months in placebo‐ and CDC‐treated pigs. Values are means±SEM. *P<0.05 and **P<0.01 between 2 groups. CDCs indicates cardiosphere‐derived cells; EF, ejection fraction; Gd, gadolinium; LV, left ventricular; MRI, magnetic resonance imaging.
Histological Assessment of Scarred and Viable Myocardium
Immediately after the 2‐month MRIs, hearts were removed and processed for histology. Figure 6A shows representative slices stained with TTC to quantify infarcted area. The placebo heart has a thin infarcted wall in which the scar is mostly transmural, whereas the heart treated with CDCs has viable myocardium surrounding the scar with a visibly thicker infarcted wall. Pooled data show that scar transmurality was decreased in CDC‐treated hearts (Figure 6B), confirming the MRI results (Figure 5E). Myocardial salvage index17 was also higher in the CDC group (Figure 6C). Absolute infarct size showed a strong trend toward reduction in CDC‐treated pigs (Figure 6D), which was significant when normalized to AAR (53.4% in CDC‐treated vs 69.3% in placebo; Figure 6E). In addition, the remote/LV area ratio is higher in placebo‐ than in CDC‐treated hearts (Figure 6F), which suggests that placebo hearts developed hypertrophy in the remote myocardium (consistent with the MRI analysis; Figure 5D). To verify this conjecture, we evaluated cardiomyocyte morphology by microscopic analysis. Myocyte cross‐sectional area was smaller in CDC‐treated pigs than in placebo (Figure 6G and 6H). Thus, one of the key long‐term benefits of cellular postconditioning is a decrease in compensatory myocardial hypertrophy.
Figure 6.
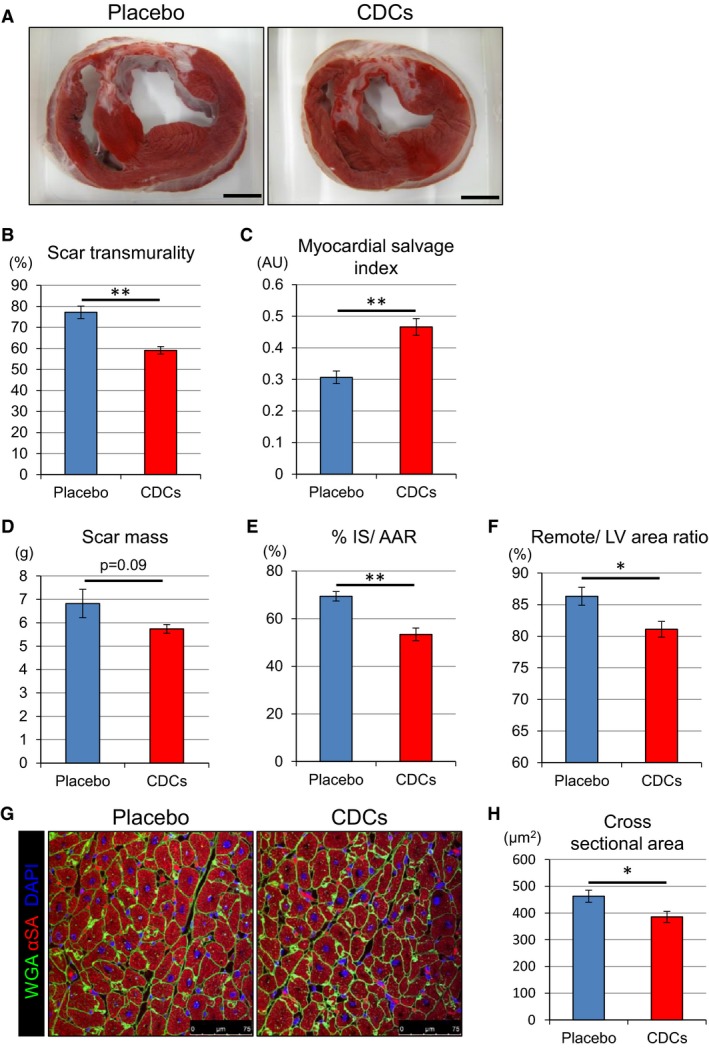
Allogeneic CDCs prevent hypertrophy, decrease infarct size, and salvage myocardium, as assessed by postmortem histology. Representative short‐axis heart slices of a placebo‐ and a CDC‐treated pig after incubation with TTC. Viable myocardium stains brick red, whereas scarred myocardium appears white (A). Comparison of scar transmurality (B), myocardial salvage index (C), scar mass (D), and percent IS/AAR (E) at 2 months in placebo and CDC groups. Comparison of remote area (as percent of LV) at 2 months in placebo and CDC groups (F). Cardiomyocyte cross‐sectional area in the remote zone (G and H). AAR indicates area at risk; AU, astronimcal unit; CDCs, cardiosphere‐derived cells; IS, infarct size; LV, left ventricle; TTC, 2,3,5‐triphenyl tetrazolium chloride. Values are means±SEM. *P<0.05 and **P<0.01 between 2 groups. Scale bar in (A) is 1 cm.
Histopathological and Serum Evaluation of Intracoronary Infusion of allo‐CDCs
In order to investigate the effect of CDCs on vessels, we evaluated immunohistochemistry with isolectin and α‐SMA. Vessel density in the IZ was higher in the CDC‐treated group (Figure 7A and 7B); meanwhile, fibrosis was attenuated, as is evident from representative Masson's trichrome–stained sections from the infarcted wall (Figure 7C and 7D). In addition, quantification of apoptosis revealed fewer TUNEL‐positive myocytes in the border zone in CDC‐treated hearts than in placebo (Figure 7E and 7F), consistent with our previously reported findings at an earlier time point.18 Taken together, these results indicate that CDCs promote vessel formation and attenuate collagen deposition and cardiomyocyte apoptosis.
Figure 7.
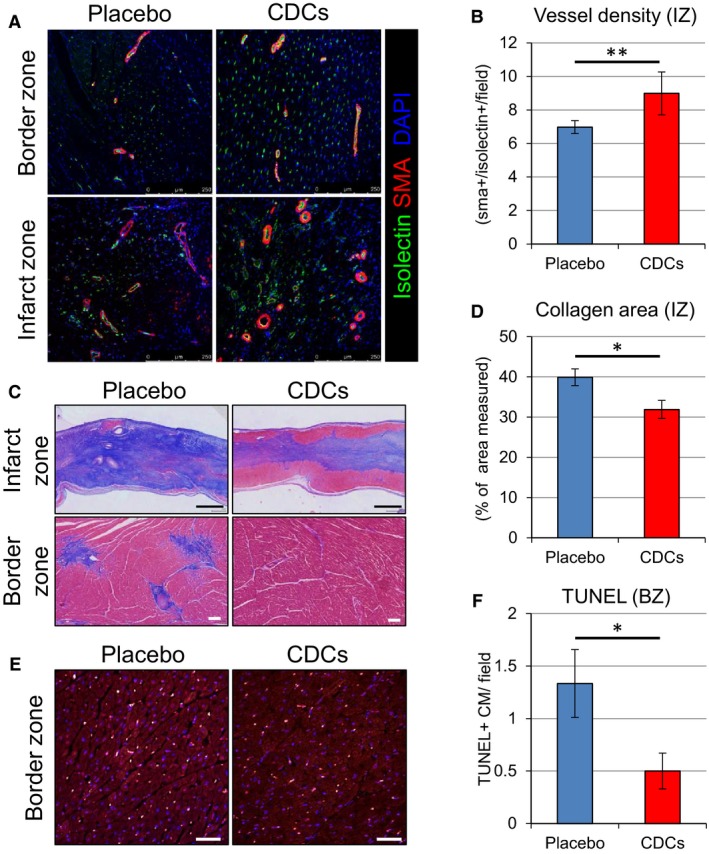
Immunohistological assessment of vessel density, collagen deposition, and apoptosis of cardiomyocytes. Representative images of vessel density in border and infarct zones assessed by immunostaining for isolectin and α‐smooth muscle actin at 2 months in placebo‐ and CDC‐treated pigs (A). Quantitative analysis of vessel density in infarct zone (B). Representative sections from the infarcted wall and border zone of placebo‐ and CDC‐treated pigs stained with Masson's trichrome. Scar area stains blue and viable myocardium stains red (C). Quantitative analysis of collagen deposition in infarct zone (D). Comparison of apoptosis of cardiomyocytes assessed by TUNEL staining (E) and quantitative evaluation of TUNEL‐positive cell number in the border zone (F). Values are means±SEM. *P<0.05 and **P<0.01 between 2 groups. Scale bars: (C) (upper)=1 mm; (C) (lower)=100 μm; and (E)=50 μm. BZ indicates border zone; CDCs, cardiosphere‐derived cells; DAPI, 4′,6‐diamidino‐2‐phenylindole; IZ, infarct zone; SMA, smooth muscle actin; TUNEL, terminal deoxynucleotidyl transferase dUTP nick end labeling.
Immune Reaction to allo‐CDCs in Pivotal Study
To evaluate immune and inflammatory reactions to cellular postconditioning, we first checked the peripheral leukocyte count and differential at 48 hours. Leukocyte and lymphocyte counts were equal before ischemia, but were attenuated in CDC‐infused animals compared to placebo 48 hours post‐MI (Figure 8A and 8B). Serum neutrophil and monocyte fractions exhibited a similar trend (Figure 8C and 8D). This apparent attenuation of inflammation occurred despite the fact that there was complete immunological mismatch for swine leukocyte antigens between donor and recipient pigs (Table 2). No circulating alloreactive IgG antidonor antibodies were detected in any recipients of allo‐CDCs at any time point (Figure 8E and 8F). Histopathology demonstrated focal minimal and mild lymphohistocytic infiltration in the border zone in placebo‐ and CDC‐treated pigs, respectively (Figure 8G). The infiltrating cells were localized within interstitial and perivascular spaces (Grade 1R according to the ISHLT grading system; Figure 8H). Remote myocardium was consistently clear of inflammatory infiltrates.
Figure 8.
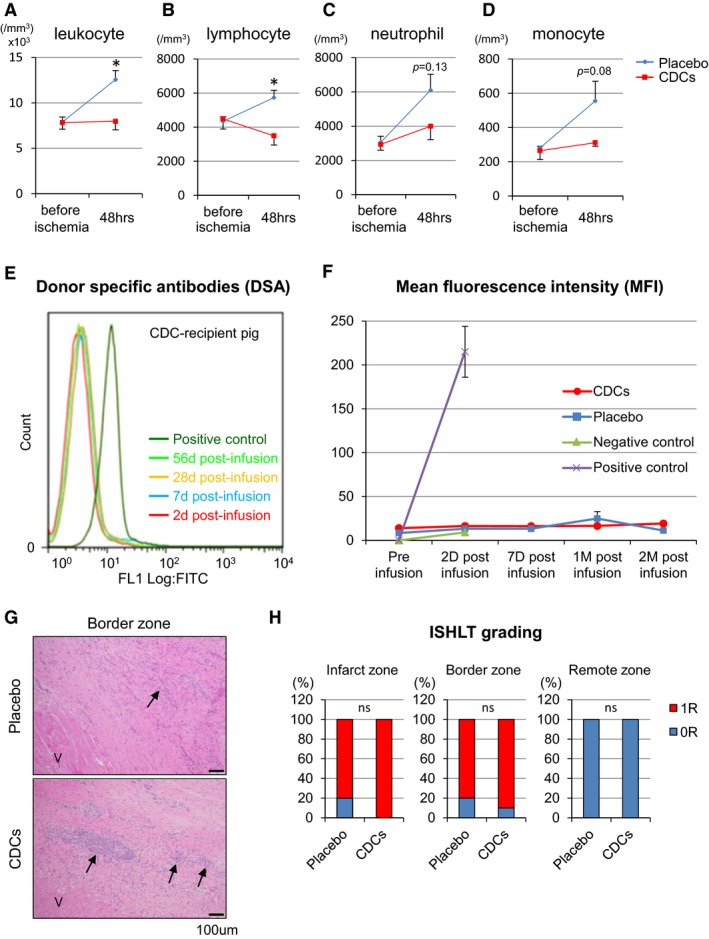
Inflammation and immune responses. Serum total leukocyte (A), lymphocyte (B), neutrophil (C), and monocyte (D) counts in placebo‐ and CDC‐treated pigs at baseline (pretreatment) and 48 hours. Representative levels of circulating IgG antidonor antibodies were measured in CDC‐treated pig serum samples with flow cytometry (E). Mean fluorescence intensity (MFI) of circulating IgG antidonor antibody (F). No alloreactive antibodies were detected in any recipients of allogeneic CDCs at any time point. G, Histopathology (H&E staining) in border zone in placebo‐ and CDC‐treated pigs. Viable cardiac muscle fibers (V) are present in the lower left corner of the image. Arrows indicates minimal and mild lymphohistiocytic infiltrates in the infarct of placebo and CDCs group, respectively. Ratio of Grade 0R or1R with ISHLT grading system in infarct, border, and remote zone (H). CDCs indicates cardiosphere‐derived cells; H&E, hematoxylin and eosin; IgG, immunoglobulin G; ISHLT, the International Society for Heart and Lung Transplantation. Values are means±SEM. *P<0.05 between 2 groups.
Table 2.
Summary of SLA Haplotype
| Donor Pig | Breed | Sex | Blood Type | Inferred Low‐Resolution (Lr) SLA Haplotype | |||||||||
|---|---|---|---|---|---|---|---|---|---|---|---|---|---|
| 0111 | Sinclair | M | Non‐A | Lr‐2.2/11.12 | |||||||||
| Recipient Pig | Breed | Sex | Blood Type | Inferred Low‐Resolution (Lr) SLA Haplotype | Predicted No. of Allele Mismatch | No. of Antigen Mismatcha | |||||||
|---|---|---|---|---|---|---|---|---|---|---|---|---|---|
| SLA‐1 | SLA‐3 | SLA‐2 | DRB1 | DQB1 | DQA | Class I | Class IIb | Total | |||||
| CDC1 | Yucatan | F | A | Lr‐4.5/7.8 | 4 | 0 | 2 | 2 | 1 | 2 | 6 | 3 | 9 |
| CDC2 | Yucatan | F | A | Lr‐4.5/4.5 | 4 | 1 | 2 | 2 | 1 | 2 | 7 | 3 | 10 |
| CDC3 | Yucatan | F | A | Lr‐5.6/6.7 | 4 | 1 | 2 | 2 | 2 | 1c | 7 | 4 | 11 |
| CDC4 | Yucatan | F | A | Lr‐6.7/6.7 | 4 | 1 | 2 | 2 | 2 | 1c | 7 | 4 | 11 |
| CDC5 | Yucatan | F | Non‐A | Lr‐5.7/6.7 | 4 | 1 | 2 | 2 | 2 | 1c | 7 | 4 | 11 |
| CDC6 | Yucatan | F | A | Lr‐4.5/25.25 | 4 | 1 | 2 | 2 | 1 | 2 | 7 | 3 | 10 |
Low‐resolution SLA genotyping revealed complete Class I (SLA‐1, SLA‐2, and SLA‐3) and Class II (DRB1, DQB1, and DQA) mismatches between the donor Sinclair pig and CDC recipients (Yucatan minipig). CDCs indicates cardiosphere‐derived cells; SLA, .
Maximum number of antigen mismatch at SLA‐1, SLA‐2, SLA‐3, DR, and DQ is typically 10 to 12 (2 alleles at each locus with some haplotypes express duplicated SLA‐1 antigen); with 0111 as the donor, the maximum number of antigen mismatch is predicted to be 11 given that both haplotypes express 2 SLA‐1 antigens each, whereas Lr‐2.2 does not express SLA‐3.
Based on mismatch at DRB1 and DQB1.
One allele appears to match at the low‐resolution allele‐group level, but allelic‐level mismatch may be identified by high‐resolution typing.
Probing Mechanism
The results in Figure 4 indicate that functional and structural benefits of cellular postconditioning are evident as early as 1 hour after CDC infusion. We further investigated the time course of cardioprotection by measuring CK‐MB level at various time points (Figure 9A). Whereas CK‐MB levels were comparable preischemia and at baseline (pretreatment) post‐MI, a decrease in the CDC group is evident by 30 minutes post‐treatment and persists for at least 2 hours. We therefore selected 2 hours post‐treatment as the endpoint for the mechanistic study. Once again, TUNEL‐positive myocytes were decreased in the border zone of CDC‐treated animals versus placebo (Figure 9C), signifying a decrease in apoptosis. In contrast to the anti‐inflammatory response observed systemically (Figure 8A through 8D), the myocardium exhibited no overall changes in CD3‐ or CD45‐positive cell content between placebo‐ and CDC‐treated hearts. Nevertheless, there was a significant increase in the number of CD68+ cells (macrophages; Mϕ) in hearts of CDC‐treated pigs (Figure 9D and 9E). Mϕ have the intrinsic capacity to polarize between M1 (proinflammatory) and M2 (reparative) phenotypes; interestingly, we observed a strong shift toward an M2‐like Mϕ phenotype (Figure 9F and 9G). Taken together, these data suggest that salutary changes in Mϕ polarization from a “proinflammatory” toward a “healing” phenotype may contribute to cellular postconditioning, consistent with more‐extensive mechanistic studies in rats and in isolated macrophages.19, 20
Figure 9.
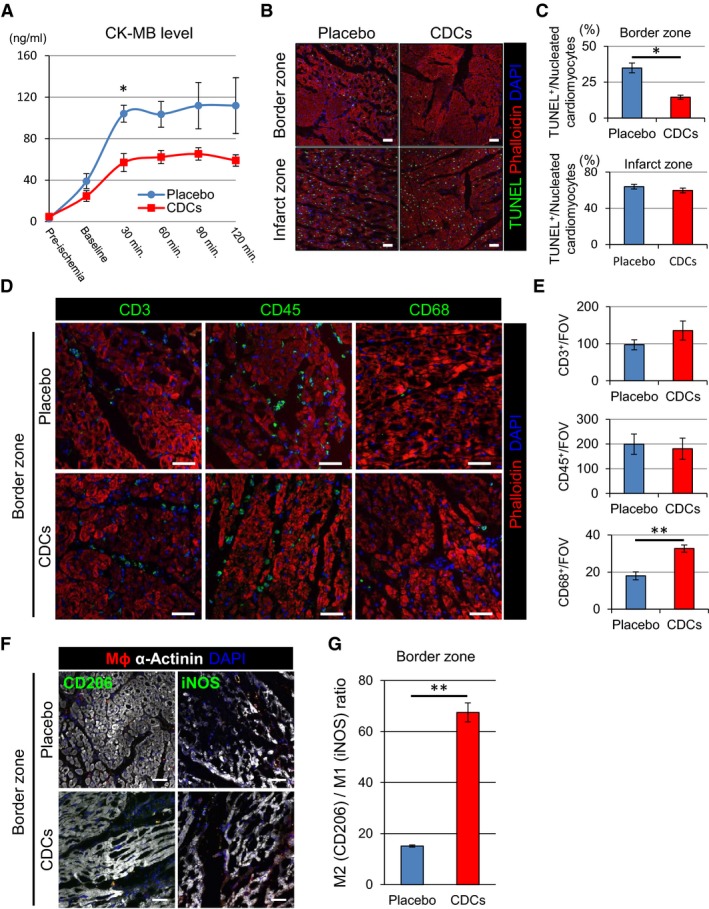
Allogeneic CDCs induce cytoprotective effects by anti‐inflammatory and ‐apoptotic mechanisms. Level of serum CK‐MB with placebo‐ and CDC‐treated pigs during the 2 hours postintervention (A). TUNEL staining in border and infarct zones of placebo and CDC‐treated pigs 2 hours postintervention (B). Quantification of TUNEL‐positive cardiomyocytes in border and infarct zones of placebo and CDC‐treated pigs (C). Representative images (D) and quantification (E) of inflammatory cell infiltration (CD3, CD45, and CD68) in border zone of placebo‐ and CDC‐treated pigs 2 hours postintervention. Representative images of M1 (iNos+) and M2 (CD206+) macrophages in the border zone of placebo‐ and CDC‐treated pigs 2 hours postintervention (F). Macrophage polarization markers iNos (M1) and CD206 (M2) were utilized to differentiate the proportion of infiltrating M1 and M2 macrophages within the border zone tissue 2 hours postintervention. Data are presented as the number of CD206+ vs iNos+ macrophage per field of view (G). Values are means±SEM. *P<0.05 and **P<0.01 between 2 groups. Scale bars are 50 μm in (B, D, and F). CDCs indicates cardiosphere‐derived cells; CK, creatine kinase; iNOS, inducble nitric oxide synthase; TUNEL, terminal deoxynucleotidyl transferase dUTP nick end labeling.
Discussion
Here, we report on the long‐term benefit of allo‐CDC therapy immediately postreperfusion in a clinically relevant pig model of AMI. The main findings are: (1) allo‐CDC infusion after AMI is clinically feasible and safe without immunosuppression. (2) CDCs prevent LV dilatation acutely (≈60 minutes) and attenuate LV remodeling post‐AMI chronically (2 months). (3) CDCs increase LV wall thickness and improve regional LV wall motion chronically. (4) CDCs preserve myocardium and prevent hypertrophy. (5) CDCs decrease inflammatory response and reduce reperfusion injury. (6) Underlying mechanisms include enhanced angiogenesis, decreased apoptosis, and polarization of Mϕ toward a reparative phenotype.
Optimal Timing of Cell Administration and Advantage of Allogeneic Products
Here, we have followed our originally described cellular postconditioning protocol, wherein cells are administered 30 minutes postreperfusion.2 Though this protocol is effective, few data are available regarding the timing window of therapeutic opportunity post‐AMI. In the rat model, allo‐CDC administration 20 minutes, but not 2 hours, post‐AMI is cardioprotective.20 Administration of cells immediately postreperfusion is known to be more effective than delivery 7 days post‐AMI in increasing neovascularization and expression of vascular endothelial growth factor in rats and pigs, respectively.21, 22 Within the early time window, an important consideration is the ability of cells to reach their targets when delivered by the coronary route. Microvascular obstruction (MVO) progressively evolves starting several minutes postreperfusion, reaching a peak 48 hours afterward.23 Early cell administration not only has the potential to mitigate MVO, but also should logically be timed to precede significant MVO so as to maximize cell access to injured tissue. In terms of cardioprotection, myocardium at risk is irreversibly damaged after 3 hours of occlusion, so earlier administration is required for meaningful salvage.24 The notion that prompt intervention is optimal is supported by our observations that LV EF is augmented, and ventricular volumes are preserved, very quickly after allo‐CDC therapy (Figure 4B through 4D).
The use of allogeneic cells as “off‐the‐shelf” products is mandatory for prompt administration postreperfusion. Allogeneic cell therapy has the additional advantage that it avoids variations of cell efficacy attributable to patient age or comorbidities, plus the risks and costs of patient‐specific tissue harvesting and cell processing. Although immune rejection is a possible disadvantage, allogeneic mesenchymal stem cells25 and CDCs (http://clinicaltrials.gov/ct2/show/NCT01458405) have been used in various early‐phase clinical trials of heart disease without safety concerns,25 consistent with preclinical studies indicating that allogeneic cell therapy without immunosuppression is safe and effective.3, 14, 20, 26 Indeed, our study demonstrates only nonsignificant local inflammatory response and the absence of circulating alloreactive antibodies with long‐term follow‐up after the administration of allo‐CDCs.
Long‐Term Beneficial Effects of Cellular Postconditioning
The present work demonstrates that prompt infusion of CDCs postreperfusion preserves regional wall motion and wall thickening functionally with long‐term follow‐up. This reduction of wall stress leads to attenuated LV remodeling, as well as reduced hypertrophy. The attenuation of hypertrophy is important for 2 reasons: First, reduction of hypertrophy is itself a salutary principle, given that post‐MI hypertrophy has been associated with poor long‐term outcomes27; second, the reduction of hypertrophy in CDC‐treated animals confounds the assessment of scar‐size reductions, especially when IS is conventionally expressed as a percentage of LV mass.28 Thus, correction for AAR, as in Figure 6E, is particularly important.
Mechanisms of Benefit
We now widely recognize that most of the beneficial effects of transplanted CDCs are indirect, and not attributable to canonical stem cell mechanisms. CDCs have been argued to be cardiac progenitor cells,29, 30, 31 but that feature of CDCs is an epiphenomenon when it comes to mechanism of action. In the extreme, allo‐CDCs are cleared completely within several weeks, but their functional and structural benefits persist at least 6 months.14 Thus, long‐term transplanted cell survival is not required for sustained benefit.32 Consistent with the mechanistic data in Figure 9F and 9G, our recent publication in a rat AMI model implicates CDC‐secreted exosomes in the mechanism of action, through effects on macrophage polarization.20
The implication of macrophages breathes new life into the long‐standing, but much‐maligned, concept that inflammation may be a useful target to mitigate reperfusion injury.1, 33 Inflammation post‐AMI is important for healing and influences short‐ and long‐term outcomes.34, 35 Leukocytosis is a strong predictor of mortality and heart failure in patients post‐AMI.36, 37 Moreover, a subset of leukocytes (viz., neutrophils and monocytes) are associated with microvascular injury, LV remodeling, and function.34, 38 In addition, monocyte/macrophage heterogeneity post‐AMI is associated with the impairment of myocardial salvage and adverse LV remodeling.19 Here, we found that peripheral leukocyte counts are lower in CDC‐treated animals compared to placebo in the first 2 days postreperfusion. In addition, CDC infusion reduces myocardial injury and apoptosis as soon as 2 hours after cell treatment, at which time changes in macrophage polarization are already evident. As tantalizing as it may be, the limited mechanistic information in the present study serves more to generate hypotheses than to test them. The data are therefore large‐animal correlates to our recent detailed characterization in a rat AMI model of the mechanistic roles of inflammation in general, and macrophages specifically, in cellular postconditioning.20
Limitations
This study has several limitations. First, infarct size and AAR could not be measured at baseline (after reperfusion, but before therapy) in this protocol. For this reason, the only paired pre‐/postanalyses are based on LVG, which is accurate for overall ventricular performance, but provides no tissue‐level insights. Second, to produce AMI, we used an iatrogenic balloon occlusion model without any thrombus or atherosclerotic plaque in the absence of comorbidities, such as diabetes, and pigs were pretreated with amiodarone to prevent loss of animals attributable to ventricular arrhythmia. These do not reflect the real clinical situation; indeed, the preadministration of amiodarone has the potential to mask a possible effect of CDCs on arrhythmogenesis,39 and diabetes is known to interfere with some classical forms of cardioprotection.40 In addition, pigs were not receiving medical therapy, such as beta‐blockers or renin‐angiotensin system inhibitors, which are established as optimal medical therapy for preventing adverse remodeling and progression to heart failure. So, it is unclear whether CDCs would have any incremental benefits above and beyond optimal medical therapy. Finally, our phenotyping ended 2 months after cell treatment in this study. Although our previous work indicates that the benefits of CDCs can last even longer,10, 14 more‐extended evaluation would be valuable, particularly in terms of hard clinical endpoints, such as progression to heart failure.
Conclusions
Here, we demonstrate that intracoronary infusion of allogeneic CDCs postreperfusion, utilizing strategies consistent with standard clinical practice, reduced infarct size, preserved regional function, and elicited cytoprotection in pigs with AMI. The durable benefits indicate that cellular postconditioning has the potential to improve long‐term outcomes post‐AMI.
Sources of Funding
This work was partially supported by a grant to Capricor from NIH (HL103356). General laboratory support was provided by the Cedars‐Sinai Board of Governors Heart Stem Cell Center and NIH. H.K. was supported, in part, by a fellowship from the Uehara Memorial Foundation and the Sumitomo Life Social Welfare Services Foundation.
Disclosures
E. Marbán and L. Marbán own equity in Capricor, Inc. L. Marbán and Kreke are employed by Capricor. Malliaras is a consultant for Capricor, Inc. Other authors have no relationships with industry.
Supporting information
Video S1. Video of short‐axis cine acquisition of a placebo pig at 1 hour post–placebo infusion.
Video S2. Video of short‐axis cine acquisition of a placebo pig at 2 months post–placebo infusion.
Video S3. Video of short‐axis cine acquisition of a CDC‐treated pig at 1 hour post–CDC infusion.
Video S4. Video of short‐axis cine acquisition of a CDC‐treated pig at 2 months post–CDC infusion.
Acknowledgments
The authors thank Adrian Glenn, Hao Zeng, Miguel Huerta, Claudia Anchante, Julie Avalos and Stephen Taylor for their excellent technical and surgical support, Laura Smith for performing the MRI scans and performing preliminary MRI analyses, Kristen J. Nikula for pathological report, Jackelyn Valle for immunostaining and scanning, and Nina Duong for blood processing.
(J Am Heart Assoc. 2016;5:e002796 doi: 10.1161/JAHA.115.002796)
Accompanying Videos S1 through S4 are available at http://jaha.ahajournals.org/content/5/1/e002796/suppl/DC1
References
- 1. Kloner RA, Rezkalla SH. Cardiac protection during acute myocardial infarction: where do we stand in 2004? J Am Coll Cardiol. 2004;44:276–286. [DOI] [PubMed] [Google Scholar]
- 2. Kanazawa H, Tseliou E, Malliaras K, Yee K, Dawkins JF, De Couto G, Smith RR, Kreke M, Seinfeld J, Middleton RC, Gallet R, Cheng K, Luthringer D, Valle I, Chowdhury S, Fukuda K, Makkar RR, Marban L, Marban E. Cellular postconditioning: allogeneic cardiosphere‐derived cells reduce infarct size and attenuate microvascular obstruction when administered after reperfusion in pigs with acute myocardial infarction. Circ Heart Fail. 2015;8:322–332. [DOI] [PMC free article] [PubMed] [Google Scholar]
- 3. Malliaras K, Smith RR, Kanazawa H, Yee K, Seinfeld J, Tseliou E, Dawkins JF, Kreke M, Cheng K, Luthringer D, Ho CS, Blusztajn A, Valle I, Chowdhury S, Makkar RR, Dharmakumar R, Li D, Marban L, Marban E. Validation of contrast‐enhanced magnetic resonance imaging to monitor regenerative efficacy after cell therapy in a porcine model of convalescent myocardial infarction. Circulation. 2013;128:2764–2775. [DOI] [PMC free article] [PubMed] [Google Scholar]
- 4. Swindle MM. Swine in the Laboratory: Surgery, Anesthesia, Imaging and Experimental Techniques. Boca Raton, FL: CRC Press; 2007. [Google Scholar]
- 5. Payne AR, Casey M, McClure J, McGeoch R, Murphy A, Woodward R, Saul A, Bi X, Zuehlsdorff S, Oldroyd KG, Tzemos N, Berry C. Bright‐blood T2‐weighted MRI has higher diagnostic accuracy than dark‐blood short tau inversion recovery MRI for detection of acute myocardial infarction and for assessment of the ischemic area at risk and myocardial salvage. Circ Cardiovasc Imaging. 2011;4:210–219. [DOI] [PubMed] [Google Scholar]
- 6. Karantalis V, DiFede DL, Gerstenblith G, Pham S, Symes J, Zambrano JP, Fishman J, Pattany P, McNiece I, Conte J, Schulman S, Wu K, Shah A, Breton E, Davis‐Sproul J, Schwarz R, Feigenbaum G, Mushtaq M, Suncion VY, Lardo AC, Borrello I, Mendizabal A, Karas TZ, Byrnes J, Lowery M, Heldman AW, Hare JM. Autologous mesenchymal stem cells produce concordant improvements in regional function, tissue perfusion, and fibrotic burden when administered to patients undergoing coronary artery bypass grafting: the Prospective Randomized Study of Mesenchymal Stem Cell Therapy in Patients Undergoing Cardiac Surgery (PROMETHEUS) trial. Circ Res. 2014;114:1302–1310. [DOI] [PMC free article] [PubMed] [Google Scholar]
- 7. The thrombolysis in myocardial infarction (TIMI) trial. Phase I findings. TIMI Study Group. N Engl J Med. 1985;312:932–936. [DOI] [PubMed] [Google Scholar]
- 8. Comparison of invasive and conservative strategies after treatment with intravenous tissue plasminogen activator in acute myocardial infarction. Results of the thrombolysis in myocardial infarction (TIMI) phase II trial. The TIMI Study Group. N Engl J Med. 1989;320:618–627. [DOI] [PubMed] [Google Scholar]
- 9. Botker HE, Kaltoft AK, Pedersen SF, Kim WY. Measuring myocardial salvage. Cardiovasc Res. 2012;94:266–275. [DOI] [PubMed] [Google Scholar]
- 10. Tseliou E, Pollan S, Malliaras K, Terrovitis J, Sun B, Galang G, Marban L, Luthringer D, Marban E. Allogeneic cardiospheres safely boost cardiac function and attenuate adverse remodeling after myocardial infarction in immunologically mismatched rat strains. J Am Coll Cardiol. 2013;61:1108–1119. [DOI] [PubMed] [Google Scholar]
- 11. Stewart S, Winters GL, Fishbein MC, Tazelaar HD, Kobashigawa J, Abrams J, Andersen CB, Angelini A, Berry GJ, Burke MM, Demetris AJ, Hammond E, Itescu S, Marboe CC, McManus B, Reed EF, Reinsmoen NL, Rodriguez ER, Rose AG, Rose M, Suciu‐Focia N, Zeevi A, Billingham ME. Revision of the 1990 working formulation for the standardization of nomenclature in the diagnosis of heart rejection. J Heart Lung Transplant. 2005;24:1710–1720. [DOI] [PubMed] [Google Scholar]
- 12. Ho CS, Lunney JK, Franzo‐Romain MH, Martens GW, Lee YJ, Lee JH, Wysocki M, Rowland RR, Smith DM. Molecular characterization of swine leucocyte antigen class I genes in outbred pig populations. Anim Genet. 2009;40:468–478. [DOI] [PubMed] [Google Scholar]
- 13. Ho CS, Lunney JK, Lee JH, Franzo‐Romain MH, Martens GW, Rowland RR, Smith DM. Molecular characterization of swine leucocyte antigen class II genes in outbred pig populations. Anim Genet. 2010;41:428–432. [DOI] [PubMed] [Google Scholar]
- 14. Malliaras K, Li TS, Luthringer D, Terrovitis J, Cheng K, Chakravarty T, Galang G, Zhang Y, Schoenhoff F, Van Eyk J, Marban L, Marban E. Safety and efficacy of allogeneic cell therapy in infarcted rats transplanted with mismatched cardiosphere‐derived cells. Circulation. 2012;125:100–112. [DOI] [PMC free article] [PubMed] [Google Scholar]
- 15. Abdel‐Aty H, Zagrosek A, Schulz‐Menger J, Taylor AJ, Messroghli D, Kumar A, Gross M, Dietz R, Friedrich MG. Delayed enhancement and T2‐weighted cardiovascular magnetic resonance imaging differentiate acute from chronic myocardial infarction. Circulation. 2004;109:2411–2416. [DOI] [PubMed] [Google Scholar]
- 16. Aletras AH, Tilak GS, Natanzon A, Hsu LY, Gonzalez FM, Hoyt RF Jr, Arai AE. Retrospective determination of the area at risk for reperfused acute myocardial infarction with T2‐weighted cardiac magnetic resonance imaging: histopathological and displacement encoding with stimulated echoes (DENSE) functional validations. Circulation. 2006;113:1865–1870. [DOI] [PubMed] [Google Scholar]
- 17. Friedrich MG, Abdel‐Aty H, Taylor A, Schulz‐Menger J, Messroghli D, Dietz R. The salvaged area at risk in reperfused acute myocardial infarction as visualized by cardiovascular magnetic resonance. J Am Coll Cardiol. 2008;51:1581–1587. [DOI] [PubMed] [Google Scholar]
- 18. Li TS, Cheng K, Malliaras K, Smith RR, Zhang Y, Sun B, Matsushita N, Blusztajn A, Terrovitis J, Kusuoka H, Marban L, Marban E. Direct comparison of different stem cell types and subpopulations reveals superior paracrine potency and myocardial repair efficacy with cardiosphere‐derived cells. J Am Coll Cardiol. 2012;59:942–953. [DOI] [PMC free article] [PubMed] [Google Scholar]
- 19. Nahrendorf M, Swirski FK, Aikawa E, Stangenberg L, Wurdinger T, Figueiredo JL, Libby P, Weissleder R, Pittet MJ. The healing myocardium sequentially mobilizes two monocyte subsets with divergent and complementary functions. J Exp Med. 2007;204:3037–3047. [DOI] [PMC free article] [PubMed] [Google Scholar]
- 20. de Couto G, Liu W, Tseliou E, Sun B, Makkar N, Kanazawa H, Arditi M, Marbán E. Macrophages mediate cardioprotective cellular postconditioning in acute myocardial infarction. J Clin Invest. 2015;125:3147–3162. [DOI] [PMC free article] [PubMed] [Google Scholar]
- 21. Richardson JD, Bertaso AG, Psaltis PJ, Frost L, Carbone A, Paton S, Nelson AJ, Wong DT, Worthley MI, Gronthos S, Zannettino AC, Worthley SG. Impact of timing and dose of mesenchymal stromal cell therapy in a preclinical model of acute myocardial infarction. J Cardiac Fail. 2013;19:342–353. [DOI] [PubMed] [Google Scholar]
- 22. Rigol M, Solanes N, Roura S, Roque M, Novensa L, Dantas AP, Martorell J, Sitges M, Ramirez J, Bayes‐Genis A, Heras M. Allogeneic adipose stem cell therapy in acute myocardial infarction. Eur J Clin Invest. 2014;44:83–92. [DOI] [PubMed] [Google Scholar]
- 23. Rochitte CE, Lima JA, Bluemke DA, Reeder SB, McVeigh ER, Furuta T, Becker LC, Melin JA. Magnitude and time course of microvascular obstruction and tissue injury after acute myocardial infarction. Circulation. 1998;98:1006–1014. [DOI] [PubMed] [Google Scholar]
- 24. Valina C, Pinkernell K, Song YH, Bai X, Sadat S, Campeau RJ, Le Jemtel TH, Alt E. Intracoronary administration of autologous adipose tissue‐derived stem cells improves left ventricular function, perfusion, and remodelling after acute myocardial infarction. Eur Heart J. 2007;28:2667–2677. [DOI] [PubMed] [Google Scholar]
- 25. Boyle AJ, McNiece IK, Hare JM. Mesenchymal stem cell therapy for cardiac repair. Methods Mol Biol. 2010;660:65–84. [DOI] [PubMed] [Google Scholar]
- 26. Hatzistergos KE, Quevedo H, Oskouei BN, Hu Q, Feigenbaum GS, Margitich IS, Mazhari R, Boyle AJ, Zambrano JP, Rodriguez JE, Dulce R, Pattany PM, Valdes D, Revilla C, Heldman AW, McNiece I, Hare JM. Bone marrow mesenchymal stem cells stimulate cardiac stem cell proliferation and differentiation. Circ Res. 2010;107:913–922. [DOI] [PMC free article] [PubMed] [Google Scholar]
- 27. Artham SM, Lavie CJ, Milani RV, Patel DA, Verma A, Ventura HO. Clinical impact of left ventricular hypertrophy and implications for regression. Prog Cardiovasc Dis. 2009;52:153–167. [DOI] [PubMed] [Google Scholar]
- 28. Malliaras K, Marban E. Cardiac regeneration validated. Nat Biotechnol. 2015;33:587. [DOI] [PubMed] [Google Scholar]
- 29. Davis DR, Zhang Y, Smith RR, Cheng K, Terrovitis J, Malliaras K, Li TS, White A, Makkar R, Marban E. Validation of the cardiosphere method to culture cardiac progenitor cells from myocardial tissue. PLoS One. 2009;4:e7195. [DOI] [PMC free article] [PubMed] [Google Scholar]
- 30. Gago‐Lopez N, Awaji O, Zhang Y, Ko C, Nsair A, Liem D, Stempien‐Otero A, MacLellan WR. THY‐1 receptor expression differentiates cardiosphere‐derived cells with divergent cardiogenic differentiation potential. Stem Cell Reports. 2014;2:576–591. [DOI] [PMC free article] [PubMed] [Google Scholar]
- 31. Smith RR, Barile L, Cho HC, Leppo MK, Hare JM, Messina E, Giacomello A, Abraham MR, Marban E. Regenerative potential of cardiosphere‐derived cells expanded from percutaneous endomyocardial biopsy specimens. Circulation. 2007;115:896–908. [DOI] [PubMed] [Google Scholar]
- 32. Marban E. Breakthroughs in cell therapy for heart disease: focus on cardiosphere‐derived cells. Mayo Clin Proc. 2014;89:850–858. [DOI] [PMC free article] [PubMed] [Google Scholar]
- 33. Frangogiannis NG. Targeting the inflammatory response in healing myocardial infarcts. Curr Med Chem. 2006;13:1877–1893. [DOI] [PubMed] [Google Scholar]
- 34. Maekawa Y, Anzai T, Yoshikawa T, Asakura Y, Takahashi T, Ishikawa S, Mitamura H, Ogawa S. Prognostic significance of peripheral monocytosis after reperfused acute myocardial infarction: a possible role for left ventricular remodeling. J Am Coll Cardiol. 2002;39:241–246. [DOI] [PubMed] [Google Scholar]
- 35. Anzai T, Yoshikawa T, Shiraki H, Asakura Y, Akaishi M, Mitamura H, Ogawa S. C‐reactive protein as a predictor of infarct expansion and cardiac rupture after a first Q‐wave acute myocardial infarction. Circulation. 1997;96:778–784. [DOI] [PubMed] [Google Scholar]
- 36. Engstrom G, Melander O, Hedblad B. Leukocyte count and incidence of hospitalizations due to heart failure. Circ Heart Fail. 2009;2:217–222. [DOI] [PubMed] [Google Scholar]
- 37. Cannon CP, McCabe CH, Wilcox RG, Bentley JH, Braunwald E. Association of white blood cell count with increased mortality in acute myocardial infarction and unstable angina pectoris. OPUS‐TIMI 16 Investigators. Am J Cardiol. 2001;87:636–639, A10. [DOI] [PubMed] [Google Scholar]
- 38. Takahashi T, Hiasa Y, Ohara Y, Miyazaki S, Ogura R, Miyajima H, Yuba K, Suzuki N, Hosokawa S, Kishi K, Ohtani R. Relation between neutrophil counts on admission, microvascular injury, and left ventricular functional recovery in patients with an anterior wall first acute myocardial infarction treated with primary coronary angioplasty. Am J Cardiol. 2007;100:35–40. [DOI] [PubMed] [Google Scholar]
- 39. Marban E, Cingolani E. Heart to heart: cardiospheres for myocardial regeneration. Heart Rhythm. 2012;9:1727–1731. [DOI] [PubMed] [Google Scholar]
- 40. Miki T, Itoh T, Sunaga D, Miura T. Effects of diabetes on myocardial infarct size and cardioprotection by preconditioning and postconditioning. Cardiovasc Diabetol. 2012;11:67. [DOI] [PMC free article] [PubMed] [Google Scholar]
Associated Data
This section collects any data citations, data availability statements, or supplementary materials included in this article.
Supplementary Materials
Video S1. Video of short‐axis cine acquisition of a placebo pig at 1 hour post–placebo infusion.
Video S2. Video of short‐axis cine acquisition of a placebo pig at 2 months post–placebo infusion.
Video S3. Video of short‐axis cine acquisition of a CDC‐treated pig at 1 hour post–CDC infusion.
Video S4. Video of short‐axis cine acquisition of a CDC‐treated pig at 2 months post–CDC infusion.