

Abstract
Background
Existing rodent models of vascular cognitive impairment (VCI) show abrupt changes in cerebral blood flow (CBF) and do not reliably replicate the clinical pathogenesis of VCI. We therefore aimed to develop a mouse model of VCI where CBF is gradually reduced, followed by subsequent progressive motor and cognitive impairment, after surgical intervention.
Methods and Results
Adult C57BL/6J male mice were subjected to gradual common carotid artery stenosis (GCAS) surgery by using an ameroid constrictor vessel‐constricting device with an inner diameter of 0.75 mm. The common carotid arteries narrowed gradually after gradual constriction of ameroid constrictors over 28 days after GCAS, with subsequent 79.3% area stenosis as a result of smooth muscle cell proliferation and macrophage infiltration in the tunica intima. The 28‐day survival rate was 91%. Arterial spin labeling demonstrated gradual and continuous reduction of cortical and subcortical CBF (ratio to the preoperative value) to 54.6% and 51.5%, respectively, over 28 days. However, magnetic resonance angiography showed increment of collateral flow signals in the leptomeningeal artery. Rarefaction and proliferation of astrocytes and microglia, with loss of oligodendrocytes, were found in the white matter at 32 days. Hippocampal neuronal loss was observed in only 25% of GCAS mice, consistent with lack of abnormalities in the Morris water maze test. The rotarod test showed motor impairment, and the Y‐maze test showed working memory deficits.
Conclusions
The GCAS model successfully generated gradual and continuous CBF reduction over 28 days, with replication of key histological, radiological, and behavioral features associated with cerebral hypoperfusion leading to VCI.
Keywords: ameroid constrictor, carotid artery stenosis, mouse, subcortical ischemic vascular dementia, vascular cognitive impairment
Subject Categories: Cognitive Impairment, Cerebrovascular Disease/Stroke, Animal Models of Human Disease, Atherosclerosis, Stenosis
Introduction
Despite the development of a variety of treatments and prophylactic medications, atherosclerotic disease remains a leading cause of mortality and morbidity worldwide.1 In the field of stroke, increased worldwide incidence of carotid artery stenosis/occlusion has resulted from a rise in metabolic disorders through the adoption of a sedentary lifestyle, combined with excessive caloric intake, thereby increasing susceptibility to cerebral infarction and vascular cognitive impairment (VCI).2 VCI is responsible for at least 20% of all causes of dementia and is second only to Alzheimer's disease (AD) in prevalence. However, VCI with concomitant AD pathology has also emerged as an increasing cause of age‐related cognitive impairment.3 Cerebral hypoperfusion is also presumed to accelerate AD pathology.4 Therefore, the mechanisms through which vascular factors affect dementias, including AD, warrant further examination. VCI is a heterogeneous disorder, but about half of all VCI cases can be characterized by ischemic white matter (WM) changes and related motor and cognitive impairment. WM changes can be caused by chronic cerebral hypoperfusion as a result of carotid artery disease or heart failure,5 both of which result in loss of cerebral vasomotor reactivity with blood–brain barrier disruption and glial activation.6
To mimic such pathological conditions, various rodent models of chronic cerebral hypoperfusion have been established through manipulations of the carotid arteries including bilateral common carotid artery (CCA) stenosis in mice or gerbils, unilateral CCA occlusion in mice, and bilateral CCA occlusion in rats.7 The bilateral CCA stenosis (BCAS) model in mice has been frequently used as the most promising model of chronic cerebral hypoperfusion.8 The BCAS model exhibits characteristic features of human hypoperfusive VCI, such as WM rarefaction and gliosis, and working memory impairment. However, this model has an inherent limitation in that cerebral blood flow (CBF) drops sharply immediately after BCAS surgery and then gradually recovers over 1 month, thus failing to reliably replicate “chronic” cerebral hypoperfusion apparent in VCI.9, 10 The contribution of the preceding acute phase to the neuropathological and behavioral consequences is therefore an ongoing concern. We sought to establish a novel mouse model that eliminates the acute phase, where CBF gradually decreases to the level found in the chronic phase by using a device called the ameroid constrictor (AC), which predictably achieves gradual narrowing of the CCAs. It is hoped that the development of such a model will aid in the testing of novel treatments for hypoperfusive VCI in humans.
Methods
Animals
Male C57BL/6J mice aged 10 to 12 weeks (weighing 24–29 g; Japan SLC) were used and given access to food and water ad libitum. All procedures were performed in accordance with the guidelines for animal experimentation from the ethical committee of the National Cerebral and Cardiovascular Center. All surgery was performed under anesthesia, and all efforts were made to minimize suffering. We used moribund conditions as humane end points during the survival study. “Moribund condition” was defined as an irreversible condition leading inevitably to death. Signs of moribundity included (1) lack of responsiveness to manual stimulation, (2) immobility, and/or (3) an inability to eat or drink. In such conditions, animals were euthanized with carbon dioxide asphyxiation.
Study Design
C57BL/6J male mice were assigned into 3 groups based on operative procedure: (1) gradual CCA stenosis (GCAS) surgery with an AC (ID 0.75 mm; Tokyo Instruments) placed on bilateral CCAs (n=22) (Figure 1A), (2) BCAS surgery9 (n=7; cortical surface CBF measurement only), and (3) sham surgery (n=10). Temporal changes of CBF were measured by using laser speckle flowmetry (LSF) (Omegazone; Omegawave) before and at 1, 3, 7, 14, and 28 days after GCAS or BCAS and by using arterial spin labeling (ASL) (7‐T, BioSpec 70/30 USR; Bruker BioSpin) before and at 14 and 28 days after GCAS. Brain magnetic resonance imaging (MRI) (BioSpec 70/30 USR) was performed before and at 14 and 28 days after GCAS. Histological evaluations were performed at 32 days after GCAS or sham surgery. Rotarod, wire hang, and Y‐maze tests were performed at 14 and 28 days after GCAS or sham surgery, and Morris water maze testing was performed at 28 to 32 days after GCAS or sham surgery.
Figure 1.
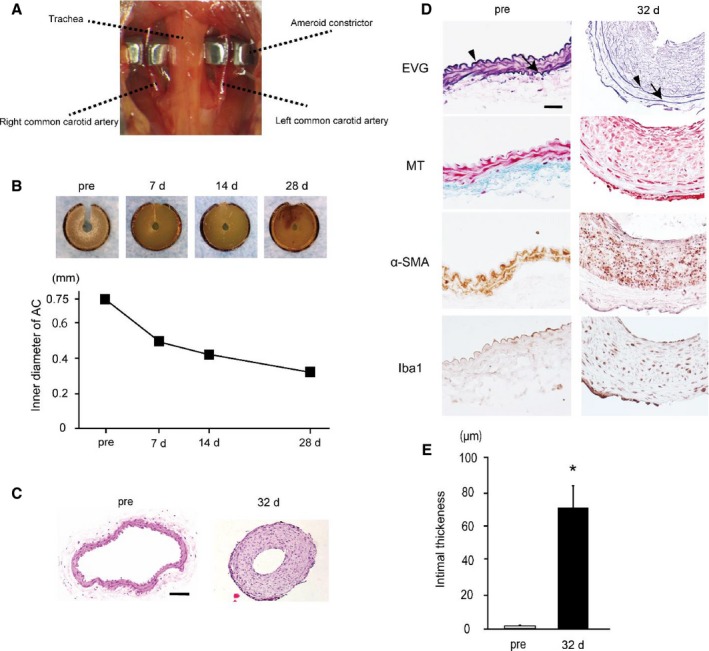
Ameroid constrictors (ACs) induce intimal thickening and luminal stenosis in bilateral common carotid arteries (CCAs). A, An image showing surgical implantation of the ACs on the bilateral CCAs. B, Representative images of ACs at indicated time points showing that a central hole (lumen) gradually narrows. Lower graph shows temporal change of inner diameter of ACs (n=2). C, Representative images of the preoperative (left) and postoperative (right) transverse sections of CCA stained with hematoxylin–eosin. D, Representative images of the preoperative (left) and postoperative (right) transverse sections of CCA stained with elastica van Gieson (EVG), Masson trichrome (MT), α–smooth muscle actin (α‐SMA), and ionized calcium binding adaptor molecule 1 (Iba1) stains. Gradual CCA stenosis (GCAS) surgery induced substantial intimal thickening at 32 days after surgery, although the tunica intima of preoperative CCAs was thin. Arrowheads indicate internal elastic lamina, and arrows external elastic lamina. Scale bars indicate 50 μm (C) and 20 μm (D). E, Histogram showing intimal thickness of CCAs before and after GCAS (n=3). *P<0.01.
Ameroid Constrictor
The ameroid constrictor (AC) consists of a titanium casing surrounding a hygroscopic casein material with an internal lumen. The casein component gradually absorbs water and consequently swells, leading to predictable narrowing of the arterial lumen it encases. The ID and OD were 0.75 mm and 3.25 mm, respectively, and the length was 1.28 mm.
Surgical Implantation of AC
Mice were anesthetized with 1.5% isoflurane. Both CCAs were exposed and freed from their sheaths through a midline cervical incision. A 4‐0 silk suture was placed around the each CCA, the CCAs were lifted gently by the suture, and ACs were implanted surgically on bilateral CCAs (Figure 1A and Video S1). Rectal temperature was maintained between 36.5°C and 37.5°C.
BCAS Surgical Procedure
Mice were anesthetized with 1.5% isoflurane. Following a midline cervical incision, both CCAs were exposed and freed from their sheaths. The CCA was lifted gently with use of a 4‐0 silk suture, and a microcoil with an ID of 0.18 mm (Sawane Spring) was implanted surgically on the CCA bilaterally to induce ≈50% arterial stenosis. Rectal temperature was maintained between 36.5°C and 37.5°C.
CBF LSF Measurement
Relative CBF was determined by LSF, which enables high‐resolution 2‐dimensional imaging and has a linear relationship with absolute CBF values.11 Recordings were performed through the skull under anesthesia with 1.5% isoflurane. The majority of periosteum, which adheres to the skull, was removed with fine‐tip forceps. For each recording, the skull surface was wiped with saline‐soaked gauze. Calibration was carried out with a calibration reference device (Calibrator S/N 080715‐5; Omegawave) before each test. The mean CBF was measured in identically sized regions of interest (900 pixels), located 1 mm posterior and 2 mm lateral from the bregma. CBF values were presented as a percentage of the preoperative value.
Magnetic Resonance Imaging
All MRI was performed on a 7‐T horizontal bore imaging system (BioSpec 70/30 USR) equipped with a gradient system capable of a maximum gradient amplitude of 669 mT/m and a slew rate of 7989 T/m per second. Radiofrequency transmission was performed by using an 86‐mm ID volume coil. Signal was detected by using a 4‐channel receive‐only phased‐array surface coil. Mice were anesthetized with isoflurane (4% for induction and 1.5–1.8% for maintenance) in 1.2 L/min room air mixed with 0.1 L/min oxygen. The animal was placed in a prone position, and the head was secured with a bite bar and ear bars. Body temperature was monitored by rectal thermometer and maintained with a warm waterbed and warm air. Heart rate and respiratory rate were continuously monitored. T2‐weighted images were acquired using rapid acquisition with relaxation enhancement (RARE) sequence with the following parameters: RARE factor, 8; repetition time (TR)/echo time (TE), 3500/28.74 ms; number of averages, 2; matrix size, 200×200; field of view (FOV), 2.0×2.0 cm2; in‐plane spatial resolution, 100×100 μm2; slice thickness, 0.5 mm; gapless; number of slices, 35; and scan time, 2 minutes 55 seconds. Three‐dimensional (3D) time‐of‐flight (TOF) magnetic resonance angiography (MRA) images were acquired by using a fast low angle shot sequence with the following parameters: TR/TE, 22.43/3.30 ms; number of averages, 1; matrix size, 200×200×200; FOV, 2.0×2.0×2.0 cm3; spatial resolution, 100×100×100 μm3; and scan time, 11 minutes 13 seconds. In 3D TOF MRA, tilted optimized nonsaturating excitation pulse and flow compensation were used. Maximum intensity projection images were reconstructed with the use of AZEWIN (AZE, Ltd).
CBF measurement of coronal slices was carried out by using a flow‐sensitive alternating inversion recovery technique,12, 13 an ASL‐based method. In each of the nonselective and slice‐selective experiments, 22 images with different inversion times were acquired by using a RARE sequence with the following parameters: RARE factor, 72; TR/TE, 10 000/46 ms; number of averages, 1; matrix size, 128×128; FOV, 4.0×4.0 cm2; in‐plane spatial resolution, 313×313 μm2; slice thickness, 1.0 mm; and number of slices, 1. The following inversion time values were used: 30, 100, 200, 300, 400, 500, 600, 700, 800, 900, 1000, 1100, 1200, 1300, 1400, 1500, 1600, 1700, 1800, 1950, 2100, and 2300 ms. Total scan time was 8 minutes 24 seconds. The CBF image was calculated from the obtained 44 images by using ParaVison 5.1 (Bruker BioSpin). The CBF images of 2 coronal slices (bregma level and hippocampus level [bregma level −2.0 mm]) were acquired. Region of interest analyses of CBF images were carried out by using the Dr View/LINUX R2.5.0 program (Asahi Kasei Information System). In the corresponding slices of the T2‐weighted image, circular regions of interest with a diameter of 1 mm were symmetrically placed on the cerebral cortex region and the subcortical region, including the corpus callosum (CC), caudoputamen, and hippocampus, and superimposed on CBF images. CBF values were expressed as a percentage of the preoperative value.
Histological Evaluation
Mice were deeply anesthetized with an intraperitoneal injection of sodium pentobarbital (40 mg/kg) and transcardially perfusion‐fixed with 0.01 mol/L phosphate‐buffered saline and then 4% paraformaldehyde. Brains were removed and divided coronally at the bregma and bregma −2 mm through the hippocampus, and the bilateral CCAs were removed. Brains were embedded in paraffin and sliced into 6‐μm‐thick coronal sections, and the CCAs were cut into 2‐μm‐thick transverse sections. Hematoxylin–eosin, elastica van Gieson (EVG), Masson trichrome (MT), and Klüver–Barrera (KB) stains were used to observe any histological changes, including intimal thickening of CCAs and brain ischemic changes. The severity of WM lesions was graded as normal (grade 0), disarrangement of the nerve fibers (grade 1), formation of marked vacuoles (grade 2), and disappearance of myelinated fibers (grade 3), as previously described.14 For immunohistochemical detection, mouse anti–α‐smooth muscle actin (α‐SMA) antibody (a marker of vascular smooth muscle cells, 1:200; DAKO), rabbit anti–glial fibrillary acidic protein (GFAP) antibody (a marker of astrocytes, 1:2000; DAKO), rabbit anti‐ionized calcium binding adaptor molecule 1 (Iba1) antibody (a marker of microglia and macrophages, 1:200; Wako), rabbit anti–glutathione‐S‐transferase‐π (GST‐π) antibody (a marker of oligodendrocytes, 1:100; Merck Millipore), and NeuN (1:100; Merck Millipore) antibodies were used. Percentage of luminal area stenosis of the CCAs, intimal thickness of the CCAs, and percentage area of GFAP‐positive astrocytes, Iba1‐positive microglia, and GST‐π–positive oligodendrocytes in the CC were calculated by using the ImageJ software package (National Institutes of Health).
Rotarod Test
The rotarod test was performed at 14 and 28 days after GCAS or sham surgery by placing the mouse on a rotating drum (Muromachi Kikai) and measuring the time that balance was maintained on the rod, as previously described.10 Rotarod speed was accelerated from 4 to 40 rpm over a 5‐minute period. The test was repeated 5 times with an interval of 5 minutes between attempts.
Wire Hang Test
The wire hang test was performed at 14 and 28 days after GCAS or sham surgery, as previously described.15 A metallic wire (2 mm×60 cm) was secured to the top of a transparent, rectangular, open‐topped plastic box (30‐cm height×60‐cm width×40‐cm length). The wire was tightly fixed to the top of the tank to avoid vibration, which could interfere with the performance of mouse. Mice were placed on the metallic wire and latency to fall was recorded. This was repeated 5 times with an interval of 5 minutes between attempts. Mean latency to fall was determined.
Y‐Maze Test
Spatial working memory and spontaneous activity was assessed by the Y‐maze test, as described previously.16 The Y‐maze test was conducted during the dark period (7–11 pm) at 14 and 28 days after GCAS or sham surgery. The maze consisted of 3 identical arms (40 cm long, 9.5 cm high, and 4 cm wide), labeled A, B, or C, diverging at 120° angles from a central point. The experiments were performed in a dimly illuminated room. After each mouse was tested, the floor of the maze was cleaned using super hypochlorous water‐soaked paper for the elimination of smell to avoid olfactory cues. Each mouse was placed at the end of the start arm and allowed to move freely through the maze during an 8‐minute session without reinforcers such as food, water, or electric foot shock. The sequence of arm entries was manually recorded. A mouse was considered to have entered an arm when all 4 paws were positioned in the arm runway. An alternation was defined as entry into all 3 arms on consecutive occasions (eg, the sequence, ABCBCBCA was counted as 2 alternations, with the first consecutive ABC and the last consecutive BCA out of 6 consecutive occasions; 33% alternations). The maximum alternation was calculated as the total number of arm entries minus 2, and the percentage of alternation was calculated as (actual alternation/maximum alternation)×100. The total number of arms entered during the sessions, which reflects spontaneous activity, was also recorded. Mice that entered arms less than 8 times during the test were eliminated because their data were not considered to reflect precise alternation.
Morris Water Maze Test
The Morris water maze test was performed at 28 to 32 days after GCAS or sham surgery, as previously reported.15 The Morris water maze test consisted of a circular pool (diameter 120 cm, depth 40 cm) and a set of video analysis systems (EthoVision XT5; Noldus). The pool was filled with water containing nontoxic white paint to a depth of 30 cm. A clear, circular platform (diameter 8 cm) was submerged 1 cm below the water surface in the center of 1 quadrant of the pool (target quadrant). A red cross sign and blue upward arrow at the opposite side of red cross sign were used as orientation cues for swimming. During the first 4 days, we performed 4 trials per day with a 5‐minute interval between attempts (acquisition phase). The platform was kept in the same position during the acquisition phase. Mice were placed at the starting position (the quadrant adjacent to the target one; cf. Zone 2 at Figure 8C) and released into the water. Each mouse was allowed to swim for 60 seconds, discover the hidden platform, and climb onto it. The trial was immediately terminated after the mouse arrived on the platform or after 60 seconds had elapsed. If a mouse succeeded in climbing onto the platform, it was permitted to remain there for 10 seconds. If a mouse did not reach the platform within 60 seconds, it was placed on the platform and allowed to remain there for 15 seconds. Latency to reach the platform (escape latency) and mean swimming speed were recorded. On day 5 (the last day), mice were subjected to a probe trial session in which the platform was removed from the pool and the mice allowed to swim for 60 seconds to search for it. The duration of swimming in each quadrant was recorded.
Statistical Analysis
Statistical analysis was conducted by using StatView (SAS Institute). All values are expressed as mean±SEM in the figures. Data were analyzed with the Mann–Whitney U test for comparison of 2 groups, 1‐way ANOVA followed by the Bonferroni correction, as a post hoc test for comparison of more than 2 groups or 2‐way repeated‐measures ANOVA for comparison of temporal changes of CBF and behavioral performances. Differences with P<0.05 were considered statistically significant in all analyses.
Results
Mortality Rates
All mice subjected to BCAS and sham surgery survived until 32 days after surgery, and 20 of 22 GCAS mice survived for 32 days after GCAS (survival rate 91%).
Gradual Narrowing of CCAs Subjected to ACs
Placement of the ACs on the bilateral CCAs produced the expected narrowing of the inner lumen (Figure 1B). The AC gradually narrowed up to 28 days postoperation without corrosion and induced 57.0% stenosis in diameter (Figure 1B). Notably, hematoxylin–eosin staining of CCAs showed substantial hypertrophy of arterial wall and 79.3% luminal area stenosis compared with preoperative CCAs (Figure 1C). We further evaluated the tissues with EVG and MT stains and immunohistochemistry for α‐SMA and Iba1. CCAs subjected to ACs over 32 days showed EVG‐stained intimal thickening (72.3 μm), with α‐SMA–positive smooth muscle cell migration into the tunica intima and infiltration of macrophages, which was not accompanied by increase of collagen fiber in the tunica intima as determined by MT stain, although preoperative CCAs showed that the tunica intima inside internal elastic lamina was thin, measuring only 1.4 μm in thickness on average (Figure 1D and 1E). These findings suggest that intimal hypertrophic change was induced in CCAs, similarly observed in early‐stage atherosclerotic change.
Temporal Profiles of Cortical Surface CBF Recorded with LSF
At 1 day after BCAS surgery, cortical surface CBF dropped sharply to 72.4% of the baseline level and started to recover at 3 days, reaching 82.5% at 28 days. In contrast, in the GCAS group, the acute phase observed in the BCAS group was absent, and the CBF was significantly higher than the CBF of the BCAS group at days 1 and 3 after surgery. However, CBF in the GCAS group continued to decrease and was significantly lower than that of the BCAS group at 28 days after surgery (GCAS 70.8% versus BCAS 82.5%) (Figure 2A and 2B).
Figure 2.
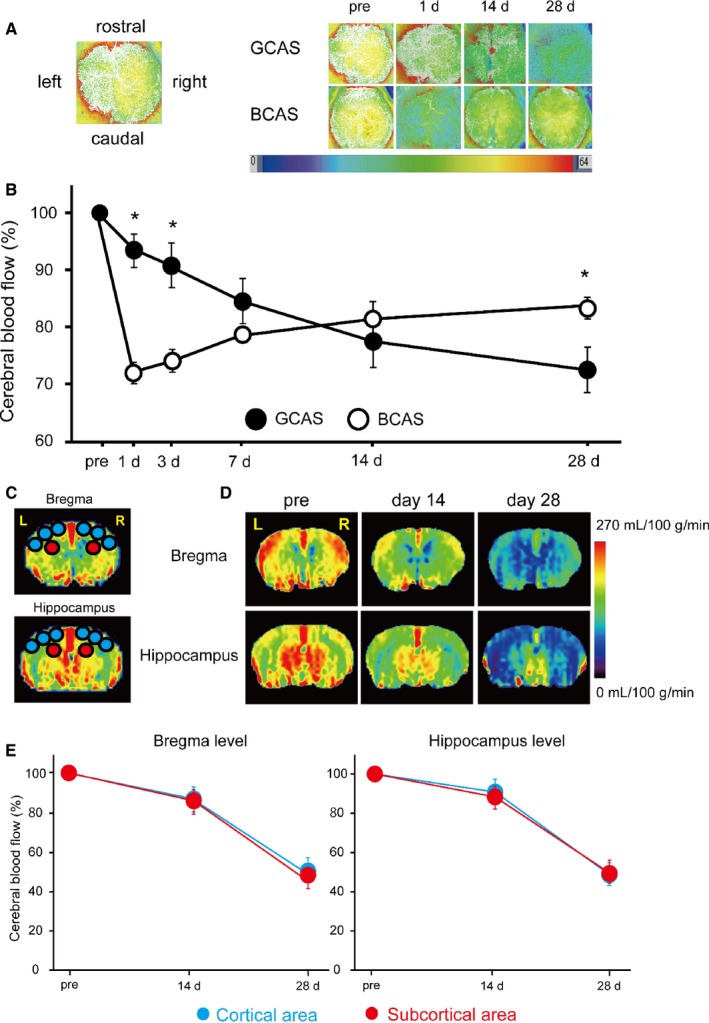
Temporal profiles of cerebral blood flow (CBF) in mice subjected to gradual common carotid artery stenosis (GCAS). A and B, Representative images of laser speckle flowmetry (A) and temporal profiles of cortical surface CBF (B) in mice subjected to GCAS (n=12) and bilateral CCA stenosis with microcoils (bilateral CCA stenosis [BCAS]; n=7). The levels of cortical surface CBF estimates at indicated time points (before, and 1, 3, 7, 14, and 28 days after each surgery) are shown as percentage of the baseline CBF. Two groups were not significantly different in 2‐way repeated‐measures ANOVA. *P<0.01, GCAS vs BCAS at indicated each time point. C, Regions of interest (ROIs) used for measurement of CBF images obtained from arterial spin labeling (ASL) magnetic resonance perfusion imaging. The CBF values in cerebral cortical area were calculated from the 6 circular ROIs in blue and those in the subcortical area from the 2 circular ROIs in red. D, Representative multislice coronal CBF images obtained from ASL at the bregma and hippocampal levels pre‐GCAS surgery and at 14 and 28 days after GCAS surgery. E, Their temporal profiles of CBF in the cortical (blue) and subcortical areas (red) of GCAS mice (n=4). Two groups were not significantly different at the bregma and hippocampus levels.
Temporal Profiles of Regional CBF Recorded with ASL
One of the features of VCI and subcortical ischemic vascular dementia is chronic cerebral hypoperfusion in the deep brain tissue supplied by end arteries. We thus explored CBF in deep brain structures after GCAS and performed ASL before and after GCAS. Cortical and subcortical CBF gradually decreased up to 28 days after GCAS (Figure 2C through 2E). Temporal profiles of subcortical CBF levels were almost comparable to those of cortical CBF at both the bregma and hippocampal levels over 28 days after GCAS. At the bregma level, the subcortical CBF at days 14 and 28 was 86.8% and 51.5%, while the cortical CBF was 86.7% and 54.6%, respectively, of baseline CBF.
Intracranial MRA Signal Was Gradually Decreased in GCAS Mice
LSF showed that the cortical surface CBF was 70.8% of the baseline at 28 days after GCAS but ASL showed that the cortical and subcortical CBF was ≈50% of the baseline (Figure 2), prompting us to visualize vascular flow with MRA to identify the cause of the difference in the CBF levels. At days 14 and 28 after GCAS, the signals of bilateral internal carotid arteries, middle cerebral arteries, and anterior cerebral arteries became fainter, reflecting gradually reduced flow of anterior circulation in the intracranial arteries. In contrast, collateral flow signals to anterior circulation from posterior cerebral arteries on the brain surface began to appear at day 14 and became stronger at day 28 after GCAS, and the signals of posterior communicating arteries became stronger at days 14 and 28 after GCAS (Figure 3). The presence of collateral flow explains the difference in CBF levels at 28 days measured with the 2 modalities: the cortical surface CBF assessed by using LSF was compensated by collateral flow to some degree, but parenchymal (cortical and subcortical) CBF assessed by using ASL was not.
Figure 3.
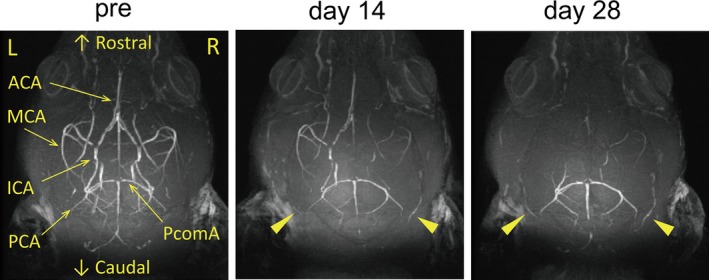
Gradual reductions of intracranial arterial flow signals after gradual common carotid artery stenosis (GCAS). Representative images of intracranial arterial flow signals obtained from 7‐T brain magnetic resonance angiography before GCAS (left), and at 14 days (middle) and 28 days (right) after GCAS. Arrowheads indicate gradual increment of collateral flow signals from posterior cerebral artery (PCA) to anterior circulation. ACA indicates anterior cerebral artery; ICA, internal carotid artery; MCA, middle cerebral artery; PcomA, posterior communicating artery.
Histological Changes of Brains
Semiquantitative analysis of the grading score of KB staining in the CC, the anterior commissure (ACo) and the optic tract (OT) showed that WM damage was significantly more severe in the GCAS group compared with the sham‐surgery group. The grading of WM rarefaction after GCAS was grade 1 to 3 in the CC, grade 1 or 2 in the ACo, and grade 0 or 1 in the OT. Therefore, the WM changes in the OT were significantly less severe than the CC and the ACo (Figure 4A). The OT can be vulnerable to CCA stenosis and occlusion in rodents, and the rat bilateral CCA occlusion model exhibits severe degeneration and atrophy of the OT.17 It is possible that the visual system impairment could compromise the motor and cognitive function test such as rotatod test, Y‐maze test, and Morris water maze test, because visual cues contribute to discrimination even in the rat bilateral CCA occlusion model.10 In the GCAS model, WM rarefaction in the OT is significantly less developed than that in the CC and ACo; thus, it appears that the visual system is preserved, as is the case with the BCAS model.9, 10 Demyelination in the CC was accompanied by significant proliferation of GFAP‐positive astrocytes and Iba1‐positive microglia in GCAS mice compared with sham‐surgery mice. The amount of GST‐π–positive oligodendrocytes tended to decrease in GCAS mice compared with sham‐surgery mice at day 32 (Figure 4B). Immunohistochemistry for NeuN in hippocampus showed that hippocampal neuronal loss was observed in only 3 (25%) of 12 GCAS mice, and the area was surrounded by activated astrocytes and microglia (Figure 5). In addition, there were only a few cerebral microinfarctions in the caudoputamen, CC, or cerebral cortex in 4 of 12 GCAS mice (data not shown). These results suggest that GCAS mice exhibit histological changes mainly as a result of chronic oligemia rather than acute ischemic changes.
Figure 4.
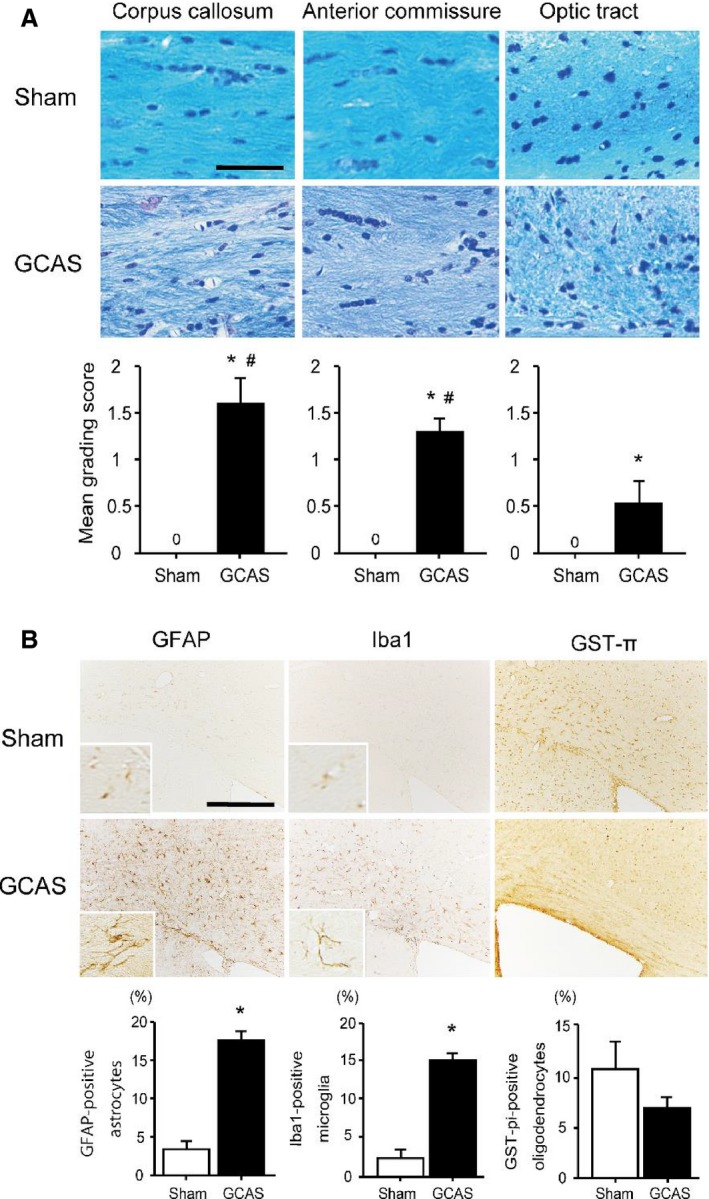
Hypoperfusive brain injury evident in the white matter (WM). A, Representative photomicrographs of the Klüver–Barrera staining of the paramedial part of the corpus callosum (CC), anterior commissure, and optic tract from the brain of sham‐surgery and gradual common carotid artery stenosis (GCAS) mice at 32 days after each surgery. Lower line graphs show temporal profiles of the grade of WM changes in the respective WM regions. B, Representative photomicrographs of immunostain for glial fibrillary acidic protein (GFAP), ionized calcium binding adaptor molecule 1 (Iba1), and glutathione‐S‐transferase‐π (GST‐π) at the paramedial part of CC from the brain of the sham‐surgery and GCAS mice at 32 days after each surgery. Lower line graphs show temporal profiles of the %numerical densities of the GFAP‐positive astrocytes, Iba1‐positive microglia, and GST‐π–positive oligodendrocytes from the brains of sham‐surgery and GCAS mice at day 32 after each surgery. Scale bars indicate 50 μm in (A) and 200 μm in (B). *P<0.01 vs sham; # P<0.01 vs optic tract.
Figure 5.
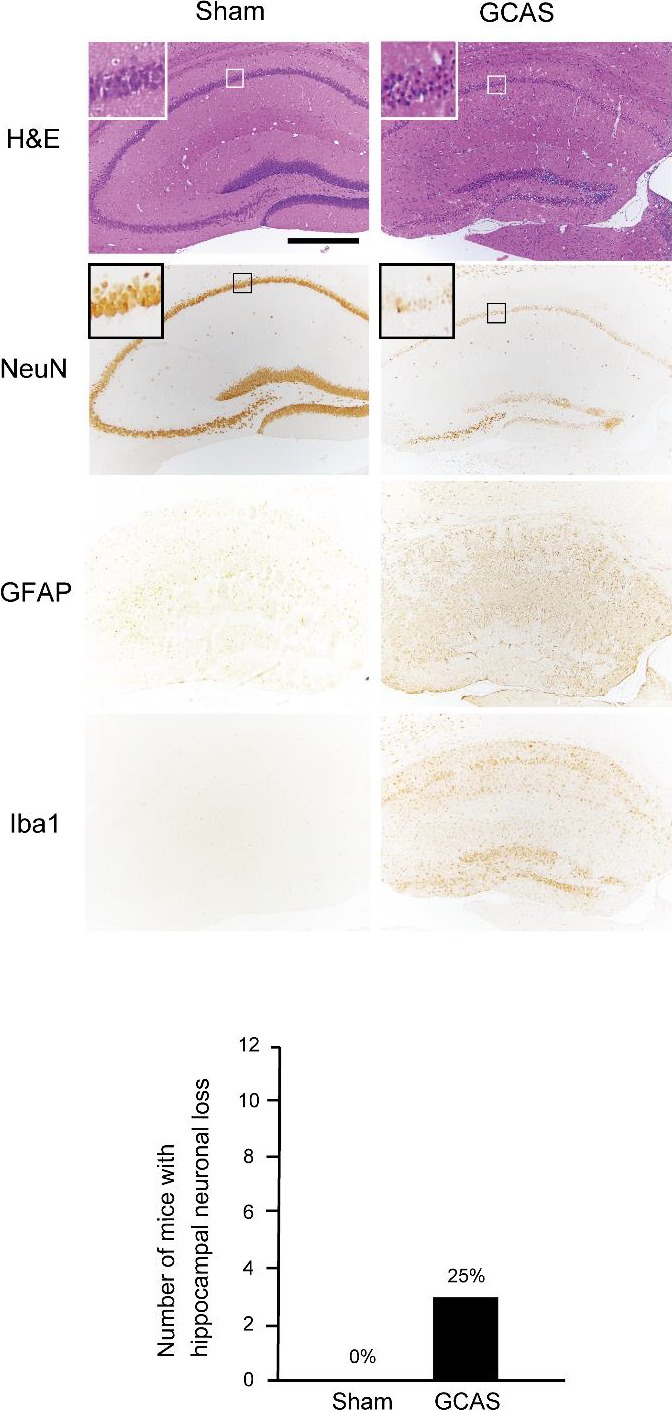
Only 25% of mice subjected to gradual common carotid artery stenosis (GCAS) surgery showed hippocampal neuronal loss. A GCAS mouse showed hippocampal neuronal loss in hematoxylin–eosin (H&E) stain and NeuN immunohistochemistry. Hippocampal neuronal loss was surrounded by GFAP‐positive astrocytes and Iba1‐positive microglia. The lower line histogram shows number of mice with hippocampal neuronal loss. Hippocampal neuronal loss was seen in only 3 of 12 GCAS mice and no sham‐surgery mice (sham‐surgery, n=10; GCAS mice, n=12).
Rotarod Test and Wire Hang Test for Motor Function Assessment
The rotarod test showed that latency to fall was significantly shorter in GCAS group at day 28, compared to GCAS group at day 14 and sham‐surgery group, indicating that motor coordination and balance were significantly impaired in GCAS mice at day 28 (Figure 6A). Similarly, a significantly shorter latency to fall was found in wire hang testing in GCAS group at day 28, compared with GCAS group at day 14 and sham‐surgery group, indicating that muscle strength was significantly impaired in GCAS mice at day 28 after surgery (Figure 6B).
Figure 6.
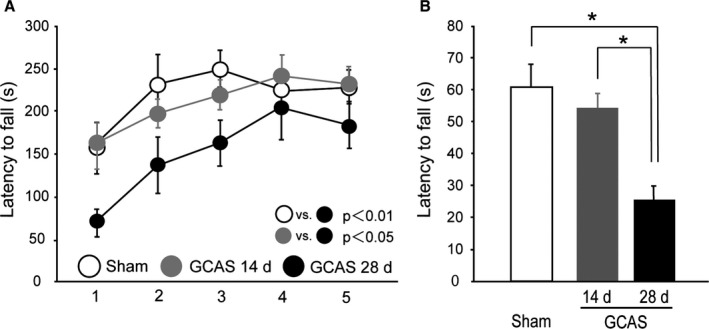
Impaired motor performance of gradual common carotid artery stenosis (GCAS) mice in rotarod and wire hang tests. A, Motor coordination and balance tested with 5 consecutive trials of rotarod test on days 14 and 28. B, Neuromuscular strength tested with wire hang test on days 14 and 28. *P<0.01. All the behavioral studies were performed in the GCAS mice at day 14 (n=8) and day 28 (n=12), and sham‐surgery mice (n=10).
Y‐Maze Test for Spatial Working Memory and Spontaneous Activity Assessment
We examined whether the GCAS mice showed impairment in spatial working memory and spontaneous activity by using the Y‐maze test. In the GCAS group, the percentage of alternation behaviors (used as an indicator of spatial working memory) was significantly decreased at day 28, compared with sham‐surgery mice. The number of arm entries (a marker of spontaneous activity) of GCAS mice was comparable to that of the sham‐surgery mice. These results indicated that spatial working memory was impaired in GCAS mice at day 28 but not at day 14 after surgery (Figure 7).
Figure 7.
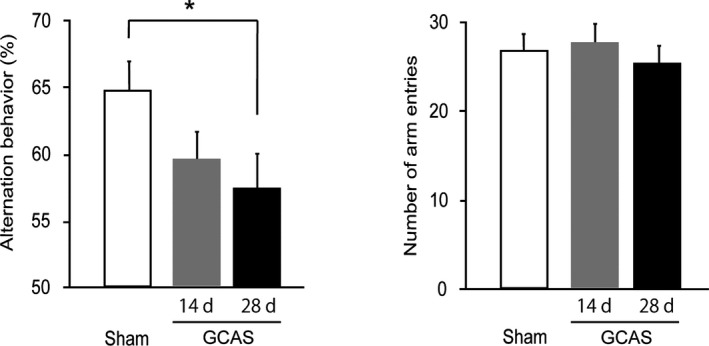
Impaired working memory of gradual common carotid artery stenosis (GCAS) mice in Y‐maze test. Spatial working memory and spontaneous activity were tested with Y‐maze test on days 14 and 28. GCAS mice at day 28 showed spatial working memory impairment but no spontaneous activity alterations. All the behavioral studies were performed in the GCAS mice at day 14 (n=8) and day 28 (n=12), and sham‐surgery mice (n=10). *P<0.05.
Morris Water Maze Test for Reference Memory Assessment
We next examined whether GCAS mice showed spatial learning and reference memory impairment by using the Morris water maze test. GCAS mice exhibited almost the same escape latencies as the sham‐surgery mice throughout the acquisition phase (Figure 8A). The swimming speed did not differ between GCAS and sham‐surgery mice during the acquisition phase (Figure 8B). In the probe trial, both GCAS and sham‐surgery mice spent a significantly greater time in Zone 1 (the target quadrant) than in other quadrants (Figure 8C). Examination of traces of swimming paths in the probe trial showed that both GCAS and sham‐surgery mice selectively searched the correct quadrant (Figure 8D). These results indicated that GCAS mice maintained hippocampus‐dependent reference learning and memory, reflecting minimal damage to the hippocampus.
Figure 8.
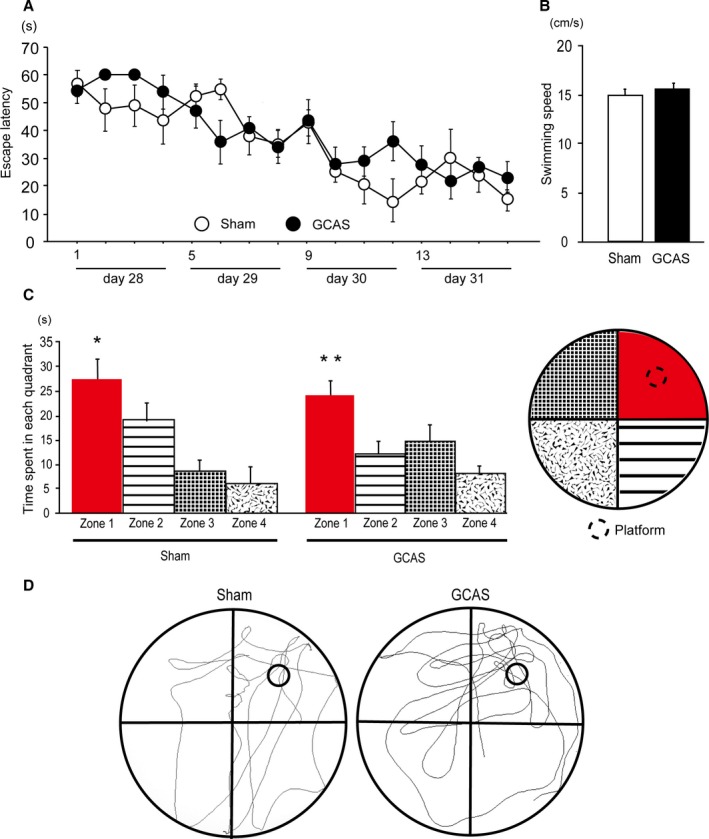
Preserved reference learning and memory of gradual common carotid artery stenosis (GCAS) mice in the Morris water maze test. A, Time course of escape latency from day 1 to 4 of sham‐surgery and GCAS mice in the acquisition phase is shown; no significant difference was found between the 2 groups. B, Mean swimming speed in the acquisition phase was not different between the 2 groups. C, Histogram showing the time spent in each quadrant in the probe trial. *P<0.05 vs Zones 2, 3, and 4. **P<0.01 vs Zones 2, 3, and 4. D, Representative images of traces of the swimming paths of 2 groups in the probe trial. The Morris water maze test was performed in the GCAS mice (n=12) and the sham‐surgery mice (n=10).
Discussion
We have established a novel mouse model of long‐term hypoperfusion (the GCAS model), which circumvents the acute CBF drop and resultant acute inflammatory response that are observed in the BCAS model. The GCAS model showed a gradual continuous decrease in CBF over 28 days, accompanied by WM ischemic injury, and motor and working memory impairment at 32 days after surgery, which replicated the main features of VCI. Thus, the application of ACs with an ID of 0.75 mm on bilateral CCAs in C57BL/6J mice more precisely replicated chronic cerebral hypoperfusion than BCAS mice. Further, gradual CCA stenosis was noted, with AC‐induced intimal thickening as a result of migration of smooth muscle cells and invasion of macrophages into tunica intima, with subsequent (≈80%) luminal area stenosis, mimicking early‐stage atherosclerosis. Taken together, GCAS model mice replicate hypoperfusive brain injury as a result of the carotid stenosis and subsequent motor and cognitive impairment as observed in human VCI.
Thus far, many rodent models of VCI have been developed based on surgical interventions such as chronic cerebral hypoperfusion models (eg, bilateral CCA occlusion in rats, bilateral CCA stenosis in gerbils, unilateral CCA occlusion in mice, and BCAS in mice), transient global hypoperfusion models (eg, 4‐vessel occlusion in rats and bilateral CCA occlusion in mice or gerbils), and focal stroke models (eg, middle cerebral artery occlusion, an endothelin‐1 injection, photo‐activated thromboemboli or injected emboli in mice or rats).7 However, even the BCAS model, currently the most promising model of VCI,8 does not sufficiently replicate the characteristic features of VCI in that the model shows acute CBF drop after the CCA manipulation followed by spontaneous recovery of CBF. Thus, it has remained unknown whether the etiology of hypoperfusive or ischemic brain injury (eg, WM rarefaction/gliosis) and cognitive impairment after surgery is either derived from acute hemodynamic change or sustained though partially recovered hypoperfusion. In contrast, the current GCAS model consistently showed gradual and continuous CBF reduction and consistent “chronic” cerebral hypoperfusion by using ACs with an ID of 0.75 mm.
We have recently established a model of WM infarct damage called the ACAS (asymmetric CCA surgery) model by placing an AC with an ID of 0.5 mm on the right CCA and a microcoil with an ID of 0.18 mm on the left CCA.18 The ACAS model exhibits gradual but more profound CBF reduction than the GCAS model. We can therefore alternately use 2 different mouse models with varying severities of WM damage induced by gradual CBF reduction, depending on the purpose of our research. In addition, these 2 models may be used complementarily to reflect the heterogeneous nature of VCI. As the Stroke Therapy Academic Industry Roundtable has proposed, a drug should be effective in at least 2 animal models to facilitate the translation of drugs from the bench to clinical trials. Therefore, preclinical experiments using both the GCAS and ACAS models may provide scientific evidence and rationale to proceed to clinical trials for VCI.
Placing smaller ACs with an ID of 0.5 mm bilaterally on the CCAs induces gradual CCA occlusion, with a substantial CBF reduction and multiple cerebral infarctions, meaning mortality rate reaches ≈60% at 1 month after surgery. This model mimics carotid artery occlusive disease in humans, where multiple cerebral infarctions and motor and cognitive impairment develop, making it useful for exploring novel treatments of severe carotid artery diseases.2, 15 On the other hand, placement of ACs with an ID of 0.75 mm caused just narrowing of the CCAs with area stenosis by ≈80% but did not occlude at 1 month after GCAS. These results suggest that gradual continuous CBF reduction with ACs with larger ID successfully induces bilateral gradual stenosis of CCAs with the histological features of early‐phase atherosclerosis.
Many animal models of atherosclerotic disease have been established, the most widely used being the genetically modified apolipoprotein E–deficient mouse model, in which targeted deletion of the apoE gene leads to severe hypercholesterolemia and spontaneous atherosclerosis. However, CCAs of apolipoprotein E–deficient mice do not show atherosclerotic lesions or wall thickening despite spontaneously developed pronounced lesions in the aortic arch and external carotid arteries.19 Low‐density lipoprotein receptor–deficient mice develop atherosclerosis, especially when fed a lipid‐rich diet. However, they do not spontaneously develop apparent structural changes in the arteries and require placement of perivascular carotid collar for the development of carotid stenosis.20 Other surgically induced models include mice subjected to a perivascular carotid collar placed around artery and an inflatable balloon‐induced inner lumen injury. These surgical procedures induce acute arterial stenosis after implantation of a perivascular carotid collar or sudden mechanical injury of the media and the elastic lamina immediately after a balloon dilation, which do not always mimic gradual development of atherosclerosis and resultant stenosis in humans.21 Although GCAS mice do not show foam cells or calcification in the CCAs, gradual intimal thickening with external placement of ACs was noted, accompanied by radiological, histological, and behavioral findings as a result of hemodynamic changes in the brain. A more precise model may be generated in future study by using mice fed a high‐fat diet or apolipoprotein E–deficient mice subjected to the placement of ACs.
The clinical manifestations of VCI generally include motor deficits and features of executive dysfunction such as working memory. Executive dysfunction is attributed to the interruption of prefrontal‐subcortical circuitry from ischemic change, mainly resulting from widespread incomplete WM infarction or leukoaraiosis, as a result of arteriolar occlusion/stenosis and cerebral hypoperfusion,22 clinically called Binswanger's disease. GCAS mice experienced working memory impairment with histological findings of WM rarefaction and gliosis. The preserved reference memory in GCAS mice is a consequence of the relative sparing of the hippocampus, which contrasts with early changes observed in AD. Hence, the GCAS model specifically mimics the clinical manifestation of VCI resulting from hypoperfusive brain injury.
In summary, we have produced a novel mouse model of VCI with ACs placed on the CCAs showing gradual and continuous CBF reduction as a result of carotid stenotic lesions. This is linked to subsequent hypoperfusive brain injury, especially in the WM, and motor and cognitive impairment. We believe that this model could be used for future exploitation of treatments for VCI.
Sources of Funding
This work was supported by grant support from the Ministry of Health, Labour and Welfare (Ihara, No. 0605‐1), the Ministry of Education, Culture, Sports, Science and Technology (Ihara, Grant‐in‐Aid for Scientific Research (B), No. 23390233; Hattori, Grant‐in‐Aid for Challenging Exploratory Research, No. 26640034; Enmi, Grant‐in‐Aid for Scientific Research (C), No. 25461867), and the Takeda Science Foundation (Ihara).
Disclosures
None.
Supporting information
Video S1. Surgical implantation of ameroid constrictor (AC). Through a midline cervical incision, a left common carotid artery (CCA) is exposed and freed from their sheaths including left vagus nerve. A 4‐0 silk suture is placed around the CCA. The artery was gently lifted by this suture, the AC is implanted surgically on the CCA, and the suture is removed.
Acknowledgments
We thank Dr Ahmad Khundakar for editing the manuscript and are indebted to Ms Takako Kawada and the late Dr Yoko Okamoto for their excellent technical assistance in staining and tissue sections. We also acknowledge Masako Kunimi for supporting the magnetic resonance imaging experiments.
(J Am Heart Assoc. 2016;5:e002757 doi: 10.1161/JAHA.115.002757)
An accompanying Video S1 is available at http://jaha.ahajournals.org/content/5/2/e002757/suppl/DC1
References
- 1. Kapourchali FR, Surendiran G, Chen L, Uitz E, Bahadori B, Moghadasian MH. Animal models of atherosclerosis. World J Clin Cases. 2014;2:126–132. [DOI] [PMC free article] [PubMed] [Google Scholar]
- 2. Hattori Y, Kitamura A, Nagatsuka K, Ihara M. A novel mouse model of ischemic carotid artery disease. PLoS One. 2014;9:e100257. [DOI] [PMC free article] [PubMed] [Google Scholar]
- 3. Iadecola C. The pathobiology of vascular dementia. Neuron. 2013;80:844–866. [DOI] [PMC free article] [PubMed] [Google Scholar]
- 4. Kalaria RN, Akinyemi R, Ihara M. Does vascular pathology contribute to Alzheimer changes? J Neurol Sci. 2012;322:141–147. [DOI] [PubMed] [Google Scholar]
- 5. Roman GC. Vascular dementia: distinguishing characteristics, treatment, and prevention. J Am Geriatr Soc. 2003;51:S296–S304. [DOI] [PubMed] [Google Scholar]
- 6. Kitamura A, Fujita Y, Oishi N, Kalaria RN, Washida K, Maki T, Okamoto Y, Hase Y, Yamada M, Takahashi J, Ito H, Tomimoto H, Fukuyama H, Takahashi R, Ihara M. Selective white matter abnormalities in a novel rat model of vascular dementia. Neurobiol Aging. 2012;33:1012.e25‐e35. [DOI] [PubMed] [Google Scholar]
- 7. Jiwa NS, Garrard P, Hainsworth AH. Experimental models of vascular dementia and vascular cognitive impairment: a systematic review. J Neurochem. 2010;115:814–828. [DOI] [PubMed] [Google Scholar]
- 8. Bink DI, Ritz K, Aronica E, van der Weerd L, Daemen MJ. Mouse models to study the effect of cardiovascular risk factors on brain structure and cognition. J Cereb Blood Flow Metab. 2013;33:1666–1684. [DOI] [PMC free article] [PubMed] [Google Scholar]
- 9. Shibata M, Ohtani R, Ihara M, Tomimoto H. White matter lesions and glial activation in a novel mouse model of chronic cerebral hypoperfusion. Stroke. 2004;35:2598–2603. [DOI] [PubMed] [Google Scholar]
- 10. Shibata M, Yamasaki N, Miyakawa T, Kalaria RN, Fujita Y, Ohtani R, Ihara M, Takahashi R, Tomimoto H. Selective impairment of working memory in a mouse model of chronic cerebral hypoperfusion. Stroke. 2007;38:2826–2832. [DOI] [PubMed] [Google Scholar]
- 11. Ayata C, Dunn AK, Gursoy OY, Huang Z, Boas DA, Moskowitz MA. Laser speckle flowmetry for the study of cerebrovascular physiology in normal and ischemic mouse cortex. J Cereb Blood Flow Metab. 2004;24:744–755. [DOI] [PubMed] [Google Scholar]
- 12. Kim SG. Quantification of relative cerebral blood flow change by flow‐sensitive alternating inversion recovery (FAIR) technique: application to functional mapping. Magn Reson Med. 1995;34:293–301. [DOI] [PubMed] [Google Scholar]
- 13. Kim SG, Tsekos NV. Perfusion imaging by a flow‐sensitive alternating inversion recovery (FAIR) technique: application to functional brain imaging. Magn Reson Med. 1997;37:425–435. [DOI] [PubMed] [Google Scholar]
- 14. Wakita H, Tomimoto H, Akiguchi I, Kimura J. Protective effect of cyclosporin A on white matter changes in the rat brain after chronic cerebral hypoperfusion. Stroke. 1995;26:1415–1422. [DOI] [PubMed] [Google Scholar]
- 15. Hattori Y, Kitamura A, Tsuji M, Nagatsuka K, Ihara M. Motor and cognitive impairment in a mouse model of ischemic carotid artery disease. Neurosci Lett. 2014;581c:1–6. [DOI] [PubMed] [Google Scholar]
- 16. Washida K, Ihara M, Nishio K, Fujita Y, Maki T, Yamada M, Takahashi J, Wu X, Kihara T, Ito H, Tomimoto H, Takahashi R. Nonhypotensive dose of telmisartan attenuates cognitive impairment partially due to peroxisome proliferator‐activated receptor‐gamma activation in mice with chronic cerebral hypoperfusion. Stroke. 2010;41:1798–1806. [DOI] [PubMed] [Google Scholar]
- 17. Takamatsu J, Hirano A, Levy D, Henkind P. Experimental bilateral carotid artery occlusion: a study of the optic nerve in the rat. Neuropathol Appl Neurobiol. 1984;10:423–428. [DOI] [PubMed] [Google Scholar]
- 18. Hattori Y, Enmi J, Kitamura A, Yamamoto Y, Saito S, Takahashi Y, Iguchi S, Tsuji M, Yamahara K, Nagatsuka K, Iida H, Ihara M. A novel mouse model of subcortical infarcts with dementia. J Neurosci. 2015;35:3915–3928. [DOI] [PMC free article] [PubMed] [Google Scholar]
- 19. d'Uscio LV, Smith LA, Katusic ZS. Hypercholesterolemia impairs endothelium‐dependent relaxations in common carotid arteries of apolipoprotein E‐deficient mice. Stroke. 2001;32:2658–2664. [DOI] [PubMed] [Google Scholar]
- 20. von der Thusen JH, van Berkel TJ, Biessen EA. Induction of rapid atherogenesis by perivascular carotid collar placement in apolipoprotein E‐deficient and low‐density lipoprotein receptor‐deficient mice. Circulation. 2001;103:1164–1170. [DOI] [PubMed] [Google Scholar]
- 21. Ueda M, Becker AE, Fujimoto T, Tsukada T. The early phenomena of restenosis following percutaneous transluminal coronary angioplasty. Eur Heart J. 1991;12:937–945. [PubMed] [Google Scholar]
- 22. Roman GC, Erkinjuntti T, Wallin A, Pantoni L, Chui HC. Subcortical ischaemic vascular dementia. Lancet Neurol. 2002;1:426–436. [DOI] [PubMed] [Google Scholar]
Associated Data
This section collects any data citations, data availability statements, or supplementary materials included in this article.
Supplementary Materials
Video S1. Surgical implantation of ameroid constrictor (AC). Through a midline cervical incision, a left common carotid artery (CCA) is exposed and freed from their sheaths including left vagus nerve. A 4‐0 silk suture is placed around the CCA. The artery was gently lifted by this suture, the AC is implanted surgically on the CCA, and the suture is removed.