

Nocetti and Whitehouse report a comprehensive analysis of nucleosome positions as budding yeast transit through an ultradian cycle in which expression of >50% of all genes is highly synchronized. During activation, nucleosomes are relocated to allow sites of general transcription factor binding and transcription initiation to become accessible.
Keywords: chromatin, transcription, nucleosome, SWI/SNF
Abstract
Nucleosome repositioning at gene promoters is a fundamental aspect of the regulation of gene expression. However, the extent to which nucleosome repositioning is used within eukaryotic genomes is poorly understood. Here we report a comprehensive analysis of nucleosome positions as budding yeast transit through an ultradian cycle in which expression of >50% of all genes is highly synchronized. We present evidence of extensive nucleosome repositioning at thousands of gene promoters as genes are activated and repressed. During activation, nucleosomes are relocated to allow sites of general transcription factor binding and transcription initiation to become accessible. The extent of nucleosome shifting is closely related to the dynamic range of gene transcription and generally related to DNA sequence properties and use of the coactivators TFIID or SAGA. However, dynamic gene expression is not limited to SAGA-regulated promoters and is an inherent feature of most genes. While nucleosome repositioning occurs pervasively, we found that a class of genes required for growth experience acute nucleosome shifting as cells enter the cell cycle. Significantly, our data identify that the ATP-dependent chromatin-remodeling enzyme Snf2 plays a fundamental role in nucleosome repositioning and the expression of growth genes. We also reveal that nucleosome organization changes extensively in concert with phases of the cell cycle, with large, regularly spaced nucleosome arrays being established in mitosis. Collectively, our data and analysis provide a framework for understanding nucleosome dynamics in relation to fundamental DNA-dependent transactions.
The nucleosome is the fundamental repeating unit of chromatin and consists of ∼147 base pairs (bp) of DNA wrapped around a histone octamer (Luger et al. 1997). The high degree of compaction achieved by nucleosomes restricts access to the underlying DNA such that fundamental genomic processes like transcription, replication, recombination, and repair must actively overcome the nucleosome barrier (Eaton et al. 2010; Pan et al. 2011; Chambers and Downs 2012; Voss and Hager 2014). Eukaryotic promoter regions are characterized by many factors, including DNA sequence elements, post-translational modifications (PTMs) of histones, the presence of chromatin remodeling factors, and histone variants (Raisner et al. 2005; Badis et al. 2008; Hartley and Madhani 2009; Zhang et al. 2009; Rhee and Pugh 2012; Yen et al. 2012). A feature nearly universal to all eukaryotic promoters is the nucleosome-depleted region (NDR) (Mavrich et al. 2008; Jiang and Pugh 2009).
NDRs in budding yeast range from ∼80 to 200 bp and are flanked by two remarkably well-positioned nucleosomes, −1 and +1, upstream and downstream, respectively (Jiang and Pugh 2009). The comparatively long stretches of nucleosome-free DNA at the NDR are enriched for sequence motifs that are recognized by transcription factors (Badis et al. 2008; Rhee and Pugh 2012). Experiments examining the effect of DNA sequence on nucleosome positioning reliably demonstrate that yeast promoters inherently disfavor nucleosome assembly and that the flanking DNA is much more amenable to nucleosomes (Lee et al. 2004; Kaplan et al. 2009; Zhang et al. 2009, 2011b). However, in vivo, nucleosomes surrounding NDRs exhibit positioning different from their in vitro assembled counterparts, illustrating that DNA sequence is not the sole positioning force acting on nucleosomes (Zhang et al. 2009, 2011b; Hughes et al. 2012). ATP-dependent chromatin remodeling enzymes play key roles in the organization of nucleosomes in vivo. Systematic analyses of chromatin structure defects in deletion mutants have uncovered a complex picture of how remodeling complexes alter chromatin structure in promoter and gene bodies (Whitehouse et al. 2007; Hartley and Madhani 2009; Tirosh et al. 2010; Gkikopoulos et al. 2011; Yen et al. 2012; Ganguli et al. 2014). While the general principles of chromatin reconfiguration by ATP-dependent remodeling activities are gradually being defined, it is far from clear why so many remodeling activities are needed and how each of the respective enzymatic activities is integrated into coherent pathways for gene activation or repression. Indeed, the study of many chromatin-associated factors is typically confounded by the seemingly pleotropic nature of the transcriptional defects in mutant strains.
Chromatin reconfiguration at inducible genes has revealed the roles played by chromatin structure during gene activation. Classic model systems demonstrate clear roles for histone acetylation and/or ATP-dependent chromatin remodeling enzymes (Wu and Winston 1997; Reinke et al. 2001; Moreau et al. 2003; Steger et al. 2003). More recently, chromatin state changes have been mapped genome-wide as cells synchronously respond to different carbon sources (Tolkunov et al. 2011), stress (Gasch et al. 2000; Shivaswamy et al. 2008; Weiner et al. 2015), and meiosis (Zhang et al. 2011a) or pass through an ultradian metabolic cycle (Kuang et al. 2014). Such approaches are especially powerful, as they allow the intricacies of gene expression to be documented as thousands of loci are activated or repressed. However, much of our understanding of how chromatin is globally reconfigured during gene activation is derived from experimental systems that use acute stress. Genes have been broadly categorized as either “stress” genes, which are dynamically expressed and regulated by SAGA, or “housekeeping” genes, which are constitutively expressed and regulated by TFIID. However, designation into such categories is inherently dependent on growth conditions and typically represents only a limited set of genes. Thus, it is vital to understand whether general principles from such studies are applicable in all cases.
To broadly examine in vivo nucleosome dynamics as thousands of genes are synchronously activated and repressed, we focused on the yeast metabolic cycle (YMC), which offers a highly robust system in which over half of the coding transcripts exhibit periodic expression (Klevecz et al. 2004; Tu et al. 2005; Kuang et al. 2014). Oscillation is achieved in a chemostat by first growing a culture to saturation in limited nutrient conditions (Novick and Szilard 1950). Starved of a carbon source, the cells are maintained at saturation for several hours, allowing the culture to synchronize in a nonrespiratory metabolic state. Upon the readdition of glucose, the cells begin to respire synchronously, and this is monitored by the concentration of dissolved oxygen (DO) available to the culture. Initial studies of the YMC described three temporally segregated phases: oxidative (Ox), reductive building (R/B), and reductive charging (R/C) (Tu et al. 2005). Ox genes are maximally expressed as the culture consumes O2, while R/B and R/C genes are transcribed as O2 re-enters the culture and subsequently plateaus, respectively. Within each category, the genes transcribed reflect the demands facing the culture. For instance, the Ox phase is characterized by a burst of ribosome and amino acid biogenesis; genes expressed during Ox are largely involved in growth. Subsequently, in the R/B phase, within which S phase takes place, genes involved in DNA synthesis, DNA repair, and chromatin assembly exhibit peak expression. Following R/B, the cells enter a “quiescent”-like state in which levels of the storage carbohydrate trehalose peak and trigger the expression of factors involved in autophagy (Tu et al. 2005; Cai and Tu 2012).
Our analysis reveals that nucleosome repositioning is used pervasively in the regulation of gene transcription. Nucleosome remodeling generally occurs at SAGA promoters, while chromatin at TFIID-dominated promoters largely remains static; however, there are broad exceptions to this principle. Indeed, our analysis reveals that many TFIID-regulated promoters exhibit highly dynamic expression patterns. Importantly, when maximally expressed, nucleosomes at SAGA promoters closely resemble the nucleosome organization observed at TFIID promoters, suggesting that all actively transcribed genes adopt a common chromatin architecture. We show that the majority of nucleosome repositioning at promoters occurs during a narrow window, which is correlated with induction of genes responsible for growth; moreover, our data clearly implicate the SWI/SNF complex in this fundamental process. Finally, we observed global changes in nucleosome organization as cells progress through the YMC; intriguingly, these changes appear coupled with the onset of mitosis, in which nucleosome arrays become highly organized.
Results
+1 nucleosome dynamics correlate with transcriptional output
We established YMC conditions and were able to recapitulate a cycle with an ∼3.2-h average period (Fig. 1A; Tu et al. 2005). Time points were taken at regular intervals through one cycle; cells were harvested, formaldehyde-cross-linked, and spheroplasted, and then chromatin was digested with micrococcal nuclease (MNase) (Fig. 1B,C). Nucleosome-sized DNA from each of the samples was used to generate barcoded libraries and sequenced on the Illumina HiSeq platform. Nucleosome calls were then made by processing 125- to 175-bp reads using “improved nucleosome positioning from sequencing” (iNPS) (Chen et al. 2014). Additionally, barcoded RNA sequencing (RNA-seq) libraries were generated from the same time points used to generate the MNase libraries (Fig. 1C). By executing a k-means clustering algorithm using our normalized RNA-seq data, we were able to observe the three transcription superclusters originally described by Tu et al. (2005) (Fig. 1D).
Figure 1.

Dynamic transcription and nucleosomes through the YMC. (A) Example of respiratory oscillations during continuous culture. Level of DO (DO%) indicates whether cells are in Ox or reductive growth phases. The arrowhead specifies when the continuous addition of fresh medium was begun. (B) Individual oscillation from which samples were taken. Numbered dots indicate the 12 time points sampled. (C) Outline describing the processing of samples for RNA-seq and MNase sequencing (MNase-seq). (D) k-means clustering of normalized RNA-seq data showing a heat map of the three periodically transcribed classes of transcript: R/C, Ox, and R/B. (E) Heat map showing the location of mapped nucleosome for each time point at the TEA1 locus. Black boxes above represent nucleosomes; by convention, +1 lies adjacent to the transcription start site (TSS). Nucleosome repositioning occurs at time point 9, which is coincident with maximal transcription (shown at the right).
Comparing the MNase sequencing (MNase-seq) data from the 12 time points, we observed highly dynamic chromatin architecture at many promoters. For example, at the TEA1 locus, we observed significant movement of the +1 nucleosome with respect to the NDR (Fig. 1E). This nucleosome is shifted furthest downstream at time point 9, coincident with the Ox phase, which is also when the gene is most highly expressed (Fig. 1E). At time points when TEA1 exhibits basal levels of transcription, the +1 nucleosome appears to completely occlude the mapped binding site for TFIIB (see below).
The precise location of the +1 nucleosome is widely recognized to play an influential role in the regulation of gene transcription (Jiang and Pugh 2009; Rando and Winston 2012). In order to characterize the degree to which +1 nucleosomes are repositioned through the metabolic cycle, we determined the positions of +1 nucleosomes at all 12 time points. Promoters for which we have accurate transcription start site (TSS) and nucleosome positional information (n = 3226) were then ranked by the variability in positioning of their +1 nucleosomes by taking the standard deviation of dyad positions. Strikingly, we found that +1 nucleosomes shift by >50 bp at many promoters (Fig. 2A,B): Plotting the dyads of the furthest upstream and downstream +1 nucleosomes against the TSSs of 350 genes with the greatest variability, we found that dyads typically occlude the TSSs at their most upstream positions (Fig. 2B). We term this class of promoters “most dynamic.” At the 350 promoters where we observed the smallest shift in +1 positioning, which we refer to as “static,” the dyads are generally found ∼50 bp downstream from the TSS (Fig. 2C).
Figure 2.

Dynamic positioning of +1 nucleosomes correlates to gene transcription. (A) Heat maps of the position of nucleosome dyads when furthest upstream of and downstream from the TSS as defined by Pelechano et al. (2013). Promoters are arranged by decreasing variability of +1 nucleosome positioning from top to bottom, indicated by +1 shift at the far left. Only genes with an annotated TSS and a +1 nucleosome for all 12 time points are included in this and subsequent analyses. n = 3226. Normalized expression levels for each gene when nucleosomes are furthest upstream or downstream are shown as heat maps at the right. (B,C) Distance from the TSS to the nucleosome dyad for “dynamic” (B) and “static” (C) promoters when the nucleosome is furthest upstream (upstream) and downstream (downstream) across 12 time points. (D) Analysis of normalized RNA (RPKM [reads per kilobase per million mapped reads]) values of “dynamic” and “static” promoters when +1 nucleosomes occupy their farthest upstream and downstream positions. Error bars represent the SEM. (****) P-value < 0.0001. (E) Log2 (observed/expected) examining the enrichment of “dynamic” and “static” promoters in each of the three periodically transcribed clusters. Promoters are arranged by +1 shift and compiled into 100 gene bins. (F) Heat maps illustrating the correlation between +1 nucleosome positioning and gene expression of the Ox cluster; expression and nucleosome position changes for each gene are normalized to the same range. n = 494.
We assumed that the shift of the most dynamic nucleosomes would be correlated with the transcriptional activity of their associated genes. To investigate this, we analyzed RNA-seq data from each time point; each gene was assigned an RPKM (reads per kilobase per million mapped reads), and the RPKM values for each gene were normalized to a maximum value of 1. In general, we found a clear correlation between the most dynamic +1 nucleosomes and genes whose RNA expression exhibits the greatest dynamic range (Fig. 2A,D). RNA expression values are typically highest when nucleosomes are furthest downstream from the TSS, while transcriptional activity is generally at its lowest when +1 nucleosomes occupy their furthest upstream positions (Fig. 2A,D), consistent with what we observed at the TEA1 locus (Fig. 1E).
Having established two extreme promoter types with respect to nucleosome repositioning, we investigated the relationship between nucleosome repositioning and genes belonging to the R/B, R/C, or Ox phase. Thus, we individually examined the degree of +1 shift nucleosomes associated with each metabolic class. Highly dynamic promoters are markedly enriched for Ox genes and, to a lesser extent, R/C genes. Conversely, promoters with relatively little movement of +1 nucleosomes are enriched for genes maximally expressed in the R/B phase (Fig. 2E, left panel). The finding that highly dynamic promoters likely belong to the Ox cluster led us to more specifically investigate the relationship between the positioning of +1 nucleosomes and the expression of Ox genes. Isolating only the Ox cluster, we observed a pronounced correlation between repositioning of the +1 nucleosome and the burst of maximal transcriptional output (Fig. 2F; Supplemental Fig. 1). Both maximal expression and downstream positioning of nucleosomes occurs at time point 9, while nucleosomes shift furthest upstream at time point 12, when the Ox cluster is transcriptionally repressed. This broad alteration in chromatin structure is reflective of nucleosome repositioning and is not a result of altered DNA digestion kinetics by MNase during the Ox phase (Supplemental Figs. 2, 3).
Nucleosome positioning corresponds to transcriptional activity
Yeast promoters broadly fall into two categories: those regulated by the SAGA or TFIID coactivators (Huisinga and Pugh 2004; Rhee and Pugh 2012). SAGA promoters are highly dynamic in both expression and chromatin structure, whereas TFIID promoters are generally considered to exhibit less dynamic levels of expression and chromatin reconfiguration (Rando and Winston 2012). The relationship between +1 nucleosomes and the localization of general transcription factors (GTFs) is often unique to each promoter class (Rhee and Pugh 2012). GTFs at TFIID promoters are found a fixed distance upstream of the +1 nucleosome; in contrast, the same GTFs are typically bound throughout the body of the +1 nucleosome at SAGA promoters, and it was hypothesized that this could be the result of competition between nucleosomes and GTFs for binding at these promoters (Rhee and Pugh 2012).
Given that the majority of genes exhibit periodic expression through the YMC, we examined the prevalence of coactivators for different gene classes and levels of expression. As would be expected, cycling genes preferentially use SAGA (TAF1-depleted), and noncycling genes use TFIID (TAF1-enriched) (Fig. 3A). However, bias in coactivator use is limited, which is reflective of the fact that both SAGA- and TFIID-regulated promoters are proficient for dynamic gene expression. While the absolute levels of RNA produced by TAF1-depleted promoters are higher, there is little difference in the kinetics of activation and repression of genes controlled by the two coactivators—a finding that dispels the notion that an inherent feature of TFIID-regulated promoters is to maintain constant levels of transcriptional output (Fig. 3B; Supplemental Fig. 1).
Figure 3.
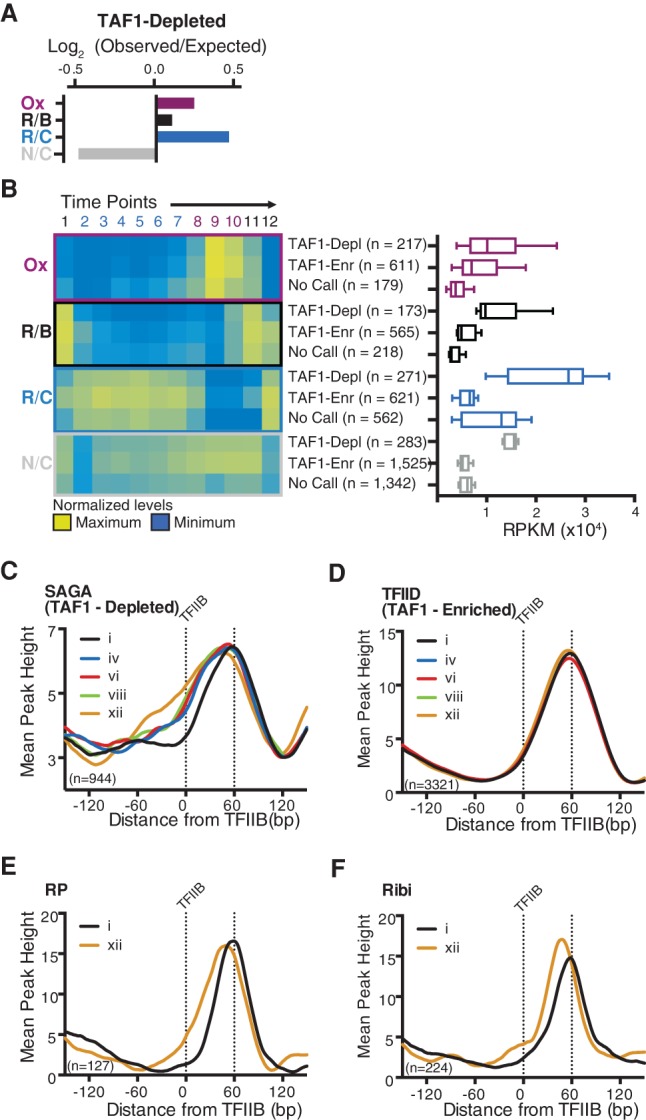
Dynamic gene expression and chromatin structure at SAGA and TFIID promoters. (A) Log2 (observed/expected) values for TAF1-depleted genes belonging to clusters exhibiting cyclic (Ox, R/B, and R/C) and noncyclic (N/C) expression. (B) Transcript abundance through the YMC for TAF1-depleted (TAF1-Depl), TAF1-enriched (TAF1-Enr), and unclassified (No Call) promoters. The heat map (left) displays normalized expression levels, and the box plot (right) shows maximum transcript abundance for genes in each category. (C,D) Nucleosome dyads plotted against TFIIB-binding sites as mapped by Rhee and Pugh (2012) with respect to transcriptional output at TAF1-depleted (SAGA) and TAF-enriched (TFIID) genes; expression at each time point is ranked from i (maximum) to xii (minimum). (E,F) Nucleosome dyads plotted against TFIIB-binding sites (Rhee and Pugh 2012) with respect to transcriptional output of ribosomal protein (RP) genes (E) and ribosomal biosynthesis (Ribi) genes (F).
Next, we probed the relationship between GTF binding, nucleosome repositioning, and gene transcription. The RNA transcript levels of each gene were ranked from maximum (i) to minimum (xii) throughout the 12 time points. Next, for each expression rank, the positions of +1 nucleosomes were plotted in relation to mapped TFIIB-binding sites (Rhee and Pugh 2012) for either SAGA (TAF1-depleted) or TFIID (TAF1-enriched) promoters (Fig. 3C,D). In general, we found that +1 nucleosomes at SAGA genes are highly dynamic: At their lowest expression level, +1 nucleosomes frequently occupy (and likely occlude) TFIIB-binding sites; however, when maximally induced, the dyad of the +1 nucleosome is shifted downstream such that TFIIB now lies near the entry/exit site of the nucleosome (Fig. 3C). In contrast to the dynamic nucleosomes at SAGA promoters, +1 nucleosomes at TFIID promoters generally remain in the same position regardless of expression level (Fig. 3D). Nevertheless, numerous TFIID-regulated genes belong to the Ox cluster, which experiences clear nucleosome repositioning upon gene activation. Most prominent among these are the ribosomal protein (RP) and ribosomal biosynthesis (Ribi) genes (Jorgensen et al. 2004; Kuang et al. 2014). Thus, we specifically analyzed the RP and Ribi genes, which revealed that nucleosomes are indeed repositioned in concert with gene activation at TAF1-enriched genes (Fig. 3E,F). Thus, nucleosome remodeling occurs at SAGA promoters and a subset of TFIID promoters, where the position of the +1 nucleosome likely contributes to transcriptional repression. Importantly, a ubiquitous feature of all genes—regardless of coactivator usage—is that the dyad of the +1 nucleosome lies ∼ 60 bp downstream from the TFIIB-binding site upon maximal activation. This organization is likely conducive to transcription, as TFIIB would bind close to the edge of the +1 nucleosome in a region known to be highly accessible (Anderson et al. 2002).
DNA sequence elements correlated with dynamic and static promoters
Nucleosome positioning in vivo is dictated by a complex interplay between ATP-dependent chromatin remodeling enzymes, DNA sequence, and DNA-binding proteins (Zhang et al. 2009, 2011b; Gkikopoulos et al. 2011). Given that DNA sequence is a very strong determinant of the NDR, we investigated whether nucleosome repositioning is related to the intrinsic propensity of the DNA sequence to favor or disfavor nucleosome formation. Initially, we examined the predicted nucleosome occupancies as calculated by Kaplan et al. (2009) and plotted predicted occupancy relative to the TSS at the most dynamic promoters. This analysis revealed that dynamic promoters exhibit a severe dip in predicted occupancy upstream of the TSS; +1 nucleosomes at these promoters oscillate between unfavorable sequences when they are inactive and more favorable sites when they are expressed (Fig. 4A). To examine whether this feature was found only at dynamic promoters, we ranked genes according the degree of +1 shift and then segmented the predicted occupancy into quintiles. As Figure 4B illustrates, stretches of promoter DNA with the lowest intrinsic nucleosome affinity are found upstream of the TSS at high shifting promoters, but this signal gradually transitions downstream from the TSS at static promoters. Thus, the degree of the +1 nucleosome shift, the use of SAGA or TFIID, and the dynamic range of gene expression all bear a clear relation to properties of the underlying DNA sequence relative to the TSS.
Figure 4.
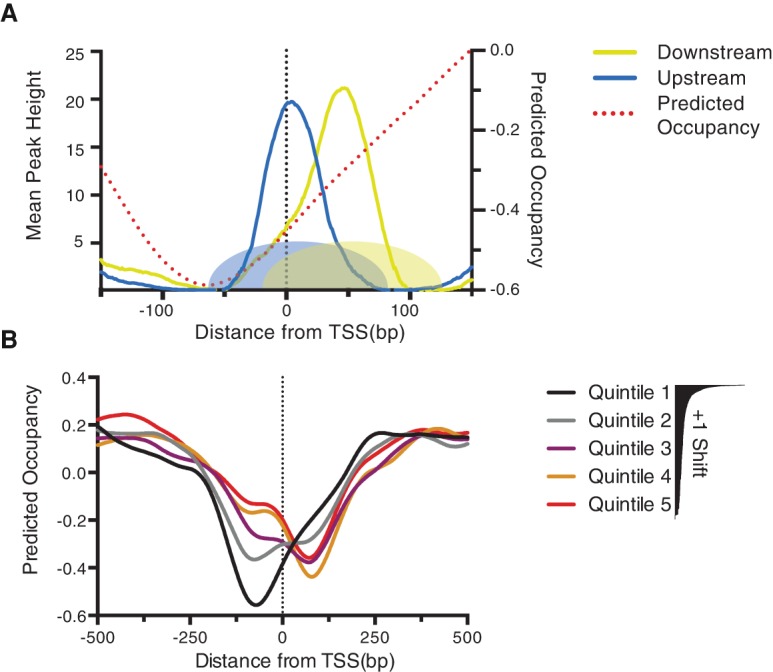
A DNA signature for nucleosome repositioning. (A) +1 nucleosome dyads at maximum upstream or downstream positions for dynamic promoters compared with the predicted nucleosome occupancy as calculated by Kaplan et al. (2009) (right Y-axis). Shapes at the bottom of the graph represent the space occupied by nucleosome at upstream (blue) and downstream (yellow) positions. (B) All promoters were ranked according to the degree of +1 shift (as in Fig. 2A) and then separated into quintiles with the most nucleosome shift (quintile 1) and least (quintile 5). Predicated occupancy is then plotted for each quintile with respect to the TSS.
Role of chromatin remodeling factors and Htz1 in nucleosome repositioning
The periodic patterns of gene expression of the YMC are uncovered by the culture conditions; however, periodic gene expression programs are an intrinsic property of cellular growth: While a population of yeast cells cultivated in batch displays no apparent gene expression synchrony, individual cells within the population can be observed to follow the periodic gene expression programs revealed by the YMC (Silverman et al. 2010). Therefore, experiments to map the occupancy of histone modifications and chromatin remodeling enzymes performed in batch cultures will report average occupancy across phases of the YMC.
To understand whether chromatin immunoprecipitation (ChIP) data from asynchronous cultures would be informative for our analysis of nucleosome repositioning during the YMC, we compared the expression of a subset of periodic genes with the expression of the same gene set in an asynchronous log-phase culture or stationary phase (Supplemental Figs. 4, 5). This analysis revealed that log-phase cultures are more closely correlated with the Ox and R/B phases, which is logical, as these cell populations are in rapid growth. Since we found that the majority of nucleosome repositioning occurs during the Ox and R/B phases (Fig. 2E), data from log-phase cultures can be used to reveal which factors are associated with nucleosome repositioning during Ox. First, we used recently published data from Weiner et al. (2015), which contain high-resolution genome-wide location maps of the histone variant Htz1 and numerous histone modifications (Supplemental Fig. 6). Strikingly, we observed clear anti-correlation between Htz1 occupancy and the shift of the +1 nucleosome (Fig. 5A,B); consistent with this, “static” promoters exhibit significantly more H4K5ac, H4K8ac, and H4K12ac than their “dynamic” counterparts (Fig. 5B). These findings are in excellent agreement with previous findings, as H4K5/8/12ac have been shown to facilitate the incorporation of Htz1 into chromatin by Swr1 (Altaf et al. 2010; Ranjan et al. 2013), and Htz1 was shown previously to be enriched at TFIID-regulated genes (Zhang et al. 2005). Other PTMs display similar levels of enrichment at both classes of promoters (Supplemental Fig. 6). Histone exchange (Dion et al. 2007) and high dynamic range of transcription are both positively correlated with nucleosome shift (Fig. 5A).
Figure 5.

Histone PTMs and chromatin remodeling factors at dynamic and static promoters. (A) Heat maps illustrating the association between +1 shift and features of gene transcription and chromatin structure. n = 3226. All data are ranked according to the degree of +1 shift, illustrated at the left. Htz1 enrichment (Weiner et al. 2015), TAF1 depletion (Rhee and Pugh 2012), range of expression, and H3 exchange (Dion et al. 2007) all scale accordingly in relation to +1 nucleosome shift. (Right panel) Snf2-enriched regions from Parnell et al. (2015) near the TSS at promoters ranked by +1 nucleosome shift. (B) Bar graphs demonstrating the depletion of H4K5ac, H4K8ac, H4K12ac, and Htz1 (Weiner et al. 2015) at +1 nucleosomes at “dynamic” promoters. Error bars represent SEM. (****) P-value < 0.00001. (C,D) Box plot analysis of +1 nucleosome shift associated with promoters bound and not bound by various chromatin remodeling factors. (****) P-value < 0.00001; (**) P-value < 0.001; (*) P-value < 0.01. Factor occupancy data are from Yen et al. (2012) (C) and Parnell et al. (2015) (D). (E) Analysis of Snf2 enrichment at Ox, R/B, R/C, and noncycling (N/C) promoters; numbers in brackets represent the expected proportions (data are from Parnell et al. 2015). (F) Analysis of Snf2 enrichment at TAF1-depleted and TAF1-enriched promoters; numbers in brackets represent the expected proportions (data are from Parnell et al. 2015).
To examine which chromatin remodeling factors might be responsible for remodeling +1 nucleosomes through the YMC, we used data from Yen et al. (2012), in which promoters were classified as being bound by components of remodeling complexes Ino80 (Arp5 and Ino80) Isw1a (Ioc3), Isw1b, (Ioc4,) Isw1, Isw2, RSC (Rsc8), and SWI/SNF (Snf2) (Yen et al. 2012). We calculated the shifts of +1 nucleosomes for promoters both bound and not bound by each factor (Fig. 5C). We observed no significant difference in the degree of +1 shifts for promoters bound or not bound by Arp5, Ioc3, Ioc4, Rsc8. Isw1, and Isw2, which are moderately enriched at static promoters, but Ino80 displayed a very clear association with static promoters, which likely reflects the known role of this complex in the biology of Htz1 (Supplemental Fig. 7).
Role of SWI/SNF in Ox gene clusters
Snf2 showed a trend of enrichment at the most dynamic promoters (Fig. 5C), but this was of limited significance due to the low coverage of the ChIP data. However, the activity of SWI/SNF is known to be modulated by the nutrient conditions of the growth medium (Sudarsanam et al. 2000); therefore, we used ChIP data from Parnell et al. (2015), who performed ChIP of Snf2 (the ATPase subunit of SWI/SNF) in minimal medium that more closely matches the nutrient conditions in the YMC. Examining Snf2-enriched promoters under these conditions, we observed that peaks of Snf2 enrichment are preferentially associated with promoters that exhibit significant nucleosome shifting (Fig. 5A,D), indicating that Snf2 is likely involved in mediating the chromatin remodeling events at these loci.
Consistent with our finding that SWI/SNF is associated with nucleosome repositioning, Figure 5E shows that Snf2 is preferentially enriched at Ox genes (P = 3 × 10⁻¹⁹), including genes regulated by both SAGA and TFIID (Fig. 5F), which is in agreement with our finding that nucleosome remodeling also occurs at TFIID-enriched promoters (Fig 3E,F; Supplemental Fig. 1). Like many chromatin remodeling factors, deletion of Snf2 has pleotropic effects on gene expression, making it difficult to understand how or whether chromatin remodeling is used to regulate the coherent expression of large sets of genes. However, when evaluated with respect to the YMC, not only did we find that Snf2 is enriched at Ox genes, but analysis of transcript abundance in snf2Δ mutant cells revealed that essentially all genes in the Ox cluster require Snf2 for maximal expression (Fig 6A–E). Thus, SWI/SNF appears to be a specific regulator of growth genes; consistent with this, we were not able to achieve metabolic cycling in snf2Δ yeast. Histone acetylation by Gcn5 is important for regulating the activity of SWI/SNF at promoters (Hassan et al. 2001; Chandy et al. 2006; Cai et al. 2011). Kuang et al. (2014) have shown recently that Gcn5, H3K9ac, and H3K14ac occupancy is coincident with Ox gene expression, which correlates with genes regulated by Snf2 (Supplemental Fig. 8).
Figure 6.
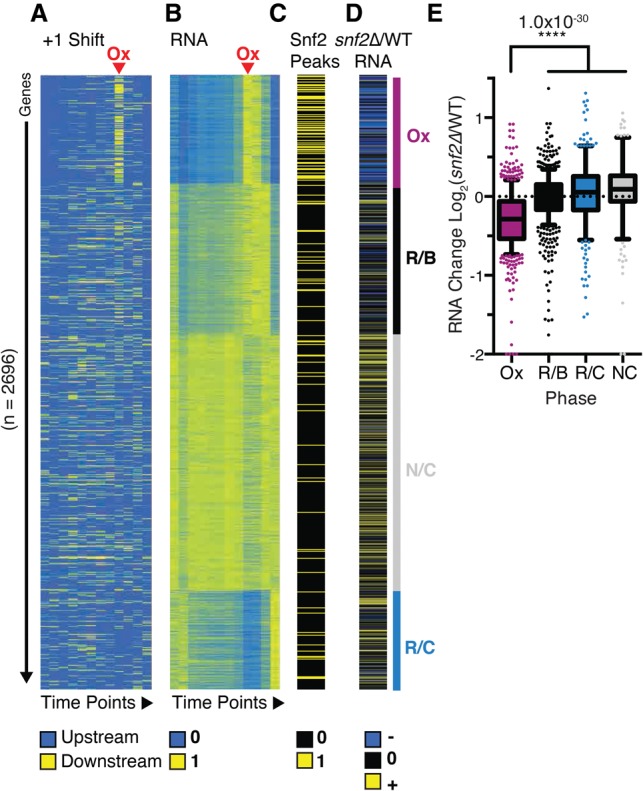
Snf2 controls expression of the Ox cluster by remodeling of +1 nucleosomes. (A) Normalized +1 shift for each gene through 12 time points. n = 2696. Data are separated into YMC superclusters according to RNA expression. Ox genes are highlighted by the purple bar. (B) Gene expression is shown by normalized RPKM values from RNA-seq. (C) Peaks of Snf2 binding within 100 bp upstream of and downstream from TSSs (Parnell et al. 2015). (D) Change in transcript abundance as a result of snf2Δ in minimal medium (Sudarsanam et al. 2000). (E) Relative change in RNA abundance in each of the superclusters in a snf2Δ mutant (Sudarsanam et al. 2000).
Global chromatin reconfiguration during the YMC
In addition to nucleosome repositioning, we observed a subtle variation in the number of nucleosome calls as the cell progressed through the YMC. Examining individual loci, we are able to identify many NDRs and linker regions that acquire nucleosomes in the R/C phase, exemplified by the HCA4 promoter (Fig. 7A). Unlike nucleosome repositioning, we found no evidence that transcriptional activity is related to occupancy within the NDR at these time points. Sites of transient occupancy in promoters overlap with a subset of RSC-binding sites, but neither RSC nor any other remodeling factor was predictive of transient occupancy in promoters (data not shown). Next, we considered whether sites of transient occupancy in promoters may be indicative of global chromatin reconfiguration, which likely occurs as cells enter the quiescent-like R/C phase (Pinon 1978; McKnight et al. 2015; Rutledge et al. 2015). It has recently been demonstrated that promoters in Saccharomyces cerevisiae can function as boundary elements that separate CIDs (chromosomally interacting domains), typically comprised of approximately five genes (Hsieh et al. 2015). Interestingly, we found that ∼70% of the ∼740 promoters that contain transient nucleosomes in R/C function as CID boundaries in rich medium (P = 2 × 10−268), which raises the prospect that CID boundaries are extensively reconfigured as cells enter R/C.
Figure 7.

Global alteration in chromatin through the YMC. (A) Heat map demonstrating nucleosome occupancy and organization changes at the HCA4 promoter and gene body. (B) Frequency of internucleosome distances (dyad–dyad) in R/B, early R/C (R/C E), late R/C (R/C L), and Ox. (C,D) Heat maps illustrating the variation in nucleosome positioning across gene lengths with respect to transcriptional activity. n = 2696. (E) The genome was segmented into 5-kb bins, and the standard deviation (SD) of internucleosomeal distances was calculated for each gene bin. n = 2423 bins. Data are aligned with respect to chromosomal position, denoted at the left. (F) Normalized transcript levels are shown for key cyclins and cyclin-dependent kinase (CDK); cyclin expression signifies major cell cycle stages. (G) Number of nucleosome arrays with ≥10 nucleosomes at each time point; arrays are defined as consecutive nucleosomes with a repeat length between 155 and 175 bp.
Outside of gene promoters, we found many other regions that became occupied during the R/C phase. To understand how chromatin is being reconfigured, we considered two models: First, the incorporation of extra nucleosomes may be indicative of tighter spacing and a global reduction in nucleosome repeat length. Second, the number of nucleosomes may actually change little, but our ability to unambiguously map nucleosomes may alter as nucleosome positioning may become more consistent in different phases of the YMC. To distinguish between these possibilities, which are not mutually exclusive, we calculated the internucleosomal distance genome-wide for each time point. As shown in Figure 7, B and C, the frequency distributions are very similar, and we found little alteration in the mode distance between nucleosomes, which argues against a global change in nucleosome spacing. Nevertheless, there are proportionally more nucleosomes with ∼165-bp spacing in R/C.
Next, we considered whether nucleosomes generally become more consistently positioned in the R/C phase; hence, we tested whether intragenic nucleosome spacing varied among genes through metabolic oscillations. To calculate “order” within genes, we determined the standard deviation among the internucleosome distances associated with each gene for all time points. Genes with the most variation among internucleosome distances are considered the most “fluid,” while those with consistent spacing of nucleosomes are considered to be “ordered.” The intragenic nucleosome organization at the vast majority of genes is most ordered as the culture enters the R/C phase and subsequently relaxes through the Ox and R/B phases (Fig. 7C). To examine the relationship with transcription, we compared our data of intragenic nucleosome organization with the transcriptional clusters derived from the RNA-seq data (Fig. 7C,D). Globally, the clearest association remains the phase to which the time point belongs. However, we did observe an increase in fluidity of nucleosome organization corresponding to transcription of the Ox and R/B clusters, which likely reflects the chromatin remodeling associated with the passage of RNA polymerase II. To examine nucleosome periodicity across the genome, we divided the genome into 5-kb bins and assayed nucleosome order within each bin. This analysis confirmed the general association with the YMC phase (Fig. 7E), but closer inspection revealed that the alteration in nucleosome order largely corresponds to distinct phases in the cell cycle (Fig. 7F). Entry into mitosis (high Clb2) is coincident with the peak in nucleosome organization; this persists through the remainder of the R/C phase but diminishes as cells pass START (high Cln3) and then enter S phase (high Clb5). The change in nucleosome order in mitosis has a significant effect on the length and number of evenly spaced nucleosomes within arrays; for example, there are approximately threefold more nucleosome arrays containing ≥10 nucleosomes (repeat length between consecutive nucleosomes, 155–175 bp) in early R/C (mitosis) than in R/B (S phase) (Fig. 7G). Thus, while the alteration in the overall number of nucleosomes in any given sample is small, this change is indicative of much larger chromatin reorganization that occurs through the YMC.
Discussion
We found that, by ranking the degree of repositioning of the +1 nucleosome, we can uncover many of the general principals of gene regulation. In general, promoters with the most dynamic nucleosomes are SAGA-enriched, are acutely expressed, and display the greatest dynamic range of transcription. In contrast, static promoters are TFIID-enriched, display minimal nucleosome repositioning, and exhibit a lower dynamic range of expression. In addition, static promoters are commonly enriched for Htz1 and H4 K5/8/12ac and are bound by Ino80. While these findings are in general keeping with current models of gene regulation by coactivators (Rando and Winston 2012), our research is novel for several reasons: First, we detailed how nucleosome repositioning is widely used to promote access to core promoters during gene activation. Second, we showed that many TATA-less, TFIID-regulated genes are dynamically expressed and exhibit nucleosome remodeling. Third, we found that expressed genes adopt a common chromatin architecture regardless of coactivator use. Fourth, physical properties of promoter DNA near the TSS likely underpin the extent to which nucleosome repositioning occurs. Fifth, SWI/SNF regulates the expression of a large class of genes associated with growth.
Nucleosome repositioning and the Ox cluster
Examination of the gene set massively induced in the Ox cluster reveals dynamic nucleosome repositioning, acute transcriptional activation (and repression), and regulation by SWI/SNF. However, many of the genes within this cluster (i.e., RP genes and other genes associated with growth) are classically described as TFIID-dependent housekeeping genes, which are generally considered to be constitutively expressed (Huisinga and Pugh 2004). This apparent discrepancy can be explained in two ways: First, dynamic gene expression events are typically masked by growing cells in batches, which is the predominant means of cell cultivation. Second, the duration of expression of a given gene will be influenced by factors such as growth conditions and availability of nutrients. Furthermore, coactivator use at a promoter may be somewhat plastic and may vary depending on the nature of the transcriptional response required. Indeed, coactivator use is not absolute: SAGA and TFIID have been shown to act sequentially (Ghosh and Pugh 2011), and many gene promoters, including RP genes, are enriched for both SAGA and TFIID (Ohtsuki et al. 2010). Moreover, expression of a large fraction of all yeast genes was found to be regulated by either complex (Lee et al. 2000; Huisinga and Pugh 2004). Thus, in order to achieve acute control of gene expression during the YMC, Ox genes may initially use SAGA- and Gcn5-mediated histone acetylation for rapid activation (Supplemental Fig. 8), followed by TFIID for a period of consistent expression.
The requirement for SWI/SNF for the activation of growth genes in the Ox cluster may be particularly necessary when cells are cultivated in medium that is limiting in nutrients. Interestingly, we show that Snf2 is enriched at growth genes when cells are cultured in minimal medium but found that this enrichment is less apparent when data from rich medium are used. In the case of the YMC, cells transition through distinct phases in sequence. Importantly, the acute Ox phase is preceded by a comparatively lengthy R/C phase. Here, gene transcription is limited; this phase displays many hallmarks of quiescence, and the transcriptional landscape most closely resembles that of a saturated culture (Supplemental Fig. 2; Shi et al. 2010). The rapid conversion from R/C to growth has been shown to be triggered by acetyl CoA levels (Cai et al. 2011; Kuang et al. 2014), and we found that genes activated at this stage experience significant remodeling of promoter nucleosomes by SWI/SNF. Thus, under YMC growth conditions, SAGA and SWI/SNF may be required for the rapid conversion of a “quiescent” chromatin organization into a state conducive to gene expression. Cells cultured in rich medium presumably only transiently inactivate the Ox cluster and therefore may be less reliant on SWI/SNF and SAGA. Such a mechanism is in keeping with previous findings that SWI/SNF and Gcn5 are required for activation of the GAL1 and PHO5 genes in mitosis (when chromatin structure is likely more repressive) but not in G1 (Krebs et al. 2000; Neef and Kladde 2003).
Histone acetylation, nucleosome remodeling, and gene transcription of the Ox cluster occur within a short time frame, which shows that robust mechanisms for activation and repression are used. Our data are consistent with SWI/SNF acting as a nucleosome-sliding machine to reposition nucleosomes away from the core promoter; such a mechanism agrees very well with biochemical characterization of SWI/SNF (Whitehouse et al. 1999). Gcn5 appears intimately involved in the regulation of Ox genes (Cai et al. 2011; Kuang et al. 2014), and it is noteworthy that histone acetylation by Gcn5 stimulates nucleosome binding and remodeling by SWI/SNF (Chandy et al. 2006; Chatterjee et al. 2011); moreover, Snf2 and Gcn5 show pronounced synthetic interactions (Roberts and Winston 1997). SWI/SNF is also known to be recruited by acidic transcriptional activators, which interact with multiple subunits, including Snf2 (Yudkovsky et al. 1999; Neely et al. 2002; Prochasson et al. 2003). While the identity of the transcription activators for many Ox cluster genes is unknown, RP genes, at which Snf2 is strongly enriched (Shivaswamy and Iyer 2008; Parnell et al. 2015), are activated by Ifh1, which contains a potent acidic transcriptional activation domain (Schawalder et al. 2004). Interestingly, the functions of both SWI/SNF and Ifh1 are negatively regulated by acetylation mediated by Gcn5 (Kim et al. 2010; Downey et al. 2013); thus, protein acetylation likely has a complex role in regulating chromatin remodeling during expression of Ox genes.
The YMC and global chromatin organization
Chromatin is globally altered as cells progress through the YMC: First, we found that many NDRs become occupied. Second, we show that nucleosomes become more consistently spaced during R/C. The increased occupancy of NDRs appears to occur predominantly at previously described boundary elements, which is likely indicative of global chromosome and transcriptional restructuring that occurs in R/C. While our data are most consistent with extra nucleosomes being deposited within the NDRs, it is evident that these are highly labile entities, and it remains entirely possible that protein complexes other than nucleosomes occupy and protect these regions. We also found that nucleosome positioning becomes more consistent during the length of R/C, which we speculate is conducive to the generation of compact chromatin structures. Interestingly, entry into R/C is coordinated with mitosis, at which time chromosomes are highly compact. Thus, the ordered nucleosome arrays that we detected may promote internucleosomal interactions to induce chromosomal condensation (Wilkins et al. 2014). Given the recent finding that a decision to enter quiescence is made at mitotic exit (Spencer et al. 2013), it is noteworthy that mitosis coincides with entry into the quiescent-like R/C phase. Moreover, the chromosome reconfiguration that occurs during quiescence (Rutledge et al. 2015) is broadly similar to that which occurs in mitosis (Naumova et al. 2013). Thus, cells entering quiescence may maintain a form of the condensed “mitotic” chromosomes rather than establish the complex decondensed organization found in G1.
Materials and methods
Metabolic cycling of CEN.PK
The S. cerevisiae strain CEN.PK was used for these studies (MATa; URA3; TRP1; LEU2; HIS3; MAL2-8C; SUC2). YMC medium was prepared in batches of 10 L according to the recipe published by Tu et al. (2005). First, 9 L of medium containing all components except glucose was sterilized by autoclaving for 1 h. Subsequently, 1 L of 10% glucose (filter sterilized) was added to bring the volume to 10 L. Additionally, 5 mL of Antifoam 204 (Sigma) was added to a final concentration of 0.5 ml/L. YMC medium (1.5 L) was added to the sterile fermenter (Labfors 5), and the pH of the medium was brought to pH 3.4 with NaOH. Medium inside the fermenter was brought to 30°C, and a saturated starter culture of 15 mL of CEN.PK yeast grown in YPD was spun down, washed with sterile ddH20, and added to the medium in the fermenter. Air was pumped into the culture at a rate of 1.5 L per minute, the stirrer was set to 600 rpm, and the culture was allowed to grow to saturation. Starvation conditions were allowed to persist for a minimum of 6 h before the addition of fresh medium. To initiate the oscillations, fresh medium was added to the culture at a rate of 150 mL per hour. Simultaneously, medium was pumped out of the culture to maintain a constant volume of 1.5 L.
Digestion of chromatin with MNase
At each time point, 5 mL of YMC culture was added to 45 mL of 1× PBS and cross-linked with a final concentration of 1% formaldehyde for 10 min. The cross-linking was quenched with 5 mL of 2.5 M glycine for 5 min. Cells were subsequently spun down in 50-mL tubes and washed with 50 mL of sterile ddH20.
Cell pellets were resuspended in 950 µL of zymolyase digestion buffer (ZDB: 50 mM Tris Cl at pH 7.5, 1 M sorbitol, 10 mM b-mercaptoethanol). Fifty microliters of freshly prepared zymolyase solution (10 mg/mL in ZDB) was then added to each sample, and digestion proceeded for 45 min at 37°C. Spheroplasts were then pelleted in the microcentrifuge and washed with 1 mL of ZDB. Pellets were then gently resuspended in 1 mL of spheroplast digestion buffer (SDB: 1 M sorbitol, 50 mM NaCl, 10 mM Tris at pH 8, 5 mM MgCl2, 1 mM CaCl2, 1 mM b-mercaptoethanol, 0.075% NP40) and again pelleted in the microcentrifuge. The pellets were then gently resuspended in 0.5 mL of SDB with 50 U of MNase (Worthington) and gently agitated for 3 min at room temperature. Nuclease digestion was stopped by the addition of 50 µL of 0.5 M EGTA. To remove RNA from each sample, 10 µL of 10 mg/mL RNase I was added, and RNA degradation was allowed to proceed for at least 30 min at 37°C. Subsequently, 10 µL of 10 mg/mL proteinase K was added to each sample and incubated for >3 h at 42°C. To reverse the formaldehyde cross-links, the samples were incubated for >6 h at 65°C. Samples were then phenol-extracted and ethanol-precipitated with 1250 µL of ethanol and 10 µL of 3 M sodium acetate. Pellets were precipitated by spinning the samples at high speed in the tabletop centrifuge for 1 h at 4°C. Pellets were then washed with 70% ethanol and spun down for 5 min at room temperature. Residual ethanol was removed, and the pellets were resuspended in 100 µL of TE buffer (pH 8.0) and incubated for 1 h at 37°C.
Preparation of DNA sequencing libraries
Five-hundred nanograms of MNase-digested DNA from each sample was incubated with 10 U of PNK in a reaction containing 1× T4 ligase buffer and 1 mM dNTPs for 30 min at 37°C. Three units of T4 DNA polymerase was then added to each sample to “repair” the ends, and incubation was allowed to proceed for 15 min at 12°C. Subsequently, 1 µL of 0.5 M EDTA was added, and the reaction was killed by incubation for 20 min at 75°C. Ampure beads (1.8 vol) were added to each reaction to purify the nucleosomal DNA. DNA was resuspended in 15 µL of TE (pH 8.0) and dA tailed with Taq polymerase. Libraries were prepared with the NEBNext Multiplex kit with oligos for Illumina (E7335S).
Barcoded samples were then submitted for sequencing on the Illumina HiSeq platform by the Sloan Kettering Integrated Genomics Operations Core facility.
Mapping and processing of MNase-seq reads
The raw FASTQ paired-end reads were mapped to the S. cerevisiae genome (version R64-2-1 2014_11_18) using Bowtie2 (Langmead and Salzberg 2012) to generate files in the SAM format. SAM files were then converted into BAM files with SAMtools (Li et al. 2009), and the resulting BAM files were then processed with BEDtools (Quinlan and Hall 2010) to generate files in the BED format. The BED files containing the paired-end read data were then processed with the iNPS algorithm (Chen et al. 2014) with no modifications to the standard parameters of the software.
RNA-seq library preparation
RNA from each time point was extracted by using the hot phenol method, and libraries were generated with the NEBNext Ultra RNA library preparation kit for Illumina (catalog no. E7530L) as per manufacturer's instructions (Schmitt et al. 1990). Data were mapped and processed using Bowtie, SAMtools, and custom Perl scripts.
Definition of +1 nucleosomes
+1 nucleosomes were defined by their proximity to previously annotated TSSs (Pelechano et al. 2013). A window of 100 bp was established around each TSS, ranging from 20 bp upstream of the TSS to 80 bp downstream from the TSS. Nucleosomes with dyads within this window were classified as being +1.
Quantification of +1 shift for heat maps
The range of +1 shift was defined for each promoter by determining the distance in base pairs between the furthest upstream and downstream positions. The distance of the furthest upstream nucleosome from the TSS was assigned a value of 1, and the distance from the TSS of all other +1 positions associated with a promoter was accordingly assigned a fractional value.
Accession numbers
Sequencing data are available at the Gene Expression Omnibus (http://www.ncbi.nlm.nih.gov/geo) under accession number GSE77631.
Supplementary Material
Acknowledgments
We thank Toshi Tsukiyama (Fred Hutchinson Cancer Research Center, Seattle) and members of the Molecular Biology Program and Whitehouse laboratory for discussions and comments on the manuscript. This work was supported by institutional funds awarded to I.W., and National Institutes of Health grant P30 CA008748 (Memorial Sloan Kettering Cancer Center). N.N. and I.W. designed the experiments, N.N. performed the experiments, and N.N. and I.W. analyzed the data and wrote the paper.
Footnotes
Supplemental material is available for this article.
Article published online ahead of print. Article and publication date are online at http://www.genesdev.org/cgi/doi/10.1101/gad.274910.115.
References
- Altaf M, Auger A, Monnet-Saksouk J, Brodeur J, Piquet S, Cramet M, Bouchard N, Lacoste N, Utley RT, Gaudreau L, et al. 2010. NuA4-dependent acetylation of nucleosomal histones H4 and H2A directly stimulates incorporation of H2A.Z by the SWR1 complex. J Biol Chem 285: 15966–15977. [DOI] [PMC free article] [PubMed] [Google Scholar]
- Anderson JD, Thastrom A, Widom J. 2002. Spontaneous access of proteins to buried nucleosomal DNA target sites occurs via a mechanism that is distinct from nucleosome translocation. Mol Cell Biol 22: 7147–7157. [DOI] [PMC free article] [PubMed] [Google Scholar]
- Badis G, Chan ET, van Bakel H, Pena-Castillo L, Tillo D, Tsui K, Carlson CD, Gossett AJ, Hasinoff MJ, Warren CL, et al. 2008. A library of yeast transcription factor motifs reveals a widespread function for Rsc3 in targeting nucleosome exclusion at promoters. Mol Cell 32: 878–887. [DOI] [PMC free article] [PubMed] [Google Scholar]
- Cai L, Tu BP. 2012. Driving the cell cycle through metabolism. Annu Rev Cell Dev Biol 28: 59–87. [DOI] [PubMed] [Google Scholar]
- Cai L, Sutter BM, Li B, Tu BP. 2011. Acetyl-CoA induces cell growth and proliferation by promoting the acetylation of histones at growth genes. Mol Cell 42: 426–437. [DOI] [PMC free article] [PubMed] [Google Scholar]
- Chambers AL, Downs JA. 2012. The RSC and INO80 chromatin-remodeling complexes in DNA double-strand break repair. Prog Mol Biol Transl Sci 110: 229–261. [DOI] [PubMed] [Google Scholar]
- Chandy M, Gutierrez JL, Prochasson P, Workman JL. 2006. SWI/SNF displaces SAGA-acetylated nucleosomes. Eukaryot Cell 5: 1738–1747. [DOI] [PMC free article] [PubMed] [Google Scholar]
- Chatterjee N, Sinha D, Lemma-Dechassa M, Tan S, Shogren-Knaak MA, Bartholomew B. 2011. Histone H3 tail acetylation modulates ATP-dependent remodeling through multiple mechanisms. Nucleic Acids Res 39: 8378–8391. [DOI] [PMC free article] [PubMed] [Google Scholar]
- Chen W, Liu Y, Zhu S, Green CD, Wei G, Han JD. 2014. Improved nucleosome-positioning algorithm iNPS for accurate nucleosome positioning from sequencing data. Nat Commun 5: 4909. [DOI] [PubMed] [Google Scholar]
- Dion MF, Kaplan T, Kim M, Buratowski S, Friedman N, Rando OJ. 2007. Dynamics of replication-independent histone turnover in budding yeast. Science 315: 1405–1408. [DOI] [PubMed] [Google Scholar]
- Downey M, Knight B, Vashisht AA, Seller CA, Wohlschlegel JA, Shore D, Toczyski DP. 2013. Gcn5 and sirtuins regulate acetylation of the ribosomal protein transcription factor Ifh1. Curr Biol 23: 1638–1648. [DOI] [PMC free article] [PubMed] [Google Scholar]
- Eaton ML, Galani K, Kang S, Bell SP, MacAlpine DM. 2010. Conserved nucleosome positioning defines replication origins. Genes Dev 24: 748–753. [DOI] [PMC free article] [PubMed] [Google Scholar]
- Ganguli D, Chereji RV, Iben JR, Cole HA, Clark DJ. 2014. RSC-dependent constructive and destructive interference between opposing arrays of phased nucleosomes in yeast. Genome Res 24: 1637–1649. [DOI] [PMC free article] [PubMed] [Google Scholar]
- Gasch AP, Spellman PT, Kao CM, Carmel-Harel O, Eisen MB, Storz G, Botstein D, Brown PO. 2000. Genomic expression programs in the response of yeast cells to environmental changes. Mol Biol Cell 11: 4241–4257. [DOI] [PMC free article] [PubMed] [Google Scholar]
- Ghosh S, Pugh BF. 2011. Sequential recruitment of SAGA and TFIID in a genomic response to DNA damage in Saccharomyces cerevisiae. Mol Cell Biol 31: 190–202. [DOI] [PMC free article] [PubMed] [Google Scholar]
- Gkikopoulos T, Schofield P, Singh V, Pinskaya M, Mellor J, Smolle M, Workman JL, Barton GJ, Owen-Hughes T. 2011. A role for Snf2-related nucleosome-spacing enzymes in genome-wide nucleosome organization. Science 333: 1758–1760. [DOI] [PMC free article] [PubMed] [Google Scholar]
- Hartley PD, Madhani HD. 2009. Mechanisms that specify promoter nucleosome location and identity. Cell 137: 445–458. [DOI] [PMC free article] [PubMed] [Google Scholar]
- Hassan AH, Neely KE, Workman JL. 2001. Histone acetyltransferase complexes stabilize swi/snf binding to promoter nucleosomes. Cell 104: 817–827. [DOI] [PubMed] [Google Scholar]
- Hsieh TH, Weiner A, Lajoie B, Dekker J, Friedman N, Rando OJ. 2015. Mapping nucleosome resolution chromosome folding in yeast by Micro-C. Cell 162: 108–119. [DOI] [PMC free article] [PubMed] [Google Scholar]
- Hughes AL, Jin Y, Rando OJ, Struhl K. 2012. A functional evolutionary approach to identify determinants of nucleosome positioning: a unifying model for establishing the genome-wide pattern. Mol Cell 48: 5–15. [DOI] [PMC free article] [PubMed] [Google Scholar]
- Huisinga KL, Pugh BF. 2004. A genome-wide housekeeping role for TFIID and a highly regulated stress-related role for SAGA in Saccharomyces cerevisiae. Mol Cell 13: 573–585. [DOI] [PubMed] [Google Scholar]
- Jiang C, Pugh BF. 2009. A compiled and systematic reference map of nucleosome positions across the Saccharomyces cerevisiae genome. Genome Biol 10: R109. [DOI] [PMC free article] [PubMed] [Google Scholar]
- Jorgensen P, Rupes I, Sharom JR, Schneper L, Broach JR, Tyers M. 2004. A dynamic transcriptional network communicates growth potential to ribosome synthesis and critical cell size. Genes Dev 18: 2491–2505. [DOI] [PMC free article] [PubMed] [Google Scholar]
- Kaplan N, Moore IK, Fondufe-Mittendorf Y, Gossett AJ, Tillo D, Field Y, LeProust EM, Hughes TR, Lieb JD, Widom J, et al. 2009. The DNA-encoded nucleosome organization of a eukaryotic genome. Nature 458: 362–366. [DOI] [PMC free article] [PubMed] [Google Scholar]
- Kim JH, Saraf A, Florens L, Washburn M, Workman JL. 2010. Gcn5 regulates the dissociation of SWI/SNF from chromatin by acetylation of Swi2/Snf2. Genes Dev 24: 2766–2771. [DOI] [PMC free article] [PubMed] [Google Scholar]
- Klevecz RR, Bolen J, Forrest G, Murray DB. 2004. A genomewide oscillation in transcription gates DNA replication and cell cycle. Proc Natl Acad Sci 101: 1200–1205. [DOI] [PMC free article] [PubMed] [Google Scholar]
- Krebs JE, Fry CJ, Samuels ML, Peterson CL. 2000. Global role for chromatin remodeling enzymes in mitotic gene expression. Cell 102: 587–598. [DOI] [PubMed] [Google Scholar]
- Kuang Z, Cai L, Zhang X, Ji H, Tu BP, Boeke JD. 2014. High-temporal-resolution view of transcription and chromatin states across distinct metabolic states in budding yeast. Nat Struct Mol Biol 21: 854–863. [DOI] [PMC free article] [PubMed] [Google Scholar]
- Langmead B, Salzberg SL. 2012. Fast gapped-read alignment with Bowtie 2. Nat Methods 9: 357–359. [DOI] [PMC free article] [PubMed] [Google Scholar]
- Lee TI, Causton HC, Holstege FC, Shen WC, Hannett N, Jennings EG, Winston F, Green MR, Young RA. 2000. Redundant roles for the TFIID and SAGA complexes in global transcription. Nature 405: 701–704. [DOI] [PubMed] [Google Scholar]
- Lee CK, Shibata Y, Rao B, Strahl BD, Lieb JD. 2004. Evidence for nucleosome depletion at active regulatory regions genome-wide. Nat Genet 36: 900–905. [DOI] [PubMed] [Google Scholar]
- Li H, Handsaker B, Wysoker A, Fennell T, Ruan J, Homer N, Marth G, Abecasis G, Durbin R, 1000 Genome Project Data Processing Subgroup. 2009. The Sequence Alignment/Map format and SAMtools. Bioinformatics 25: 2078–2079. [DOI] [PMC free article] [PubMed] [Google Scholar]
- Luger K, Mader AW, Richmond RK, Sargent DF, Richmond TJ. 1997. Crystal structure of the nucleosome core particle at 2.8 A resolution. Nature 389: 251–260. [DOI] [PubMed] [Google Scholar]
- Mavrich TN, Ioshikhes IP, Venters BJ, Jiang C, Tomsho LP, Qi J, Schuster SC, Albert I, Pugh BF. 2008. A barrier nucleosome model for statistical positioning of nucleosomes throughout the yeast genome. Genome Res 18: 1073–1083. [DOI] [PMC free article] [PubMed] [Google Scholar]
- McKnight JN, Boerma JW, Breeden LL, Tsukiyama T. 2015. Global promoter targeting of a conserved lysine deacetylase for transcriptional shutoff during quiescence entry. Mol Cell 59: 732–743. [DOI] [PMC free article] [PubMed] [Google Scholar]
- Moreau JL, Lee M, Mahachi N, Vary J, Mellor J, Tsukiyama T, Goding CR. 2003. Regulated displacement of TBP from the PHO8 promoter in vivo requires Cbf1 and the Isw1 chromatin remodeling complex. Mol Cell 11: 1609–1620. [DOI] [PubMed] [Google Scholar]
- Naumova N, Imakaev M, Fudenberg G, Zhan Y, Lajoie BR, Mirny LA, Dekker J. 2013. Organization of the mitotic chromosome. Science 342: 948–953. [DOI] [PMC free article] [PubMed] [Google Scholar]
- Neef DW, Kladde MP. 2003. Polyphosphate loss promotes SNF/SWI- and Gcn5-dependent mitotic induction of PHO5. Mol Cell Biol 23: 3788–3797. [DOI] [PMC free article] [PubMed] [Google Scholar]
- Neely KE, Hassan AH, Brown CE, Howe L, Workman JL. 2002. Transcription activator interactions with multiple SWI/SNF subunits. Mol Cell Biol 22: 1615–1625. [DOI] [PMC free article] [PubMed] [Google Scholar]
- Novick A, Szilard L. 1950. Description of the chemostat. Science 112: 715–716. [DOI] [PubMed] [Google Scholar]
- Ohtsuki K, Kasahara K, Shirahige K, Kokubo T. 2010. Genome-wide localization analysis of a complete set of Tafs reveals a specific effect of the taf1 mutation on Taf2 occupancy and provides indirect evidence for different TFIID conformations at different promoters. Nucleic Acids Res 38: 1805–1820. [DOI] [PMC free article] [PubMed] [Google Scholar]
- Pan J, Sasaki M, Kniewel R, Murakami H, Blitzblau HG, Tischfield SE, Zhu X, Neale MJ, Jasin M, Socci ND, et al. 2011. A hierarchical combination of factors shapes the genome-wide topography of yeast meiotic recombination initiation. Cell 144: 719–731. [DOI] [PMC free article] [PubMed] [Google Scholar]
- Parnell TJ, Schlichter A, Wilson BG, Cairns BR. 2015. The chromatin remodelers RSC and ISW1 display functional and chromatin-based promoter antagonism. Elife 4: e06073. [DOI] [PMC free article] [PubMed] [Google Scholar]
- Pelechano V, Wei W, Steinmetz LM. 2013. Extensive transcriptional heterogeneity revealed by isoform profiling. Nature 497: 127–131. [DOI] [PMC free article] [PubMed] [Google Scholar]
- Pinon R. 1978. Folded chromosomes in non-cycling yeast cells: evidence for a characteristic g0 form. Chromosoma 67: 263–274. [DOI] [PubMed] [Google Scholar]
- Prochasson P, Neely KE, Hassan AH, Li B, Workman JL. 2003. Targeting activity is required for SWI/SNF function in vivo and is accomplished through two partially redundant activator-interaction domains. Mol Cell 12: 983–990. [DOI] [PubMed] [Google Scholar]
- Quinlan AR, Hall IM. 2010. BEDTools: a flexible suite of utilities for comparing genomic features. Bioinformatics 26: 841–842. [DOI] [PMC free article] [PubMed] [Google Scholar]
- Raisner RM, Hartley PD, Meneghini MD, Bao MZ, Liu CL, Schreiber SL, Rando OJ, Madhani HD. 2005. Histone variant H2A.Z marks the 5′ ends of both active and inactive genes in euchromatin. Cell 123: 233–248. [DOI] [PMC free article] [PubMed] [Google Scholar]
- Rando OJ, Winston F. 2012. Chromatin and transcription in yeast. Genetics 190: 351–387. [DOI] [PMC free article] [PubMed] [Google Scholar]
- Ranjan A, Mizuguchi G, FitzGerald PC, Wei D, Wang F, Huang Y, Luk E, Woodcock CL, Wu C. 2013. Nucleosome-free region dominates histone acetylation in targeting SWR1 to promoters for H2A.Z replacement. Cell 154: 1232–1245. [DOI] [PMC free article] [PubMed] [Google Scholar]
- Reinke H, Gregory PD, Horz W. 2001. A transient histone hyperacetylation signal marks nucleosomes for remodeling at the PHO8 promoter in vivo. Mol Cell 7: 529–538. [DOI] [PubMed] [Google Scholar]
- Rhee HS, Pugh BF. 2012. Genome-wide structure and organization of eukaryotic pre-initiation complexes. Nature 483: 295–301. [DOI] [PMC free article] [PubMed] [Google Scholar]
- Roberts SM, Winston F. 1997. Essential functional interactions of SAGA, a Saccharomyces cerevisiae complex of Spt, Ada, and Gcn5 proteins, with the Snf/Swi and Srb/mediator complexes. Genetics 147: 451–465. [DOI] [PMC free article] [PubMed] [Google Scholar]
- Rutledge MT, Russo M, Belton JM, Dekker J, Broach JR. 2015. The yeast genome undergoes significant topological reorganization in quiescence. Nucleic Acids Res 43: 8299–8313. [DOI] [PMC free article] [PubMed] [Google Scholar]
- Schawalder SB, Kabani M, Howald I, Choudhury U, Werner M, Shore D. 2004. Growth-regulated recruitment of the essential yeast ribosomal protein gene activator Ifh1. Nature 432: 1058–1061. [DOI] [PubMed] [Google Scholar]
- Schmitt ME, Brown TA, Trumpower BL. 1990. A rapid and simple method for preparation of RNA from Saccharomyces cerevisiae. Nucleic Acids Res 18: 3091–3092. [DOI] [PMC free article] [PubMed] [Google Scholar]
- Shi L, Sutter BM, Ye X, Tu BP. 2010. Trehalose is a key determinant of the quiescent metabolic state that fuels cell cycle progression upon return to growth. Mol Biol Cell 21: 1982–1990. [DOI] [PMC free article] [PubMed] [Google Scholar]
- Shivaswamy S, Iyer VR. 2008. Stress-dependent dynamics of global chromatin remodeling in yeast: dual role for SWI/SNF in the heat shock stress response. Mol Cell Biol 28: 2221–2234. [DOI] [PMC free article] [PubMed] [Google Scholar]
- Shivaswamy S, Bhinge A, Zhao Y, Jones S, Hirst M, Iyer VR. 2008. Dynamic remodeling of individual nucleosomes across a eukaryotic genome in response to transcriptional perturbation. PLoS Biol 6: e65. [DOI] [PMC free article] [PubMed] [Google Scholar]
- Silverman SJ, Petti AA, Slavov N, Parsons L, Briehof R, Thiberge SY, Zenklusen D, Gandhi SJ, Larson DR, Singer RH, et al. 2010. Metabolic cycling in single yeast cells from unsynchronized steady-state populations limited on glucose or phosphate. Proc Natl Acad Sci 107: 6946–6951. [DOI] [PMC free article] [PubMed] [Google Scholar]
- Spencer SL, Cappell SD, Tsai FC, Overton KW, Wang CL, Meyer T. 2013. The proliferation-quiescence decision is controlled by a bifurcation in CDK2 activity at mitotic exit. Cell 155: 369–383. [DOI] [PMC free article] [PubMed] [Google Scholar]
- Steger DJ, Haswell ES, Miller AL, Wente SR, O'Shea EK. 2003. Regulation of chromatin remodeling by inositol polyphosphates. Science 299: 114–116. [DOI] [PMC free article] [PubMed] [Google Scholar]
- Sudarsanam P, Iyer VR, Brown PO, Winston F. 2000. Whole-genome expression analysis of snf/swi mutants of Saccharomyces cerevisiae. Proc Natl Acad Sci 97: 3364–3369. [DOI] [PMC free article] [PubMed] [Google Scholar]
- Tirosh I, Sigal N, Barkai N. 2010. Widespread remodeling of mid-coding sequence nucleosomes by Isw1. Genome Biol 11: R49. [DOI] [PMC free article] [PubMed] [Google Scholar]
- Tolkunov D, Zawadzki KA, Singer C, Elfving N, Morozov AV, Broach JR. 2011. Chromatin remodelers clear nucleosomes from intrinsically unfavorable sites to establish nucleosome-depleted regions at promoters. Mol Biol Cell 22: 2106–2118. [DOI] [PMC free article] [PubMed] [Google Scholar]
- Tu BP, Kudlicki A, Rowicka M, McKnight SL. 2005. Logic of the yeast metabolic cycle: temporal compartmentalization of cellular processes. Science 310: 1152–1158. [DOI] [PubMed] [Google Scholar]
- Voss TC, Hager GL. 2014. Dynamic regulation of transcriptional states by chromatin and transcription factors. Nat Rev Genet 15: 69–81. [DOI] [PMC free article] [PubMed] [Google Scholar]
- Weiner A, Hsieh TH, Appleboim A, Chen HV, Rahat A, Amit I, Rando OJ, Friedman N. 2015. High-resolution chromatin dynamics during a yeast stress response. Mol Cell 58: 371–386. [DOI] [PMC free article] [PubMed] [Google Scholar]
- Whitehouse I, Flaus A, Cairns BR, White MF, Workman JL, Owen-Hughes T. 1999. Nucleosome mobilization catalysed by the yeast SWI/SNF complex. Nature 400: 784–787. [DOI] [PubMed] [Google Scholar]
- Whitehouse I, Rando OJ, Delrow J, Tsukiyama T. 2007. Chromatin remodelling at promoters suppresses antisense transcription. Nature 450: 1031–1035. [DOI] [PubMed] [Google Scholar]
- Wilkins BJ, Rall NA, Ostwal Y, Kruitwagen T, Hiragami-Hamada K, Winkler M, Barral Y, Fischle W, Neumann H. 2014. A cascade of histone modifications induces chromatin condensation in mitosis. Science 343: 77–80. [DOI] [PubMed] [Google Scholar]
- Wu L, Winston F. 1997. Evidence that Snf-Swi controls chromatin structure over both the TATA and UAS regions of the SUC2 promoter in Saccharomyces cerevisiae. Nucleic Acids Res 25: 4230–4234. [DOI] [PMC free article] [PubMed] [Google Scholar]
- Yen K, Vinayachandran V, Batta K, Koerber RT, Pugh BF. 2012. Genome-wide nucleosome specificity and directionality of chromatin remodelers. Cell 149: 1461–1473. [DOI] [PMC free article] [PubMed] [Google Scholar]
- Yudkovsky N, Logie C, Hahn S, Peterson CL. 1999. Recruitment of the SWI/SNF chromatin remodeling complex by transcriptional activators. Genes Dev 13: 2369–2374. [DOI] [PMC free article] [PubMed] [Google Scholar]
- Zhang H, Roberts DN, Cairns BR. 2005. Genome-wide dynamics of Htz1, a histone H2A variant that poises repressed/basal promoters for activation through histone loss. Cell 123: 219–231. [DOI] [PMC free article] [PubMed] [Google Scholar]
- Zhang Y, Moqtaderi Z, Rattner BP, Euskirchen G, Snyder M, Kadonaga JT, Liu XS, Struhl K. 2009. Intrinsic histone-DNA interactions are not the major determinant of nucleosome positions in vivo. Nat Struct Mol Biol 16: 847–852. [DOI] [PMC free article] [PubMed] [Google Scholar]
- Zhang L, Ma H, Pugh BF. 2011a. Stable and dynamic nucleosome states during a meiotic developmental process. Genome Res 21: 875–884. [DOI] [PMC free article] [PubMed] [Google Scholar]
- Zhang Z, Wippo CJ, Wal M, Ward E, Korber P, Pugh BF. 2011b. A packing mechanism for nucleosome organization reconstituted across a eukaryotic genome. Science 332: 977–980. [DOI] [PMC free article] [PubMed] [Google Scholar]
Associated Data
This section collects any data citations, data availability statements, or supplementary materials included in this article.