Abstract
In the development of human cell-based assays, 3-dimensional (3D) cell culture models are intriguing as they are able to bridge the gap between animal models and traditional two- dimensional (2D) cell culture. Previous work has demonstrated that MCF-7 human breast carcinoma cells cultured in a 3D scaffold-free culture system self-assemble and develop into differentiated microtissues that possess a luminal space. Exposure to estradiol for 7 days decreased lumen formation in MCF-7 microtissues, altered microtissue morphology and altered expression of genes involved in estrogen signaling, cell adhesion and cell cycle regulation. Exposure to receptor-specific agonists for estrogen receptor alpha, estrogen receptor beta and g-protein coupled estrogen receptor resulted in unique, receptor-specific phenotypes and gene expression signatures. The use of a differentiated scaffold-free 3D culture system offers a unique opportunity to study the phenotypic and molecular changes associated with exposure to estrogenic compounds.
Keywords: estrogens, three-dimensional models, in vitro assays, morphometrics, morphology
1. Introduction
As summarized in the National Research Council report “Toxicity Testing in the 21st Century: A Vision and a Strategy,” [1] there is a need to develop more efficient and physiologically relevant models for evaluation of chemical safety and toxicity. Due to the cost- and time-intensive nature of animal testing, in vitro screening models are needed. Additionally, in vitro cell culture models allow for the use of human cell lines, enabling researchers to better evaluate human health and disease states when compared to in vivo animal models.
Traditionally, human primary cells and cell lines have been cultured as 2- dimensional (2D) monolayers on plastic substrates. While 2D cultures are technically easy and inexpensive, they do not recapitulate the biology of cells in vivo, where tissues have high cell density and cells are in contact with other cell types and extracellular matrix (ECM). It has been demonstrated that contact between cells and with ECM can alter gene expression profiles and cellular morphology [2-5], potentially leading to differences in experimental results between 2D in vitro and intact in vivo systems.
As an alternative strategy to address several of the shortcomings of both in vivo and 2D in vitro experimental models, 3-dimensional (3D) culture models have been developed. The use of nonadhesive agarose hydrogels to culture cells in a scaffold-free environment allows for easy media changes and handling of cultures. In this system, cells are trypsinized and seeded into non-adhesive hydrogels, where they settle into recesses and come into contact with other cells [6]. Within 24 hours after seeding, cells self-assemble into microtissues free of the influence of added matrix and substrates [7]. Previous work using MCF-7 cells has demonstrated that when cultured in scaffold-free agarose hydrogels, MCF-7 cells form 3D microtissues that are more differentiated than 2D cultures and contain a luminal space, reminiscent of the in vivo morphology of the adult mammary gland [8].
Both normal and malignant mammary cell lines have been used extensively to study estrogen receptors and their respective signaling pathways, due to their expression of these receptors. Estrogen signaling occurs through both genomic and nongenomic pathways. Genomic signaling is mediated by nuclear receptors estrogen receptor alpha (ERα) and estrogen receptor beta (ERβ) that interact with DNA response elements to regulate gene expression following estrogen exposure, while nongenomic signaling is believed to proceed mainly through G-protein coupled estrogen receptor (GPER).
In the present study, the effects of estrogens on gene expression and morphology of 3D MCF-7 microtissues were assessed. Following exposure to selective estrogen receptor agonists, MCF-7 microtissues exhibited altered morphology, with a distortion of the luminal space that yielded compound-specific phenotypic changes. These changes were also associated with compound-specific gene expression changes. Here, we describe a novel system and methodology for assessing the phenotypic effects of estrogens on 3D MCF-7 microtissues. This platform offers an innovative method to assess tissue structural changes in a human cell line that cannot be assessed in many traditional monolayer in vitro systems.
2. Materials and Methods
2.1 Chemicals
Cell culture media and supplements were purchased from Life Technologies, Inc (Grand Island, NY). Fetal b ovine serum (FBS) was purchased from Atlanta Biologicals (Flowery Branch, GA) and dextran-coated-charcoal (DCC) stripped fetal bovine serum was purchased from Gemini Bioscience (Sacramento, CA). Estradiol (E2), dimethylsulfoxide (DMSO) and insulin were purchased from Sigma Aldrich (St. Louis, MO). Propylpyrazoletriol (PPT), diarylpropylnitrile (DPN), and G1 were purchased from Tocris Bioscience (Minneapolis, MN). Agarose was purchased from Fisher Scientific (Agawam, MA). Technovit 7100 was purchased from Heraeus Kulzer GmBH (Wehrheim, Germany).
2.2 Cell culture
MCF-7 (ATCC No. HTB-22) human breast carcinoma cells [9] were maintained in growth medium made of phenol-red free DMEM-F12 medium containing 10% FBS, MEM nonessential amino acids, gentamicin and 10μg/mL insulin in a 5% CO2 incubator at 37°C. Media was changed every 2-3 days and cells were passaged when 60-85% confluency was reached, as previously described [8]. To control for genetic drift and genomic instability, cells were limited to use within 10 passages of the original vial obtained from ATCC.
2.3 3D Culture Methods
We used 3D Petri Dish molds (Microtissues Inc., Providence RI) to make nonadhesive agarose hydrogels, which were seeded with cells as previously described [8] MCF-7 cells grown in monolayer in tissue culture flasks were trypsinized, counted and seeded into agarose hydrogels at a density of 600,000 cells/mL. MCF-7 cells were allowed to settle into recesses for 30 minutes, and 2mL of treatment media was added.
2.4 Compound exposure
Solutions of E2, PPT, DPN, G1 or vehicle control (DMSO) were made in treatment media made of phenol-red free DMEM-F12 medium containing 5% DCC FBS, MEM nonessential amino acids, gentamicin and 6ng/mL insulin. Following seeding of MCF-7 cells into agarose hydrogels, 2mL of treatment media conning E2, PPT or DMSO were added to agarose hydrogels. Plates were returned to a 5% CO2 incubator and allowed to grow for 7 days. Treatment media was changed every 2-3 days.
2.5 Histological Examination
For 3D microtissues, samples were fixed in 4% PFA overnight at 4°C, and then embedded in glycol methacrylate (Technovit 7100; Heraeus Kulzer GmBH, Wehrheim, Germany) as previously described [10] for histological examination. Sections were cut at a thickness of 3 μm, affixed to slides and stained with periodic acid, Schiffs reagent and counterstained with hematoxylin. Samples were viewed and images taken on an Aperio ScanScope CS (Aperio Technologies, Vista, CA) at 40× magnification.
2.6 Histological Quantification using Image J
Images of individual microtissues were collected and blinded before quantification in ImageJ. Images were prepared first by determining a pixel/micron ratio using embedded scale markers present in 16-bit images. Background (noncellular debris) was removed in ImageJ. Brightness and contrast were adjusted to allow for generation of binary images throught the default automatic thresholding procedure, and this was followed by morphological dilation (d=3). Using an automated count, the area of cellular objects was quantified. Particles of less than 500μm2 were excluded as cellular debris, while the area of cellular aggregates with and without luminal spaces were quantified (Supplemental Figure 1). Luminal area and total aggregate are were measured directly in ImageJ. Luminal ratio was calculated as the ratio of measured luminal area to measured total aggregate area. Cellular area was calculated as total aggregate area minus luminal area.
2.7 RNA Isolation and PCR Array Analysis
Microtissues were collected from hydrogels by centrifugation, pelleted and lysed in Trizol. Samples were then isolated using the RNEasy Mini Kit (Qiagen) per manufacturers instructions. A custom SABiosciences PCR Array (Qiagen) was created to include a list of 84 genes generated from literature to evaluate estrogen receptor signaling, breast and ductal morphogenesis, cellular growth and differentiation, proliferation, tumor progression and epithelial to mesenchymal transition as well as 5 housekeeping genes and contamination controls [8](Supplemental table 1). Samples were prepared per manufacturers instructions, and were added to 384-well plates using and epMotion 5075 automated pipettor (Eppendorf). Plates were run on an ABI 7900HT machine using cycling conditions recommended by the manufacturer.
2.8 Statistical Analysis
The raw PCR cycle (Ct) values were imported into the R statistical environment [11]. Raw PCR cycles were normalized (dCt) using the SLqPCR package [12] to optimize selection of house-keeping genes. To compare the expression of agonist-treated samples with vehicle- treated, the LIMMA package in R [13] was used to construct a linear model of adjusted dCt values. The empirical Bayes statistic (eBayes) was used and genes with an adjusted p-value significance for multiple comparisons (q value) of less than 0.05 were selected.
3. Results
MCF-7 microtissues treated for 7 days with varying concentrations of E2 exhibited decreased luminal spaces (Figure 1A, B, C) and increased cellular area (Figure 1A, D) in a concentration dependent manner. MCF-7 cells in 3D microtissues treated with estradiol lost polarity, became disorganized and lost the luminal morphology as E2 concentration increased.
Figure 1.
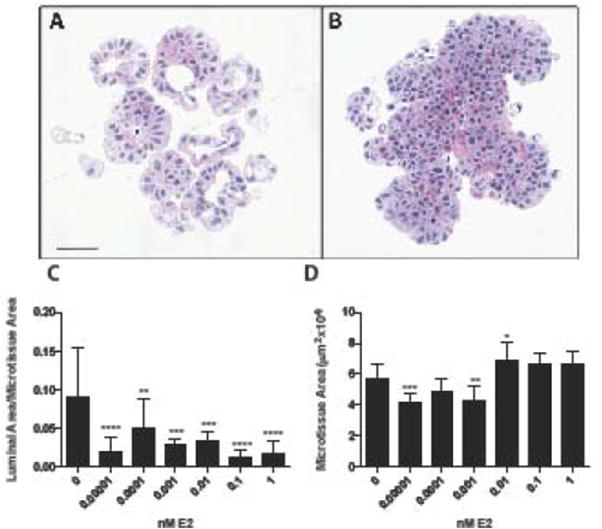
E2 treatment alters MCF-7 microtissue morphology. Histology of MCF-7 microtissues grown for 7 days in vehicle control (A) or 1nM estradiol (B)demonstrated distinct morphological differences resulting from treatment. MCF-7 microtissues exhibited decreased lumen formation, represented as luminal area/aggregate area in a concentration-dependent manner (C), and resulted in slight changes in microtissue area (D). Morphologic data is shown as mean ± SEM, and were analyzed using one-way ANOVA. Scale bar = 50μm. * p<0.05, ** p<0.01, *** p<0.001, ****p<0.0001
To determine changes in gene expression, a custom PCR array containing estrogen pathway-related targets was used. When treated for 7 days with estradiol, MCF-7 cells have altered expression of 22 transcripts (q value < 0.05) including genes involved in cell cycle regulation, apoptosis, cell adhesion and estrogen signaling (Table 1). Significantly increased transcripts with a fold change greater than 1.5 included PDZ containing domain 1 (PDZK1, q value=0.00078), v-myc avian myelocytomatosis viral oncogene (MYC, q=0.0036) and transforming growth factor beta 3 (TGFB3, q=0.0036). MCF-7 microtissues treated with E2 decreased expression of cyclin D kinase inhibitor 1A (CDKN1A, q=0.0049), cyclin E1 (CCNE1, q=0.0049), BCL2-associated agonist of cell death (BAD, q=0.0043), mitogen activated protein kinase 8 (MAPK8, q=0.0045), occludin (OCLN, q=0.0037), v-AKT murine thymoma viral oncogene homolog 1 (AKT1, q=0.00423) and caspase 3(CASP3, q=0.0013). Transcripts with decreased expression included mitogen activated protein kinase 1 (MAPK1, q=0.0036), tight junction protein 2 (TJP2, q=0.0040), beta catenin (CTNNB1, q=0.0013), tight junction protein 1 (TJP1, q=0.0013), androgen receptor (AR, q=0.0036), BCL2-like 1 (BCL2L1, q=0.0017) and bone morphogenic protein 4 (BMP4, q=0.00011). E2 treated MCF-7 microtissues also had decreased expression of v-erb-b2 avian erythroblastic leukemia viral oncogene homolog (ERBB2, q=0.00031), cytochrome P450 19A1 (CYP19A1, q=0.0037), estrogen receptor alpha (ESR1, q=0.0037), cytochrome P450 1A1 (CYP1A1, q=0.00011) and apolipoprotein D (APOD, q=3.8E-07). Complete gene expression results are summarized in Supplemental Table 2.
Table 1.
Signifcantly altered genes following 7 days of exposure to 1nM E2. MCF-7 microtissues were grown for 7 days in the presence of 1nM E2 or vehicle control. Q- significant genes with an absolute fold change value of greater than or equal to 1.5 were included, and are expressed relative to vehicle-treated control.
| Gene name | Abbreviation | Fold change | q value |
|---|---|---|---|
|
| |||
| PDZ containing domain 1 | PDZK1 | 3.39 | 0.000785 |
| Transforming growth factor beta 3 | TGFB3 | 2.95 | 0.003665 |
| v-myc avian myelocytomatosis viral oncogene homolog | MYC | 1.64 | 0.004019 |
| cyclin d kinase inhibitor 1A | CDKN1A | -1.50 | 0.004917 |
| Cyclin E1 | CCNE1 | -1.68 | 0.003413 |
| BCL2-associated agonist of cell death | BAD | -1.71 | 0.004335 |
| Mitogen activated protein kinase 8 | MAPK8 | -1.71 | 0.004486 |
| occludin | OCLN | -1.72 | 0.003665 |
| v-akt murine thymoma viral oncogene homolog 1 | AKT1 | -1.93 | 0.004232 |
| caspase 3 | CASP3 | -1.99 | 0.001280 |
| Mitogen activated protein kinase 1 | MAPK1 | -2.04 | 0.003665 |
| tight junction protein 2 | TJP2 | -2.16 | 0.004019 |
| beta catenin | CTNNB1 | -2.20 | 0.001280 |
| tight junction protein 1 | TJP1 | -2.28 | 0.001280 |
| androgen receptor | AR | -2.52 | 0.003665 |
| BCL2-like 1 | BCL2L1 | -2.56 | 0.001627 |
| bone morphogenic protein 4 | BMP4 | -3.69 | 0.000113 |
| v-erb-b2 avian erythroblastic leukemia viral oncogene homolog 2 | ERBB2 | -3.86 | 0.000310 |
| cytochrome P450 19A1 | CYP19A1 | -4.22 | 0.003665 |
| estrogen receptor alpha | ESR1 | -4.77 | 0.003665 |
| cytochrome P450 1A1 | CYP1A1 | -5.54 | 0.000113 |
| apolipoprotein D | APOD | -25.20 | 0.00000038 |
Microtissues of MCF-7 cells treated for 7 days with the ERα selective agonist PPT reveal a marked decrease luminal area at concentrations of 1nM and 10nM (Figure 2A, B, C) with no significant increase in total microtissue cellular area (Figure 2C). Following 7 days of treatment with 5nM PPT, MCF-7 cells exhibited altered expression of 6 transcripts, with increased PDZK1 (q=0.0045), cyclin A1 (CCNA1, q=0.00098), trefoil factor 1 (TFF1, q=0.0166) and claudin 1(CLDN1, q=0.040) expression. PPT-treated microtissues displayed decreased APOD (q=9.6E-05) and ESR1 (q=0.040) expression (Table 2). PPT-induced gene expression results are included in Supplemental Table 3.
Figure 2.
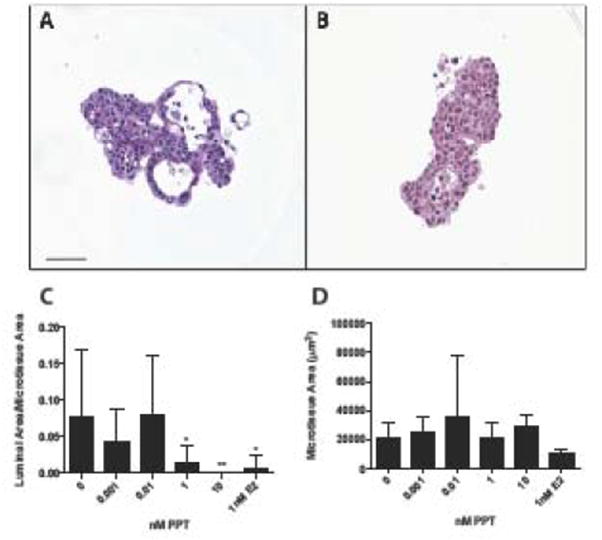
Selective estrogen receptor alpha activation by PPT disrupts MCF-7 microtissue morphology. Representative histological sections of 3D MCF-7 microtissues grown in vehicle control (A) or 5nM PPT (B) for 7 days. PPT treatment reduced the luminal formation within MCF-7 microtissues (C), and did not alter microtissue area (D). Data is displayed as mean ± SEM, with analysis using a one-way ANOVA. Scale bar = 50μm. * p<0.05, **p<0.01
Table 2.
Significantly altered genes following exposure to 5nM PPT for 7 days. Treatment with the ERα specfic agonist PPT for 7 days significantly altered expression of 7 transcripts. Absolute fold change values greater than or equal to 1.5 and q values less than 0.005 were included. Values are expressed relative to ve chile-treated controls.
| Gene name | Abbreviation | Fold change | q value |
|---|---|---|---|
| PDZ containing domain 1 | PDZK1 | 2.68 | 0.004578 |
| Cyclin A1 | CCNA1 | 2.56 | 0.000985 |
| Trefoil factor 1 | TFF1 | 1.64 | 0.016571 |
| Claudin 1 | CLDN1 | 1.60 | 0.040437 |
| Cytochrome P450 1A1 | CYP1A1 | -1.50 | 0.003628 |
| Estrogen receptor alpha | ESR1 | -1.70 | 0.040437 |
| Apolipoprotein 1 | APOD | -2.36 | 0.000096 |
Treatment with the ERβ agonist DPN resulted in an apparent decrease in the luminal area at concentrations 0.5 and 1nM following treatment for 7 days (Figure 3A and B) and an increase in cellular area at the high concentration of 10nM DPN (Figure 3C). Treatment with DPN for 7 days resulted in significantly decreased expression of APOD (q=5.2E-05; Supplemental Table 4).
Figure 3.
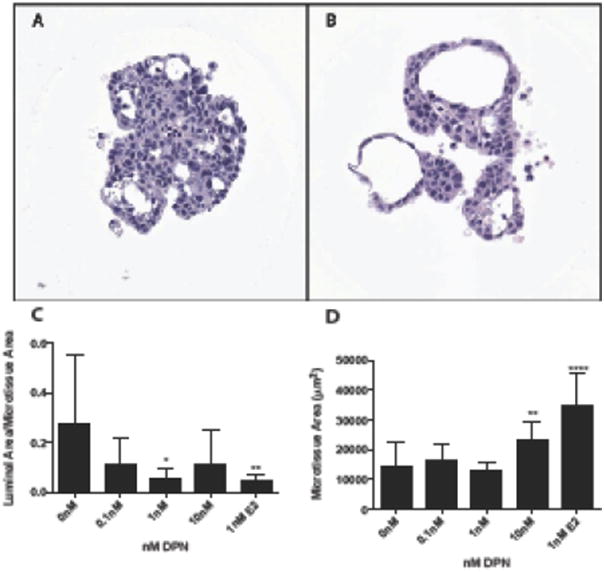
Estrogen receptor beta activation with DPN alters MCF-7 microtissue morphology at high concentrations. MCF-7 microtissues were grown for 7 days in the presence of vehicle control (A) or 5nM DPN (B). DPN treatment significantly reduced the luminal ratio at 1nM, while 10nM DPN treatment significantly increased cellular area. Data is represented as mean ± SEM, and was analyzed using one-way ANOVA. Scale bar = 50μm. * p<0.05, ** p<0.01, *** p<0.001, ****p<0.0001
Following 7 days of treatment with the GPER agonist G1, MCF-7 cells did not exhibit a significant change in luminal ratio (Figure 4), but did demonstrate an increase in cellular area at low concentrations compared to vehicle-treated controls (Figure 4). G1-treated microtissues did not significantly alter expression of transcripts (Supplemental Table 5).
Figure 4.
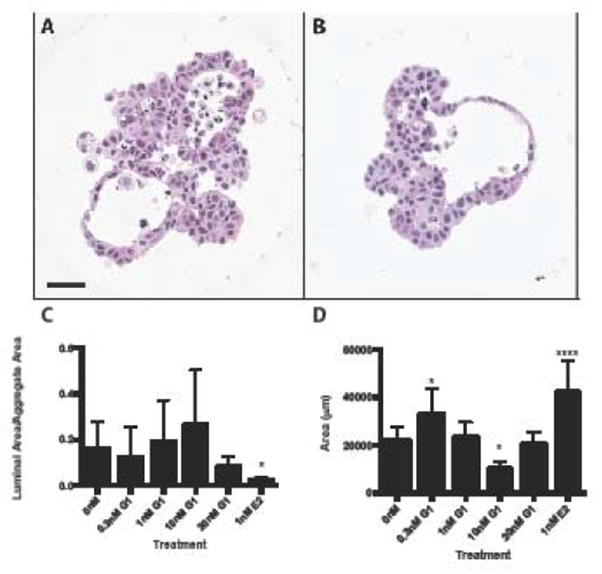
Activation of g-protein coupled estrogen receptor does not significantly alter MCF-7 microtissue morphology. MCF-7 microtissues were grown in the presence of vehicle control (A) or 0.3nM G1 (B) for 7 days. G1 treatment did not significantly alter MCF-7 luminal morphology (C). At 0.3nM G1, microtissue area was significantly increased, while at 10nM microtissue area was signiifcantly decreased (D). Morphologic data is shown as mean ± SEM, and were analyzed using one-way ANOVA. Scale bar = 50μm. * p<0.05, ** p<0.01, *** p<0.001, ****p<0.0001
Several gene expression targets exhibited overlap between agonist treatments, as E2 and PPT induced similar changes in CYP1A1, PDZK1 and ESR1, while DPN, E2 and PPT changed expression of APOD (Figure 5). E2 significantly changed expression of 19 unique transcripts, while DPN exposure altered expression of only ENPP2. G1 treatment did not alter expression of any transcripts, while PPT treatment resulted in altered expression of 3 distinct transcripts (Figure 5).
Figure 5.
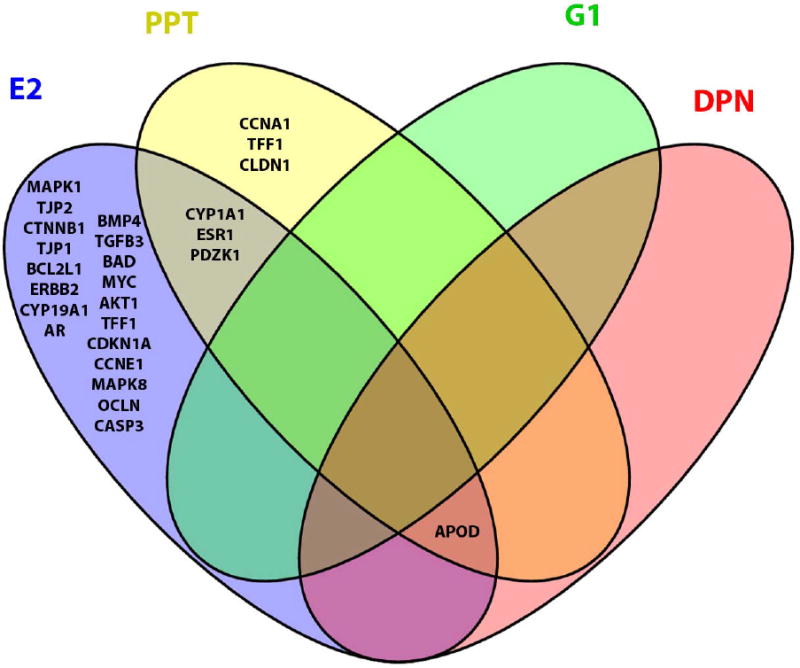
Selective estrogen receptor activation results in unique gene expression profiles. E2 (blue) altered expression of 19 unique transcripts, PPT (yellow) altered expression of 3 transcripts and G1 (green) resulted in altered expression of 1 transcript. G1 treatment did not share any significantly differentially expressed genes with any other treatments, however, E2, DPN and PPT shared expression of 1 transcript, while E2 and PPT shared 3 transcripts.
4. Discussion
MCF-7 microtissues display altered morphology following culture for 7 days in the presence of estrogen receptor agonists, with distinct, quantifiable phenotypes associated with selective pathway activation (Figure 6). MCF-7 microtissues exhibited increased proliferation and decreased differentiation (as indicated by luminal ratio) following the broad activation of estrogen receptors with E2. Similarly, activation of ERα by PPT increased proliferation and decreased differentiation, while activation of ERβ resulted in slight increases in proliferation, with not alteration in differentiation. Uniquely, specific activation of GPER by G1 resulted in no change in differentiation, and a decrease in proliferation at high concentrations. Together, these outcomes indicate that MCF-7 3D microtissues are sensitive to estrogenic compounds, and that activation of specific pathways yields unique morphologic changes.
Figure 6.
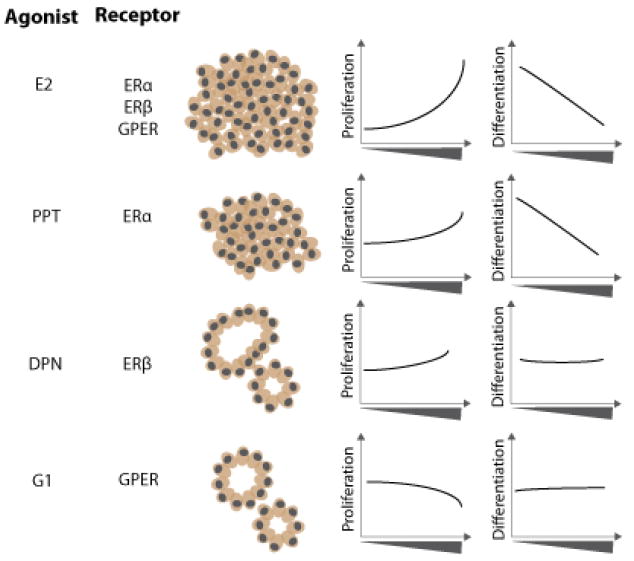
Selective receptor activation resulted in unique MCF-7 microtissue morphology. E2 treatment, which activated ERα, ERβ and GPER caused a concentration-dependent increase in proliferation and decrease in differentiation (luminal ratio). Selective activation of ERα using PPT resulted in a concentration-dependent increase in proliferation and decrease in microtissue differentiation. Activation of ERβ using the selective agonist DPN resulted in a significant increase in proliferation at high concentrations and no change in differentiation. GPER activation with G1 resulted in a decrease in proliferation at high concentrations, with no changes in differentiation.
As a result of culture in the presence of the endogenous estrogen receptor ligand E2, MCF- 7 microtissues contained a smaller luminal space with increased cellular area, indicating that exposure to E2 altered morphology, leading to a de-differentiated microtissue, compared to vehicle-treated controls. Previous work has demonstrated this to be true for E2 exposure in other breast cell lines cultured in scaffold-based 3D systems including Matrigel and collagen matrices. The spontaneously immortalized MCF-10F human breast cell line grown in a collagen matrix has demonstrated that exposure to E2 reduces ductologenesis [14], altering the phenotype of these cultures in a manner consistent with that caused by exposure to other carcinogens, including benzo-a-pyrene [15]. The MCF-10F cell line does not express high levels of estrogen receptors, and their expression must first be induced. To circumvent the need to induce estrogen receptors, more recent studies have focused on the use of normal, immortalized MCF-12A human breast epithelial cells grown in Matrigel [16]. MCF-12A cells grown in 3D form growth-arrested acini reminiscent of the in vivo structure of the human mammary gland. When exposed to estradiol this morphology is disrupted [16], similar to the results obtained in the current study.
When cultured in 2D in the presence of E2, MCF-7 cells have a more invasive phenotype, and exhibit a loss of polarity [17, 18]. In the present 3D study, MCF-7 microtissues treated with E2 developed an altered phenotype, with increased overall microtissue area and a decreased lumen, even at concentrations as low as 10fM. This finding suggests that in this model, upon exposure to estradiol, MCF-7 cells undergo a change in their morphogenesis in 3D, resulting in a disorganized microtissue that is less differentiated than untreated samples. In 2D cultures, while invasion and migration can be assessed using traditional assays, the phenotype of the culture as a whole is difficult to ascertain. The induction of this phenotype at low concentrations of E2 in the 3D culture model indicates this is a sensitive model to assess potential estrogenic activity. Further supporting this observation is the decrease in gene expression of transcripts that play a role in cell adhesion, including TJP1, TJP2 and CTNNB1 after E2 exposure. Previous work has indicated that MCF-7 cells cultured in 2D monolayer culture decrease expression of TJP1 following exposure to estradiol, which may lead to a more mesenchymal and invasive phenotype [19].
In the present study, select activation of ERα using the specific agonist PPT yielded several results that overlapped with E2 treatment, both in morphological changes and altered gene expression. Both PPT and E2 decreased the luminal ratio, while only E2 altered total cellular area, indicating that the loss of the luminal phenotype can be attributed to signaling mediated by ERα. In addition to the morphological changes, treatment with both E2 and PPT increased expression of the estrogen responsive target PDZK1[20], and decreased expression of ESR1, indicating that in this system, ERα is functional and responsive to E2. Decreased expression of ESR1 correlates with increased breast cancer progression in mouse [21], and the decrease in ESR1 expression observed in the present study may contribute to the observed loss of luminal phenotype in both E2- and PPT-treated microtissues. E2 exposure also altered genes that were significantly altered following both DPN and PPT treatment, indicating that there is overlap between ERα and ERβ signaling pathways. Another explanation for the high overlap between PPT and DPN treatments may be the relatively long time point of 7 days examined in the present study and the potential for initiation of downstream responses. Both ERα and ERβ have the capacity to bind genomic estrogen response elements, and at later time points, the specific transcriptional profiles resulting from activation through each isoform may be confounded. The role of ERβ within this system needs to be further elucidated. However, the alteration of specific genes altered with the agonists demonstrates the activation of each specific pathway, regardless of the timing, further strengthening the use of this system to investigate receptor-specific effects. In this study, there is a degree of variability in the control samples due to the use of histological sectioning, where controlling for the difference in z-direction is difficult. We expect that the adaptation of this culture system to a high-throughput confocal platform will help reduce variability in measurements.
In contrast to the morphologic and transcriptional changes observed following exposure to E2, PPT and DPN, G1 exposure did not significantly alter the luminal ratio of MCF-7 microtissues, but did significantly alter cellular area in a bi-modal concentration response. Recent work has indicated a role for GPER in E2-mediated proliferation, despite its role in rapid, non-genomic signaling [22], and the current study further supports that E2-induced proliferation is likely due to a balance in signaling dependent on both GPER and ERα. At high concentrations, GPER induction by G1 inhibited MCF-7 microtissue proliferation as previously reported [23], but at low concentrations G1 increased proliferation, in agreement with recent work [22].
Overall, the present study describes a system that can be used to assess potential estrogenicity by combining gene expression and morphologic analyses. Exposure to receptor agonists results in the generation of unique MCF-7 microtissue phenotypes, allowing for the potential to assess receptor-specific responses.
5.Conclusion
The present study is the first to examine and to quantify changes in MCF-7 3D scaffold-free microtissue morphology as an indicator of estrogenic exposure. Additionally, this system allows for the evaluation of receptor-specific effects, and for the combined examination of molecular changes and phenotypic alterations as a result of exposure. With its potential applications for phenotypic, high content screening, this sensitive system can provide information about the safety of chemicals and their estrogenic effects, which may allow for an improved understanding of adaptive versus adverse estrogenic endocrine disruptor responses.
Supplementary Material
Table 3.
Significantly altered transcripts following exposure to 5nM DPN for 7 days. DPN, a specific Erβ agonist, signifcantly decreased expression of APOD compared to vehicle control. Q-significant genes with an absolute fold change value of greater than or equal to 1.5 were included, and are expressed relative to vehicle-treated control.
| Gene name | Abbreviation | Fold change | p value |
| Apolipoprotein 1 | APOD | -2.5523804 | 5.17619E-05 |
Table 4.
| Gene name | Abbreviation | Fold change | p value |
| Growth response to estrogen, breast cancer | GREB | 3.71674206 | 0.012559037 |
Highlights.
Three-dimensional MCF-7 human breast carcinoma microtissue morphology is sensitive to disruption by estrogenic compounds.
Three-dimensional microtissue morphology changes are quantifiable and correspond to gene expression changes.
Selective activation of specific estrogen receptors alters microtissue morphology in a pathway-specific manner.
Acknowledgments
Major support for this research was provided NIEHS Training Grant T32 ES007272, Unilever, and the generous gift of Donna McGraw Weiss 89 and Jason Weiss, with additional support and useful discussions with the Human Toxome Consortium supported by NIHRO1ES 020750.
Footnotes
Conflict of Interest: Kim Boekelheide is an occasional expert consultant for chemical and pharmaceutical companies, and owns stock in Semma Therapeutics, a biotechnology company developing a cell-based therapy for diabetes.
Publisher's Disclaimer: This is a PDF file of an unedited manuscript that has been accepted for publication. As a service to our customers we are providing this early version of the manuscript. The manuscript will undergo copyediting, typesetting, and review of the resulting proof before it is published in its final citable form. Please note that during the production process errors may be discovered which could affect the content, and all legal disclaimers that apply to the journal pertain.
References
- 1.Krewski D, Acosta D, Andersen M, Anderson H, Bailar JC, Boekelheide K, et al. Toxicity testing in the 21st century: a vision and a strategy. Journal of Toxicology and Environmental Health, Part B. 2010;13(2-4):51–138. doi: 10.1080/10937404.2010.483176. [DOI] [PMC free article] [PubMed] [Google Scholar]
- 2.Gudjonsson T, Ronnov-Jessen L, Villadsen R, Rank F, Bissell MJ, Petersen OW. Normal and tumor-derived myoepithelial cells differ in their ability to interact with luminal breast epithelial cells for polarity and basement membrane deposition. Journal of cell science. 2002;115(Pt 1):39–50. doi: 10.1242/jcs.115.1.39. Epub 2002/01/22. [DOI] [PMC free article] [PubMed] [Google Scholar]
- 3.Kenny PA, Lee GY, Myers CA, Neve RM, Semeiks JR, Spellman PT, et al. The morphologies of breast cancer cell lines in three-dimensional assays correlate with their profiles of gene expression. Molecular oncology. 2007;1(1):84–96. doi: 10.1016/j.molonc.2007.02.004. Epub 2008/06/03. [DOI] [PMC free article] [PubMed] [Google Scholar]
- 4.Lee GY, Kenny PA, Lee EH, Bissell MJ. Three-dimensional culture models of normal and malignant breast epithelial cells. Nature methods. 2007;4(4):359–65. doi: 10.1038/nmeth1015. Epub 2007/03/31. [DOI] [PMC free article] [PubMed] [Google Scholar]
- 5.Streuli CH, Bailey N, Bissell MJ. Control of mammary epithelial differentiation: basement membrane induces tissue-specific gene expression in the absence of cell-cell interaction and morphological polarity. The Journal of cell biology. 1991;115(5):1383–95. doi: 10.1083/jcb.115.5.1383. Epub 1991/12/01. [DOI] [PMC free article] [PubMed] [Google Scholar]
- 6.Napolitano AP, Dean DM, Man AJ, Youssef J, Ho DN, Rago AP, et al. Scaffold-free three-dimensional cell culture utilizing micromolded nonadhesive hydrogels. BioTechniques. 2007;43(4):494-6–500. doi: 10.2144/000112591. [DOI] [PubMed] [Google Scholar]
- 7.Napolitano AP, Chai P, Dean DM, Morgan JR. Dynamics of the Self-Assembly of Complex Cellular Aggregates on Micromolded Nonadhesive Hydrogels. Tissue Engineering. 2007;13(8):2087–94. doi: 10.1089/ten.2006.0190. [DOI] [PubMed] [Google Scholar]
- 8.Vantangoli MM, Madnick SJ, Huse SM, Weston P, Boekelheide K. MCF-7 Human Breast Cancer Cells Form Differentiated Microtissues in Scaffold-Free Hydrogels. PloS one. 2015;10(8):e0135426. doi: 10.1371/journal.pone.0135426. Epub 2015/08/13. [DOI] [PMC free article] [PubMed] [Google Scholar]
- 9.Soule HD, Vazguez J, Long A, Albert S, Brennan M. A human cell line from a pleural effusion derived from a breast carcinoma. J Natl Cancer Inst. 1973;51(5):1409–16. doi: 10.1093/jnci/51.5.1409. [DOI] [PubMed] [Google Scholar]
- 10.Vantangoli MM, K PK, Rodd AL, Leary E, Madnick SJ, Morgan JR, Kane AB, et al. Into the Depths: Techniques for In Vitro Three-Dimensional Microtissue Visualization. Biotechniques. doi: 10.2144/000114353. in press. [DOI] [PMC free article] [PubMed] [Google Scholar]
- 11.Team RC. R: A language and environment for statistical computing. 2012 [Google Scholar]
- 12.Kohl M. SLqPCR: Functions for analysis of real-time quantitative PCR data at SIRS- Lab GmbH. 2007 [Google Scholar]
- 13.Smyth G. Limma: linear models for microarray data. In: Gentleman R, Carey V, Dudoit S, Irizarry R, Huber W, editors. Bioinformatics and Computational Biology Solutions Using R and Bioconductor. New York: Springer; 2005. pp. 397–420. [Google Scholar]
- 14.Russo J, Hu YF, Tahin Q, Mihaila D, Slater C, Lareef MH, et al. Carcinogenicity of estrogens in human breast epithelial cells. APMIS : acta pathologica, microbiologica, et immunologica Scandinavica. 2001;109(1):39–52. doi: 10.1111/j.1600-0463.2001.tb00013.x. Epub 2001/04/12. [DOI] [PubMed] [Google Scholar]
- 15.Russo J, Lareef MH, Tahin Q, Hu YF, Slater C, Ao X, et al. 17Beta-estradiol is carcinogenic in human breast epithelial cells. The Journal of steroid biochemistry and molecular biology. 2002;80(2):149–62. doi: 10.1016/s0960-0760(01)00183-2. Epub 2002/03/19. [DOI] [PubMed] [Google Scholar]
- 16.Marchese S, Silva E. Disruption of 3D MCF-12A breast cell cultures by estrogens--an in vitro model for ER-mediated changes indicative of hormonal carcinogenesis. PloS one. 2012;7(10):e45767. doi: 10.1371/journal.pone.0045767. Epub 2012/10/12. [DOI] [PMC free article] [PubMed] [Google Scholar]
- 17.DePasquale JA, Samsonoff WA, Gierthy JF. 17-beta-Estradiol induced alterations of cell-matrix and intercellular adhesions in a human mammary carcinoma cell line. Journal of cell science. 1994;107(Pt 5):1241–54. doi: 10.1242/jcs.107.5.1241. Epub 1994/05/01. [DOI] [PubMed] [Google Scholar]
- 18.Planas-Silva MD, Waltz PK. Estrogen promotes reversible epithelial-to- mesenchymal-like transition and collective motility in MCF-7 breast cancer cells. The Journal of steroid biochemistry and molecular biology. 2007;104(1-2):11–21. doi: 10.1016/j.jsbmb.2006.09.039. Epub 2007/01/02. [DOI] [PubMed] [Google Scholar]
- 19.Jimenez-Salazar JE, Posadas-Rodriguez P, Lazzarini-Lechuga RC, Luna-Lopez A, Zentella-Dehesa A, Gomez-Quiroz LE, et al. Membrane-initiated estradiol signaling of epithelial-mesenchymal transition-associated mechanisms through regulation of tight junctions in human breast cancer cells. Hormones & cancer. 2014;5(3):161–73. doi: 10.1007/s12672-014-0180-3. Epub 2014/04/29. [DOI] [PMC free article] [PubMed] [Google Scholar]
- 20.Ghosh MG, Thompson DA, Weigel RJ. PDZK1 and GREB1 are estrogen-regulated genes expressed in hormone-responsive breast cancer. Cancer research. 2000;60(22):6367–75. Epub 2000/12/05. [PubMed] [Google Scholar]
- 21.McCune K, Mehta R, Thorat MA, Badve S, Nakshatri H. Loss of ERalpha and FOXA1 expression in a progression model of luminal type breast cancer: insights from PyMT transgenic mouse model. Oncology reports. 2010;24(5):1233–9. doi: 10.3892/or_00000977. Epub 2010/09/30. [DOI] [PMC free article] [PubMed] [Google Scholar]
- 22.Scaling AL, Prossnitz ER, Hathaway HJ. GPER mediates estrogen-induced signaling and proliferation in human breast epithelial cells and normal and malignant breast. Hormones & cancer. 2014;5(3):146–60. doi: 10.1007/s12672-014-0174-1. Epub 2014/04/11. doi:10.1007/s12672-014- 0174-1. [DOI] [PMC free article] [PubMed] [Google Scholar]
- 23.Ariazi EA, Brailoiu E, Yerrum S, Shupp HA, Slifker MJ, Cunliffe HE, et al. The G protein-coupled receptor GPR30 inhibits proliferation of estrogen receptor-positive breast cancer cells. Cancer research. 2010;70(3):1184–94. doi: 10.1158/0008-5472.CAN-09-3068. Epub 2010/01/21. doi:10.1158/0008- 5472.CAN-09-3068. [DOI] [PMC free article] [PubMed] [Google Scholar]
Associated Data
This section collects any data citations, data availability statements, or supplementary materials included in this article.


