

Abstract
Prognostic stratification is critical for making therapeutic decisions and maximizing survival of patients with acute myeloid leukemia. Advances in the genomics of acute myeloid leukemia have identified several recurrent gene mutations whose prognostic impact is being deciphered. We used HaloPlex target enrichment and Illumina-based next generation sequencing to study 24 recurrently mutated genes in 42 samples of acute myeloid leukemia with a normal karyotype. Read depth varied between and within genes for the same sample, but was predictable and highly consistent across samples. Consequently, we were able to detect copy number changes, such as an interstitial deletion of BCOR, three MLL partial tandem duplications, and a novel KRAS amplification. With regards to coding mutations, we identified likely oncogenic variants in 41 of 42 samples. NPM1 mutations were the most frequent, followed by FLT3, DNMT3A and TET2. NPM1 and FLT3 indels were reported with good efficiency. We also showed that DNMT3A mutations can persist post-chemotherapy and in 2 cases studied at diagnosis and relapse, we were able to delineate the dynamics of tumor evolution and give insights into order of acquisition of variants. HaloPlex is a quick and reliable target enrichment method that can aid diagnosis and prognostic stratification of acute myeloid leukemia patients.
Introduction
Acute myeloid leukemia (AML) is a heterogeneous group of hematologic malignancies characterized by a differentiation block and unrestricted proliferation of myeloid precursors. Historically, AML classification was based on phenotypic criteria of the French-America-British (FAB) co-operative group.1 More recently, the World Health Organization (WHO) formulated an up-dated classification based on key genetic lesions underlying distinct clinico-pathological subgroups.2 With the exception of FAB AML-M3 (acute promyelocytic leukemia), there is limited overlap between subgroups of the FAB and WHO classifications. As recent clinical advances in AML have been driven by better prognostic stratification,3 the WHO classification has rapidly made its way into routine clinical practice in view of its prognostic and therapeutic implications.
However, advances in AML genomics,4,5 have demonstrated that even within WHO classes there exists significant heterogeneity, which can translate into different clinical outcomes.6 This is particularly true of patients with normal karyotype AML (AML-NK), who could be either over- or under-treated in the absence of prognostic information. In fact, AML-NK is driven by a complex interplay of several diverse leukemogenic mutations that may confer different prognosis based on their combinatorial patterns of co-occurrence. For example, the good prognostic value of NPM1- or CEBPA-mutations6–8 is annulled by the presence of FLT3 internal tandem duplications (FLT3-ITDs)9,10 in the same way as c-KIT mutations can negate the good prognostic impact of core binding factor translocations.11 Similarly, other genes or gene combinations appear to carry prognostic value,5,12 and this is being assessed in large patient cohorts. Additionally, gene mutations may serve as therapeutic targets as shown for example by the clinical efficacy of the tyrosine kinase inhibitor dasatinib for AML with c-KIT mutations,13,14 and by therapies targeting FLT3-ITD.15
Next generation sequencing (NGS) technologies introduced rapid sequencing of entire human genomes.16 AML with normal karyotype was the first cancer whose genome was fully sequenced,17 and the spectrum of its genomic alterations has since been characterized in hundreds of patients.4 Several technologies are now available that selectively enrich for relevant genes/regions (target enrichment) before NGS is performed. This allows for cheaper multiplexed sequencing of more cases, and moderates the complexity of downstream bioinformatics analyses. Such an approach, employing DNA pulldown with cRNA probes (Sureselect®, Agilent Technologies) was recently described in AML18 and myelodysplastic syndromes.19,20 However, this approach suffers from the need for laborious library preparation, long turnaround times and reduced sensitivity for detecting long insertions such as FLT3-ITDs.18 In this study, we employed the HaloPlex® (Agilent Technologies) target enrichment system, which is based on digestion of genomic DNA to produce fragments tiling target regions, followed by sequence-specific annealing to custom-made probes followed by PCR-amplification to produce tagged amplicons for sequencing. This system uses little input DNA and promises a more affordable, quick, and efficient target enrichment that may be more suitable for analysis in diagnostic laboratories.21 We used HaloPlex to study 24 recurrently mutated genes in 42 AML samples, mostly in the absence of matched normal DNA. Here we report its performance in identifying coding and copy number mutations affecting target genes.
Methods
Samples, DNA target enrichment, sequencing and alignment
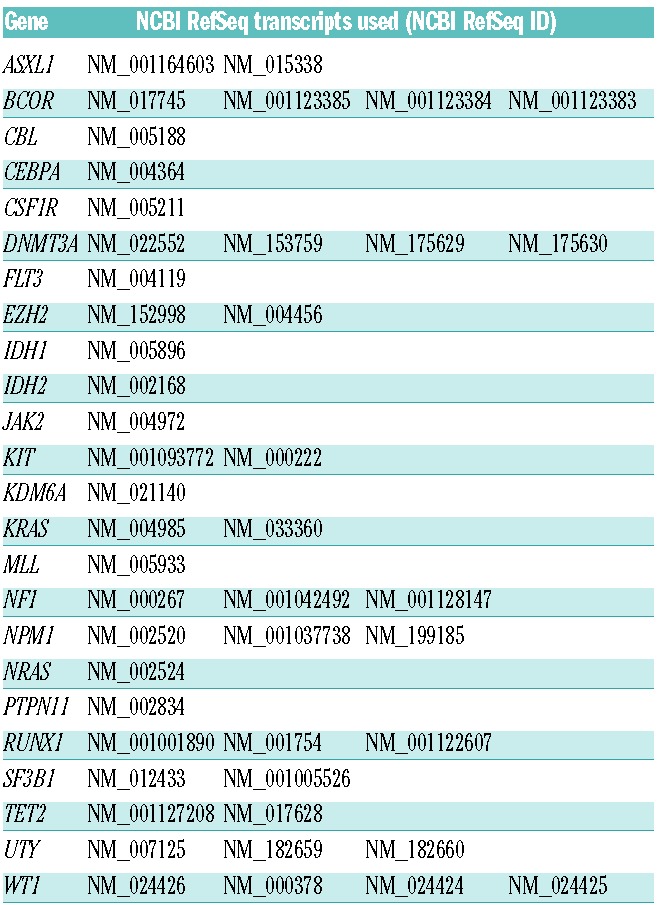
DNA was extracted from bone marrow of 40 AML-NK patients with more than 80% leukemic infiltrate at diagnosis. All patients had either karyotyping or multiplex PCR to rule out recurrent chromosomal translocations (HemaVision®-Screen, DNA Diagnostic A/S). Tumor samples were compared to an unrelated normal DNA sample (human placenta) for variant calling. For 2 patients, we collected bone marrow samples at diagnosis and at molecular relapse, identified by increased NPM1/ABL ratio by RT-qPCR. For 5 patients, a matched bone marrow sample was also available post-chemotherapy. Informed consent was obtained within our ethics-approved study (IRB 07/MRE05/44) and samples were stored in accordance with the Declaration of Helsinki. The 24 genes studied were selected based on their recurrence rate in AML and their relevance to pathogenesis and prognosis (Table 1). The targeting design was generated using an online design tool for HaloPlex and target enrichment was performed using HaloPlex standard protocol (v.2.0, November 2011). Briefly, 900 ng of DNA per sample were aliquoted into 8 digestion reactions, each containing 2 restriction enzymes. DNA from the 8 reactions was then pooled, hybridized to HaloPlex probes, and purified using magnetic beads. Fragments were ligated, amplified and barcoded through 19 PCR cycles, and two pools of 12 and 35 samples sequenced on one lane each of HiSeq2000 (Illumina), 100 bp paired-end protocol.
Table 1.
Genes and transcripts used for the targeted enrichment study.
Before alignment, 5 bp were trimmed from the start of each read to minimize possible mis-mapping due to restriction site sequence retention. Paired-end sequencing reads were aligned to the human genome (NCBI build 37) using BWA.22 Unmapped or off-target reads were excluded. Apparent PCR duplicates were not removed as HaloPlex generates fragments of the same start and end positions that cannot be distinguished from each other before or after PCR.
On-target performance and copy-number analysis
To determine the coverage of the target region, we used a BED file encoding the co-ordinates of the coding sequence of each of the 24 genes and retrieved the number of reads covering each base-pair position using Bedtools v.2.15.23 We then normalized coverage in each sample by dividing the read count at each position by the total number of on-target mapped bases for that sample. Coverage data and plots were produced using open-source software and bespoke R scripts (R v.3.0.3).24 To identify copy number alterations at individual exons, we compared the average coverage of each exon with that of normal samples. Genes with three or more exons showing read depths above or below the standard deviation of normal samples were examined further for amplifications or deletions.
Mutation calling algorithms
Substitutions and insertions/deletions were detected using CaVEMan and Pindel as previously described.19,25,26 Our main aim was to define driver events and therefore we only reported “likely oncogenic variants”, defined as variants already reported as somatic in AML literature, or novel variants clustering with known somatic variant hotspots, or truncating variants in genes implicated in AML through loss of function mutations. Relevant variants and copy number events were validated with orthogonal techniques. More details are provided in the Online Supplementary Appendix.
Results
Patients and sequencing metrics
The target region of 140,811bp did not include UTRs or introns and was sequenced with a mean coverage of 3,655× [(total output 39.91 gigabases (Gb)] (Figure 1A). The number of bases mapped on-target per sample was dependent on the degree of multiplexing and ranged from 0.13 to 1.26Gb (Figure 1A), representing an average of 66.33% of the total output. Unsurprisingly, there was a correlation between the depth of sequencing and the percentage of the target region covered at more than 1000X (P<2.2e-16) (Figure 1A) and at more than 30X, which we consider the minimum depth for reliable analysis (P=0.04) (Figure 1A). Coverage of each gene varied between samples depending on total sequencing output (Figure 1B), as did coverage of different genes within the same sample presumably due to factors such as PCR efficiency and GC content. Nevertheless, our study performed well as all genes were covered at more than 30X for at least 90% of their coding regions with the exception of the GC rich and notoriously hard to target CEBPA19 (Figure 1C).
Figure 1.
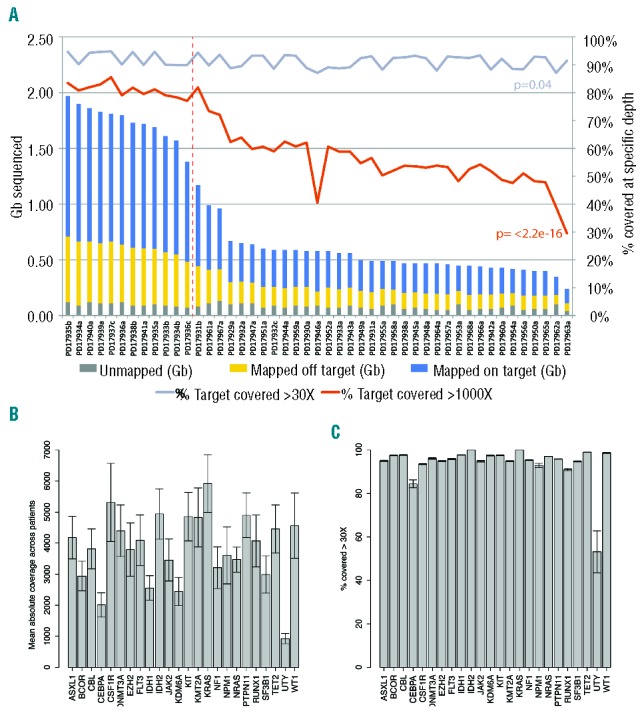
(A) Stacked bar chart showing the total sequence output in gigabases (Gb, left y-axis) per sample: gray, bases unmapped; yellow, bases mapped off target; blue, bases mapped on target. Samples plexed and sequenced in different HiSeq lanes are segregated by the dashed vertical line. Lines indicate the percentage of target covered at more than 30X (gray) and more than 1000X (red) – right y-axis. A Pearson’s test shows the correlation between sequence output and percentage of target covered at the above percentages. (B) Bar chart displaying the absolute coverage of each gene in the study, calculated as the mean coverage of that gene in all samples. Error bars represent standard deviation. (C) Bar chart showing, for each gene, the average percentage of the coding region covered at more than 30X in all samples (i.e. the minimum coverage used for variant calling). Error bars represent standard deviation. UTY, the Y chromosome homolog of KDM6A (UTX) was only covered by males in the study.
Factors affecting local coverage
Each fragment/read of HaloPlex target enrichment has a defined start site, unlike target enrichment generated using shearing, which produces fragments with different start and end points. We, therefore, asked whether the position of restriction sites could influence coverage of target regions.
We found significant variability looking at raw coverage across gene loci within each sample, with read depth following a “square wave” pattern. For example, coverage across consecutive bases of the CEBPA locus varied by several fold (Figure 2A), with drops in coverage likely dictated by PCR amplification differences as well as number and size of amplicons. Some reads of our 100 bp paired-end sequencing did not reach the middle portion of the few large amplicons longer than 200bp (Figure 2B) due to positions of restriction sites used in the genome. Therefore, we investigated whether amplicon length correlated with coverage across the entire target region. Coverage of amplicons less than 100bp was variable, whilst amplicons longer than 200 bp showed a percentage of missed bases that increased proportionally with their length (Figure 2C). Unsurprisingly, we found that coverage at each base-pair position strongly correlated with the number of amplicons covering it (Figure 2D), suggesting that tiling more amplicons over a region rescued coverage gaps in long amplicons. This also explains why not all amplicons longer than 200 bp demonstrate a drop in coverage (Figure 2C), as this phenomenon was mainly limited to regions covered by single amplicons. Finally, we asked if coverage was influenced by length of exons rather than amplicons, and we found that this was not the case (Figure 2E), again suggesting that tiling regions of interest with multiple amplicons can overcome gaps of coverage within long amplicons. Our data show therefore that the regional drops in coverage of HaloPlex target enrichment are predictable based on amplicon length and tiling, and not influenced by the size of the region/feature of interest. These factors should be considered as part of HaloPlex target enrichment designs.
Figure 2.
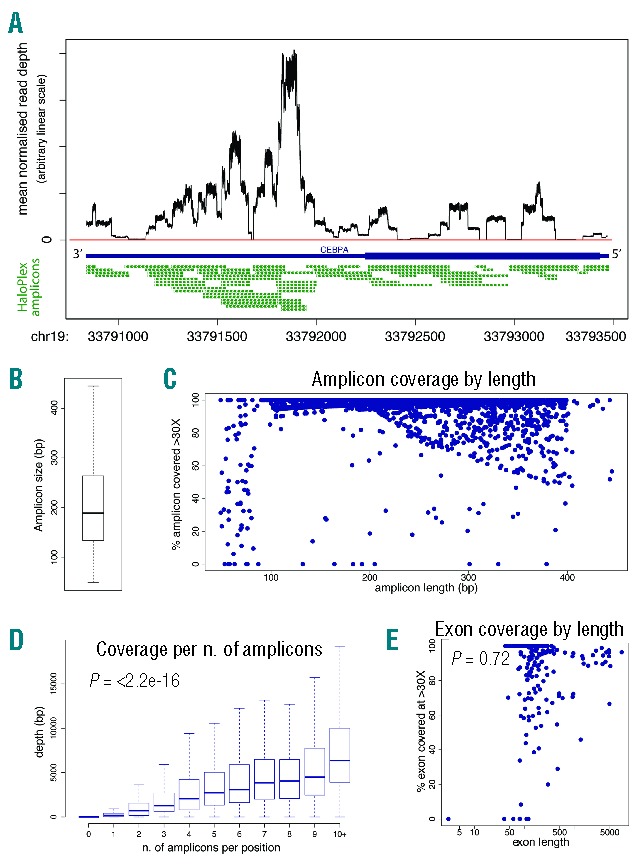
(A) Line graph showing base-by-base average normalized coverage of the CEBPA gene footprint. The CEBPA coding region is shown by a thick blue bar and the UTR regions by a thin blue bar. The horizontal red line highlights positions not covered (0 bp coverage). Below, the amplicons from HaloPlex design are shown in green. (B) Boxplot showing the distribution of amplicon size in the design. The central line is the median, and the box includes values between the first and third quartile. (C) Plot showing, for each amplicon in the design (blue dots), the relation between its length (x-axis) and the percentage of its bases covered at more than 30X. Note that the coverage drops in a fraction of amplicons longer than 200 bp (i.e. the combined length of the paired-end sequencing protocol), suggesting that the middle region of such large amplicons was not covered by either of the 100 bp paired-end reads, and no other amplicons were overlapping on that region. (D) Boxplot showing, for each base in the design, the positive correlation between the number of amplicons covering it (x-axis) and its average coverage in all samples (y-axis). The central line is the median, and the box includes values between the first and third quartile. (E) Plot showing that coverage (y-axis) of individual exons (blue dots) in the design is independent of their length (x-axis, in log scale).
Detection of copy-number changes
We observed that coverage varied significantly between different base positions from the same sample; however, coverage patterns appeared consistent between samples. In this context, we asked whether HaloPlex target enrichment data could identify copy number aberrations, as is the case for SureSelect target enrichment.18,19 We normalized coverage of each sample for on-target mapped bases, and plotted average depth for all genes in our samples (Figure 3A). All samples showed read depths for X- and Y-chromosome genes consistent with patient gender, with females consistently showing an approximately 2-fold increase in coverage of X-linked genes (BCOR and KDM6A, also known as UTX) and no coverage of the Y-linked gene UTY (the Y homolog of KDM6A). Interestingly, one male sample, PD19747a, showed a BCOR depth that was lower than other males in the cohort (black bar in Figure 3A). Coverage of all BCOR exons was significantly lower compared to the average of normal male samples (Figure 3B) suggesting this patient carries a BCOR deletion and this was indeed confirmed by quantitative PCR (Figure 3C). As sample PD17940a was previously shown to carry an MLL partial tandem duplication (PTD),18 we checked coverage of MLL exons between 2 and 10 and found that most showed a higher coverage than normal samples (Figure 3D) consistent with a duplication of the region. We found another 2 patients showing the same pattern (PD17948a and PD17957a, (Figure 3D), and went on to confirm the presence of MLL-PTDs by long-range PCR (Online Supplementary Figure S1A). Finally, one patient showed an amplification involving the KRAS locus (red bar in Figure 3A), which we confirmed by quantitative PCR (Figure 3E) and by CGH/SNP array (Online Supplementary Figure S1B).
Figure 3.

(A) For each gene in the study, the normalized average depth of coverage (y-axis) is plotted individually for all patients (x-axis) on a linear arbitrary scale. (B) PD17947a (black bar) shows a BCOR deletion involving all exons, whose coverage is lower than the average coverage of 3 normal male samples (white bar). The residual signal from all BCOR exons in PD17947a likely reflects that the deletion is subclonal, although a percentage of normal cells admixed in the tumor sample must also be taken into account. In the particular case of BCOR exon 5 the ratio between WT samples and PD17947a is different compared to neighboring exons, but this must be interpreted with caution. This exon showed the lowest coverage of all BCOR exons and a high number of homologous regions that could lead to mismapping and make it insensitive to copy number changes. (C) Quantitative PCR on genomic DNA shows lower levels of BCOR exons 1 and 4 in PD17947a (black, solid and dashed bars, respectively) compared to a control male sample (PD17948a, yellow). (D) PD17940a, PD17948a, and PD17957a (green, yellow and blue bars, respectively) show an MLL partial tandem duplication as shown by increased coverage of most exons between 1 and 10 compared to the average of 5 normal samples (white bars). (E) PD17946a (red bar) shows a KRAS amplification confirmed by qPCR on genomic DNA compared to a control sample in the study.
Given that read depth of gene loci returned a linear estimate of the copy number of the locus, we next looked at the quantitative value of substitution calls, and to this end we analyzed 90 of the most polymorphic SNPs within our target region.27 Of the heterozygous SNP calls, 84.6% were confined in a narrow allelic fraction window of 50+/−10% (Online Supplementary Figure S1).
Therefore, despite HaloPlex target enrichment returning variable coverage of different target regions, this variation is predictable, consistent across samples, and not significantly biased by PCR amplification. Depth of coverage retained quantitative value at the gene- and base-pair level and could identify copy number alterations with pathogenic and prognostic value.
Study controls
We next turned our attention to DNA sequence variants. First, we demonstrated that our algorithm identified likely oncogenic somatic variants and not inherited polymorphisms without the use of matched normal DNA. We did this by comparing the 16 variants called by our unmatched variant detection pipeline to matched post-chemotherapy DNA in 5 patients for whom this was also available (Figure 4A). Thirteen of 16 mutations were not present in the post-chemotherapy sample suggesting these were somatic mutations. Of 3 patients showing persistence of one oncogenic variant each, 2 were in complete hematologic remission and one in partial remission with normal blood counts. Interestingly, the two variants with high allelic frequency in the post-chemotherapy sample were DNMT3A R882H substitutions, recently reported to persist in pre-leukemic cells after AML remission.28 The other, a TET2 nonsense mutation, showed a marked drop in allelic fraction consistent with incomplete molecular response. This shows that our pipeline can reliably identify somatic oncogenic events in unmatched samples, but underscores the limitation of using post-chemotherapy samples as matched controls in AML NGS studies.
Figure 4.
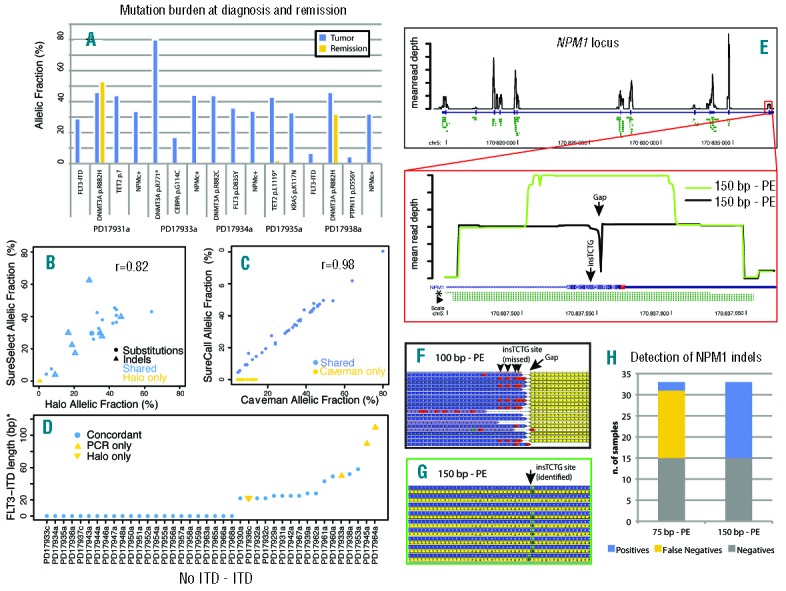
(A) For 5 patients in the study for whom a post-chemotherapy sample was available, the somatic status of 16 variants was checked. The y-axis represents the raw allelic fraction of the variant, and the x-axis represents individual variants, clustered by patient, in the tumor (blue bar) and remission (yellow) sample. Note that DNMT3A R882H persists at a similar allelic fraction in post-chemotherapy samples, independent of the remission status of the patient. Also, the persistence of a low-level TET2 p.L1119* nonsense mutation suggests that patient had a partial molecular response to treatment. (B) For 25 variants, validation data was available from a previous study performed with SureSelect target enrichment. The plot shows the allelic fraction of variants in the HaloPlex study (x-axis) and that of the SureSelect study (y-axis). Variants are represented as solid circles (substitutions) or open triangles (indels), and are blue if shared between the two studies and yellow if only reported by the HaloPlex study. The plot shows good correlation of allelic fraction between the two studies. (C) For the 61 substitutions in the study, two different algorithms were compared (Caveman and SureCall). Shared variants are in blue, variants missed by SureCall are in yellow. For the shared variants, the correlation between allelic fractions is near perfect. (D) For 40 samples in the study (x-axis), FLT3-ITDs are plotted by length (y-axis, value=0 if no ITD present). Variants confirmed by both Pindel and PCR are blue circles, those only found by PCR are yellow upwards triangles, and those only found by NGS are yellow downwards triangles. (E) (Top) Black line shows base-by-base average normalized coverage of the NPM1 gene locus. The NPM1 coding region is shown by a thick blue bar and the UTR regions by a thin blue bar. Predicted amplicons from HaloPlex design are shown in green. (Bottom) Zoomed-in view of NPM1 exon 12. Coverage by 100 bp reads is shown as a black line and leaves a 1-bp gap close to the NPM1c+ insertion site. The amplicon closer to NPM1c+ mutations and allowing their identification is highlighted by an asterisk, while the amplicons where such mutations were missed are marked by an arrowhead. When 150 bp reads are employed (green line), coverage of the middle region increases. (F) Aligned reads from a 100 bp sample where the mutation was missed because of short read length leaving a gap in coverage (arrow). Yellow: reverse reads. Blue: forward reads. The presence of the indel must be deducted by the BWA calls (red boxes, arrowheads). (G) Aligned reads from a 150 bp sample where the mutation was identified. Yellow: reverse reads. Blue: forward reads. The insertion is identified by Pindel as green boxes (arrow). (H) Stacked bar chart showing the increase in sensitivity of Pindel for detection of NPM1 indels with a 150 bp protocol.
Next, we confirmed that HaloPlex identifies real variants by looking at the 25 mutations found in 8 patients that were previously studied using SureSelect DNA pulldown.18 These 25 variants included all 23 called by SureSelect,18 including those present at subclonal level (Figure 4B), showing a high reliability of HaloPlex calls. An additional two variants were missed by SureSelect, both FLT3-ITDs, which are notoriously hard to identify by targeted enrichment approaches18,29 (E Papaemmanuil, Wellcome Trust Sanger Institute, personal communication, 2014). Additionally, and notwithstanding the fact that the allelic burden of indels is hard to assess reliably, the correlation between allelic fractions of variants from the two enrichment methods was good, indicating that HaloPlex has similar quantitative properties to SureSelect.
Caveman is a proprietary algorithm and thus we asked whether HaloPlex data would allow for reproducible results with other software. We compared Caveman substitution calls and allelic frequencies to those generated by SureCall (v.1.1, Agilent Technologies). SureCall missed 23 of 61 substitutions detected by Caveman, including known oncogenic ones. All missed variants had an allelic burden less than 15%, suggesting that SureCall performs less well in detecting subclonal variants (Figure 4C), although this may be surmountable by newer versions of the software. Nevertheless, for variants detected by both algorithms, the correlation between allelic frequencies was near perfect (Figure 4C).
Because NPM1 and FLT3 indels are frequent variants and key prognostic indicators in AML-NK, we specifically evaluated the performance of the open source software Pindel in detecting these variants as compared to PCR-based genotyping. NGS and PCR were concordant on the FLT3-ITD status in 36 of 40 evaluable samples (Figure 4D). In 3 cases, the ITD was found by PCR but not by NGS, and these were found to be large ITDs that may have not been amplified or mapped by BWA. In one case, a short ITD was only found by NGS, and we presume that it represented a subclonal event that PCR could not detect/discriminate. Conversely, Pindel only reported NPM1 C-terminal indels in 7 of 26 cases shown to carry the mutation by PCR. Looking at NPM1 exon 12, we found a marked coverage drop of position chr 5:170837554, i.e. few bp away from the insertion site of most NPM1 indels. The reason for this was that all but one amplicons covering the region were more than 200bp long, and thus their midpoints were beyond the reach of either 100bp paired-end read (Figure 4E, bottom panel, arrowhead). This design pitfall also caused NPM1 indels to be close to the end of the reads, and thus discarded by Pindel and under-reported. Since only one amplicon covered the mutation in a position amenable to sequencing (Figure 4E, asterisk), NPM1 variants were only called in samples where this amplicon was sequenced with enough coverage (P=0.01). Nevertheless, NPM1 indels from all amplicons were mapped by BWA, and visual inspection of the reads did allow their identification in all mutated cases (Figure 4F). To confirm that a short read length relative to the size of the amplicons covering the mutations was the reason for the poor detection of NPM1 indels, we re-sequenced HaloPlex libraries for 33 samples using MiSeq (Illumina) with a 150bp paired-end protocol. As expected, coverage of the NPM1 indel region was much higher (Figure 4E, green line), and all indels were called by Pindel (Figure 4G) with 100% sensitivity and specificity (Figure 4H). The presence of NPM1 mutations was further validated by capillary sequencing in all but one sample for which we did not have additional DNA (Online Supplementary Table S2).
Overall, 115 of 119 variants identified by HaloPlex were studied by PCR and/or MiSeq. Of the 103 that passed quality control, 96 were confirmed. Importantly, we could validate both clonal and subclonal variants indicating that HaloPlex can enrich target DNA allowing identification of variants across a range of allelic frequencies. Of the remaining 7 variants, 4 were false positives and 3 were sublclonal indels below the detection threshold of standard PCR (Online Supplementary Table S2).
Gene mutations
We reported 119 variants in 20 genes in 41 out of 42 samples, with a median of 3 variants per sample (Figure 5A and Online Supplementary Table S2). The most frequently mutated gene was NPM1 (62%), followed by FLT3 (50%), DNMT3A and TET2 (33% and 29%, respectively). As previously described, there was a positive correlation between NPM1 mutations and FLT3 (Fisher’s exact; P=0.008). We also observed a tendency towards correlation between NPM1 and DNMT3A, and towards mutual exclusivity between TET2 and IDH1/2 mutations. Two or more FLT3-ITD alleles were identified in 3 of 14 samples. Allelic frequency could not be reliably estimated in these indels making it impossible to determine if they occurred in the same cells (compound heterozygosity), or in different subclones of the tumor (convergent evolution). Similarly, two TET2 mutated alleles were found in 2 of 10 patients, reflecting a heterogeneous and evolving mutational pattern. Lastly, we annotated a p.S1018Y missense variant in UTY, a paralog of KDM6A not implicated in AML before. The variant was previously reported as somatic in a gastrointestinal cancer invoking a possible pathogenic role in AML.
Figure 5.
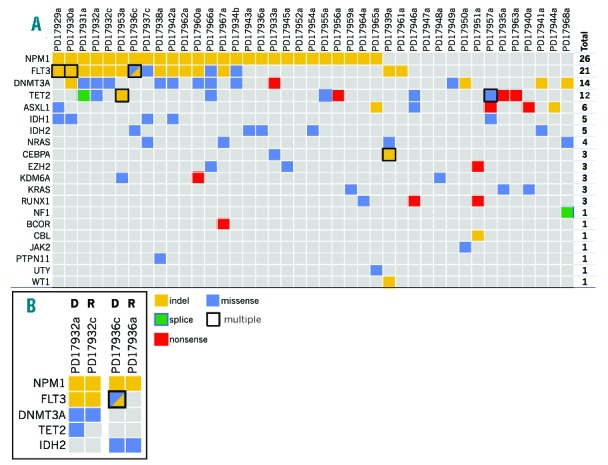
(A) Highlights relevant genetic alterations and recurrently mutated genes in the study. Samples are represented in columns. Recurrently mutated genes are color-coded for missense (blue), nonsense (red), splice-site (green) the substitutions, and indels (yellow). In the case of multiple mutations of the same class in a gene in a patient, a black contour is drawn. If two mutations of a different class are present, the box is filled by two triangles. For each gene, the number of patients harboring at least one non-silent mutation is provided in the “TOTAL” column. (B) For 2 patients for whom diagnosis (D) and relapse (R) samples where available, the mutational spectrum is provided to show evolution of the cancer over time.
While allelic frequency can be used to assess the subclonal structure of tumors,25 most of our variants were represented by indels and this precluded such analysis. Nevertheless, in 2 patients for whom paired diagnosis-relapse samples were available, we showed loss of a subclonal TET2 mutation in PD17932, and loss of a biallelic FLT3-ITD and a subclonal FLT3 N676K substitution in PD17936 at molecular relapse (Figure 5B). This confirms that the subclonal structure of AML can develop through continuous acquisition of subclones with new driver mutations and loss of others, in a pattern consistent with branching evolution and differential sensitivity to chemotherapy as has been shown by others.28,30
Discussion
Dramatic advances in defining the somatic genome of AML4 have defined the major mutational drivers of this disease.31 As a result, the field is ready for targeted follow-up studies aimed at better characterizing the prevalence, prognostic value and pathogenic role of these genetic lesions in large cohorts of patients. Indeed, information on mutated genes is making its way into new prognostic models,5 especially in cases without recurrent karyotype rearrangements.12 In this paper, we describe a rapid, robust and high-throughput approach for the characterization of gene mutations and copy number changes in AML samples using HaloPlex target enrichment followed by NGS and standard bioinformatic analysis. We showed that amplicon tiling and read length relative to amplicon length are the two most important parameters affecting coverage of target regions. In HaloPlex, the position of restriction sites limits the extent to which sequencing start sites and amplicon lengths can be customized in the target enrichment design. Therefore, depending on tiling and amplicon length, adjacent genomic regions can show variable coverage. While the automated HaloPlex design tool works well in general, if mutational hotspots are anticipated it is advisable that these positions are checked manually to ensure they will be adequately covered. We showed that variability of coverage of HaloPlex data is reproducible and consistent across samples. Normalized coverage of each gene locus correlated with its copy number status, relative to the other samples in the cohort. This enabled us to identify small copy number changes without the need for matched normal DNA, as exemplified by the identification of 3 cases of MLL-PTDs. Furthermore, we report the novel finding that KRAS can be amplified and BCOR deleted in AML, reflecting the power of NGS techniques to interrogate tumor genomes in a high-throughput fashion. Clinical follow up was not available for our patients, and future studies will define the recurrence rate and prognostic role of these events in AML. Compared to genome-wide CGH arrays, we could only infer copy number of regions targeted in our design. Nevertheless, in the future, this property could be harnessed for the capture and study of a large number of polymorphic SNPs evenly spaced across the genome to allow the identification of whole-genome copy-number and loss-of-heterozygosity changes.
Our study had a positive predictive value of 96% for the identification of recurrent mutations in AML. Its ability to report indels, a frequent event in AML, was especially good. Large genomic insertions such as MLL-PTDs were identified by copy-number profile of individual exons. While NPM1 indels were initially under-reported by 100 bp reads because of a design flaw, employing longer reads allowed us to achieve 100% accuracy. We also found good efficiency for FLT3-ITDs, as we identified 14 of 17 ITD samples. This was facilitated by targeting both FLT3 exons and introns around the breakpoints, although the allelic fraction of such events was lower than expected for driver mutations. Therefore, we could only capture and/or map a fraction of the mutated DNA molecules, and our detection sensitivity could have been lower had we not sequenced so deeply. Capture, mapping and quantification of FLT3-ITD alleles is a major challenge that will likely require bespoke targeting and bioinformatic approaches, especially for longer ITDs that were missed in our study.29,32 On the other hand, we suggest that deep sequencing can provide increased sensitivity for short and subclonal ITDs that may be easily missed by conventional PCR, leading to incorrect prognostic characterization of the patient. Indeed, in our study we identified 3 subclonal NPM1 and FLT3 indels that could not be confirmed by PCR followed by agarose gel electrophoresis or capillary sequencing. We believe these were true positive results, and the fact that other subclonal variants were validated in our study suggests their veracity. Subclonality in AML is increasingly recognized as a biological event with clinical implications.28,30,33 HaloPlex target enrichment led to the identification and validation of a number of subclonal variants, and loss/gain of variants at AML relapse. This has the potential to inform on the order of acquisition of such variants during pre-clinical stages of leukemia development and suggests that future, larger studies may be able to inform which variants are associated with better response to chemotherapy and which ones are most likely to confer chemoresistance. For example, our finding that TET2 mutations can be lost at relapse confirms that mutations in this gene can be late34 as well as early35 events in AML. Also, further studies will be required to assess the prognostic value of DNMT3A R882H persistence at morphological remission, and whether this variant should be used for assessment of minimal residual disease.
We anticipate that NGS technologies will soon be used for a combined gene sequencing and copy number analysis of tumors, thus providing a one-stop diagnostic platform that has the potential to enhance current analysis relying on the integration of karyotype, FISH, PCR and RT-PCR data. Future studies with large numbers of patients and longitudinal follow up will establish the diagnostic and prognostic value of recurrent abnormalities, and in our paper we show that HaloPlex target enrichment can provide a solid platform for this exercise.
Acknowledgments
We thank the Cambridge Blood and Stem Cell Biobank (CBSB,) National Institute of Health Research (NIHR) and the Cambridge Cancer Molecular Diagnosis Laboratory (CMDL) for assistance with sample acquisition and processing.
Footnotes
The online version of this article has a Supplementary Appendix.
Funding
This project was funded by the Wellcome Trust. NB is a fellow of the European Hematology Association and was supported by the Academy of Medical Sciences. EP is a European Hematology Association Advanced Research Fellow. GV is a Wellcome Trust Senior Fellow in Clinical Science. IV is funded by Spanish Ministerio de Economía y Competitividad subprograma Ramón y Cajal.
Authorship and Disclosures
Information on authorship, contributions, and financial & other disclosures was provided by the authors and is available with the online version of this article at www.haematologica.org.
References
- 1.Bennett JM, Catovsky D, Daniel MT, et al. Proposals for the classification of the acute leukaemias. French-American-British (FAB) co-operative group. British J Haematol. 1976;33(4):451–458. [DOI] [PubMed] [Google Scholar]
- 2.Jaffe E, Harris N, Stein H, Vardiman J. Pathology and genetics of tumours of hematopoietic and lymphoid tissues. Lyon, France: IARC Press; 2001. [Google Scholar]
- 3.Döhner H, Estey EH, Amadori S, et al. Diagnosis and management of acute myeloid leukemia in adults: recommendations from an international expert panel, on behalf of the European LeukemiaNet. Blood. 2010;115(3):453–474. [DOI] [PubMed] [Google Scholar]
- 4.Cancer Genome Atlas Research N. Genomic and epigenomic landscapes of adult de novo acute myeloid leukemia. N Engl J Med. 2013;368(22):2059–2074. [DOI] [PMC free article] [PubMed] [Google Scholar]
- 5.Patel JP, Gonen M, Figueroa ME, et al. Prognostic relevance of integrated genetic profiling in acute myeloid leukemia. N Engl J Med. 2012;366(12):1079–1089. [DOI] [PMC free article] [PubMed] [Google Scholar]
- 6.Vardiman JW, Thiele J, Arber DA, et al. The 2008 revision of the World Health Organization (WHO) classification of myeloid neoplasms and acute leukemia: rationale and important changes. Blood. 2009;114(5):937–951. [DOI] [PubMed] [Google Scholar]
- 7.Falini B, Martelli MP, Bolli N, et al. Acute myeloid leukemia with mutated nucleophosmin (NPM1): is it a distinct entity? Blood. 2011;117(4):1109–1120. [DOI] [PubMed] [Google Scholar]
- 8.Dufour A, Schneider F, Metzeler KH, et al. Acute myeloid leukemia with biallelic CEBPA gene mutations and normal karyotype represents a distinct genetic entity associated with a favorable clinical outcome. J Clin Oncol. 2010;28(4):570–577. [DOI] [PubMed] [Google Scholar]
- 9.Döhner K, Schlenk RF, Habdank M, et al. Mutant nucleophosmin (NPM1) predicts favorable prognosis in younger adults with acute myeloid leukemia and normal cytogenetics: interaction with other gene mutations. Blood. 2005;106(12):3740–3746. [DOI] [PubMed] [Google Scholar]
- 10.Renneville A, Boissel N, Gachard N, et al. The favorable impact of CEBPA mutations in patients with acute myeloid leukemia is only observed in the absence of associated cytogenetic abnormalities and FLT3 internal duplication. Blood. 2009;113(21):5090–5093. [DOI] [PubMed] [Google Scholar]
- 11.Cairoli R, Beghini A, Grillo G, et al. Prognostic impact of c-KIT mutations in core binding factor leukemias: an Italian retrospective study. Blood. 2006;107(9): 3463–3468. [DOI] [PubMed] [Google Scholar]
- 12.Schlenk RF, Döhner K, Krauter J, et al. Mutations and treatment outcome in cytogenetically normal acute myeloid leukemia. N Engl J Med. 2008; 358(18):1909–1918. [DOI] [PubMed] [Google Scholar]
- 13.Wang YY, Zhao LJ, Wu CF, et al. C-KIT mutation cooperates with full-length AML1-ETO to induce acute myeloid leukemia in mice. Proc Natl Acad Sci USA. 2011;108(6):2450–2455. [DOI] [PMC free article] [PubMed] [Google Scholar]
- 14.Chevalier N, Solari ML, Becker H, et al. Robust in vivo differentiation of t(8;21)-positive acute myeloid leukemia blasts to neutrophilic granulocytes induced by treatment with dasatinib. Leukemia. 2010; 24(10):1779–1781. [DOI] [PubMed] [Google Scholar]
- 15.Leung AY, Man CH, Kwong YL. FLT3 inhibition: a moving and evolving target in acute myeloid leukaemia. Leukemia. 2013; 27(2):260–268. [DOI] [PubMed] [Google Scholar]
- 16.Bentley DR, Balasubramanian S, Swerdlow HP, et al. Accurate whole human genome sequencing using reversible terminator chemistry. Nature. 2008;456(7218):53–59. [DOI] [PMC free article] [PubMed] [Google Scholar]
- 17.Ley TJ, Mardis ER, Ding L, et al. DNA sequencing of a cytogenetically normal acute myeloid leukaemia genome. Nature. 2008;456(7218):66–72. [DOI] [PMC free article] [PubMed] [Google Scholar]
- 18.Conte N, Varela I, Grove C, et al. Detailed molecular characterisation of acute myeloid leukaemia with a normal karyotype using targeted DNA capture. Leukemia. 2013;27(9):1820–1825. [DOI] [PMC free article] [PubMed] [Google Scholar]
- 19.Papaemmanuil E, Gerstung M, Malcovati L, et al. Clinical and biological implications of driver mutations in myelodysplastic syndromes. Blood. 2013;122(22):3616–3622. [DOI] [PMC free article] [PubMed] [Google Scholar]
- 20.Haferlach T, Nagata Y, Grossmann V, et al. Landscape of genetic lesions in 944 patients with myelodysplastic syndromes. Leukemia. 2014;28(2):241–247. [DOI] [PMC free article] [PubMed] [Google Scholar]
- 21.Berglund EC, Lindqvist CM, Hayat S, et al. Accurate detection of subclonal single nucleotide variants in whole genome amplified and pooled cancer samples using HaloPlex target enrichment. BMC Genomics. 2013;14:856. [DOI] [PMC free article] [PubMed] [Google Scholar]
- 22.Li H, Durbin R. Fast and accurate long-read alignment with Burrows-Wheeler transform. Bioinformatics. 2010;26(5):589–595. [DOI] [PMC free article] [PubMed] [Google Scholar]
- 23.Quinlan AR, Hall IM. BEDTools: a flexible suite of utilities for comparing genomic features. Bioinformatics. 2010;26(6):841–842. [DOI] [PMC free article] [PubMed] [Google Scholar]
- 24.R Core Team. A language and environment for statistical computing: R Foundation for Statistical Computing; 2014. [Google Scholar]
- 25.Bolli N, Avet-Loiseau H, Wedge DC, et al. Heterogeneity of genomic evolution and mutational profiles in multiple myeloma. Nat Commun. 2014;5:2997. [DOI] [PMC free article] [PubMed] [Google Scholar]
- 26.Ye K, Schulz MH, Long Q, Apweiler R, Ning Z. Pindel: a pattern growth approach to detect break points of large deletions and medium sized insertions from paired-end short reads. Bioinformatics. 2009; 25(21):2865–2871. [DOI] [PMC free article] [PubMed] [Google Scholar]
- 27.Genomes Project C, Abecasis GR, Auton A, et al. An integrated map of genetic variation from 1,092 human genomes. Nature. 2012;491(7422):56–65. [DOI] [PMC free article] [PubMed] [Google Scholar]
- 28.Shlush LI, Zandi S, Mitchell A, et al. Identification of pre-leukaemic haematopoietic stem cells in acute leukaemia. Nature. 2014;506(7488):328–333. [DOI] [PMC free article] [PubMed] [Google Scholar]
- 29.Spencer DH, Abel HJ, Lockwood CM, et al. Detection of FLT3 internal tandem duplication in targeted, short-read-length, next-generation sequencing data. J Mol Diagn. 2013;15(1):81–93. [DOI] [PubMed] [Google Scholar]
- 30.Ding L, Ley TJ, Larson DE, et al. Clonal evolution in relapsed acute myeloid leukaemia revealed by whole-genome sequencing. Nature. 2012;481(7382):506–510. [DOI] [PMC free article] [PubMed] [Google Scholar]
- 31.Lawrence MS, Stojanov P, Mermel CH, et al. Discovery and saturation analysis of cancer genes across 21 tumour types. Nature. 2014;505(7484):495–501. [DOI] [PMC free article] [PubMed] [Google Scholar]
- 32.Luthra R, Patel KP, Reddy NG, et al. Next-generation sequencing-based multigene mutational screening for acute myeloid leukemia using MiSeq: applicability for diagnostics and disease monitoring. Haematologica. 2014;99(3):465–473. [DOI] [PMC free article] [PubMed] [Google Scholar]
- 33.Klco JM, Spencer DH, Miller CA, Griffith M. Functional Heterogeneity of Genetically Defined Subclones in Acute Myeloid Leukemia. Cancer Cell. 2014;25(3):379–392. [DOI] [PMC free article] [PubMed] [Google Scholar]
- 34.Schaub FX, Looser R, Li S, et al. Clonal analysis of TET2 and JAK2 mutations suggests that TET2 can be a late event in the progression of myeloproliferative neoplasms. Blood. 2010;115(10):2003–2007. [DOI] [PubMed] [Google Scholar]
- 35.Busque L, Patel JP, Figueroa ME, et al. Recurrent somatic TET2 mutations in normal elderly individuals with clonal hematopoiesis. Nat Genet. 2012; 44(11): 1179–1181. [DOI] [PMC free article] [PubMed] [Google Scholar]