Abstract
International Prognostic Scoring Systems are used to determine the individual risk profile of myelodysplastic syndrome patients. For the assessment of International Prognostic Scoring Systems, an adequate chromosome banding analysis of the bone marrow is essential. Cytogenetic information is not available for a substantial number of patients (5%–20%) with dry marrow or an insufficient number of metaphase cells. For these patients, a valid risk classification is impossible. In the study presented here, the International Prognostic Scoring Systems were validated based on fluorescence in situ hybridization analyses using extended probe panels applied to cluster of differentiation 34 positive (CD34+) peripheral blood cells of 328 MDS patients of our prospective multicenter German diagnostic study and compared to chromosome banding results of 2902 previously published patients with myelodysplastic syndromes. For cytogenetic risk classification by fluorescence in situ hybridization analyses of CD34+ peripheral blood cells, the groups differed significantly for overall and leukemia-free survival by uni- and multivariate analyses without discrepancies between treated and untreated patients. Including cytogenetic data of fluorescence in situ hybridization analyses of peripheral CD34+ blood cells (instead of bone marrow banding analysis) into the complete International Prognostic Scoring System assessment, the prognostic risk groups separated significantly for overall and leukemia-free survival. Our data show that a reliable stratification to the risk groups of the International Prognostic Scoring Systems is possible from peripheral blood in patients with missing chromosome banding analysis by using a comprehensive probe panel (clinicaltrials.gov identifier:01355913).
Introduction
Myelodysplastic syndromes (MDS) are clonal hematopoietic stem cell diseases characterized by ineffective hematopoiesis and peripheral cytopenias.1,2 Acquired clonal chromosomal anomalies, well known as independent prognostic factors,3–6 are major features within the International Prognostic Scoring System (IPSS)3 and the Revised International Prognostic Scoring System (IPSS-R).7 Additionally, and more recently, the karyotype has gained importance for treatment decisions.5,8
In MDS, conventional chromosome banding analysis (CBA) of bone marrow metaphases still constitutes the gold standard for cytogenetic diagnostics. Karyotyping from peripheral blood is typically unsuccessful due to leukocytopenia and a low percentage of blasts, or impaired growth of affected cells impeding successful culturing and metaphase yield. The main advantage of banding analyses is the examination of the entire chromosome complement to detect numerical as well as structural aberrations. Most chromosomal aberrations in MDS can also be detected by fluorescence in situ hybridization (FISH) analyses, but only pre-defined anomalies can be covered, if a distinct informative probe is used.9
The IPSS/-R is based on chromosome banding analyses in primary untreated MDS patients.3,6,7 If a bone marrow aspiration is impossible or unsuccessful, e.g. because of dry marrow without liquid BM blood, a lack of informative karyotyping because of metaphases failure or the patient’s refusal (5%–20%),10–12 a reliable karyotyping and thus an adequate cytogenetic risk classification, and, finally, assessment of IPSS/-R risk groups are not possible.
In two previous studies,13,14 we had compared the results of FISH analyses of enriched CD34+, unselected peripheral and bone marrow blood with the results of 379 chromosome banding analyses of bone marrow metaphases performed simultaneously in 360 MDS patients (including follow-up data). We were able to demonstrate that FISH analyses of circulating CD34+ progenitor cells from peripheral blood with extended probe panels correlate significantly (P<0.01) with the banding results, and that this method provides valid molecular-cytogenetic information from peripheral blood.14 Furthermore, we were able to show that the enrichment step is indispensable, because otherwise the clone size measured from unselected peripheral blood is too small and too close to the probe’s cut-off value to allow valid analyses, and thus a relevant portion of smaller abnormal clones may be missed.14,15 Hence, CD34+PB FISH is a reliable method for cytogenetic monitoring in untreated and treated, low- and high-risk MDS patients that is not dependent on specific cytogenetic subgroups.14
To answer the question as to whether the IPSS/-R also works with CD34+PB FISH data, we analyzed 328 MDS patients from our prospective multicenter German diagnostic study (clinicaltrials.gov identifier:01355913) by CD34+PB FISH at the time of study entry, and compared the results with chromosome banding analyses of 2902 previously published MDS patients6 of the German-Austrian, Spanish Hematological Cytogenetic Working Group, IMRAW and IWCG databases. This cohort was chosen for correlation because the number of simultaneous CBA and CD34+PB FISH analyses at the time of the CD34+ FISH-study entry was too small to allow valid statistical analyses.
Methods
The design of the CD34+PB FISH diagnostic study (Online Supplementary Figure S1) has already been described in detail.14 For this project, only patients with primary MDS were included and only CD34+PB FISH analyses at the time of study entry were considered. Sequential cytogenetic data were not used. Between October 2008 and December 2012, cytogenetic and clinical data of 328 MDS patients from 18 German Centers of Hematology (Online Supplementary Table S1) of our prospective multicenter German diagnostic study “Screening and genetic monitoring of patients with MDS under different treatment modalities by cytogenetic analyses of circulating CD34+ cells”14 were documented in the web-based central database secuTrial®. The study was conducted in accordance with the modified Declaration of Helsinki, and was approved by the local ethics committees. All patients gave their written informed consent.
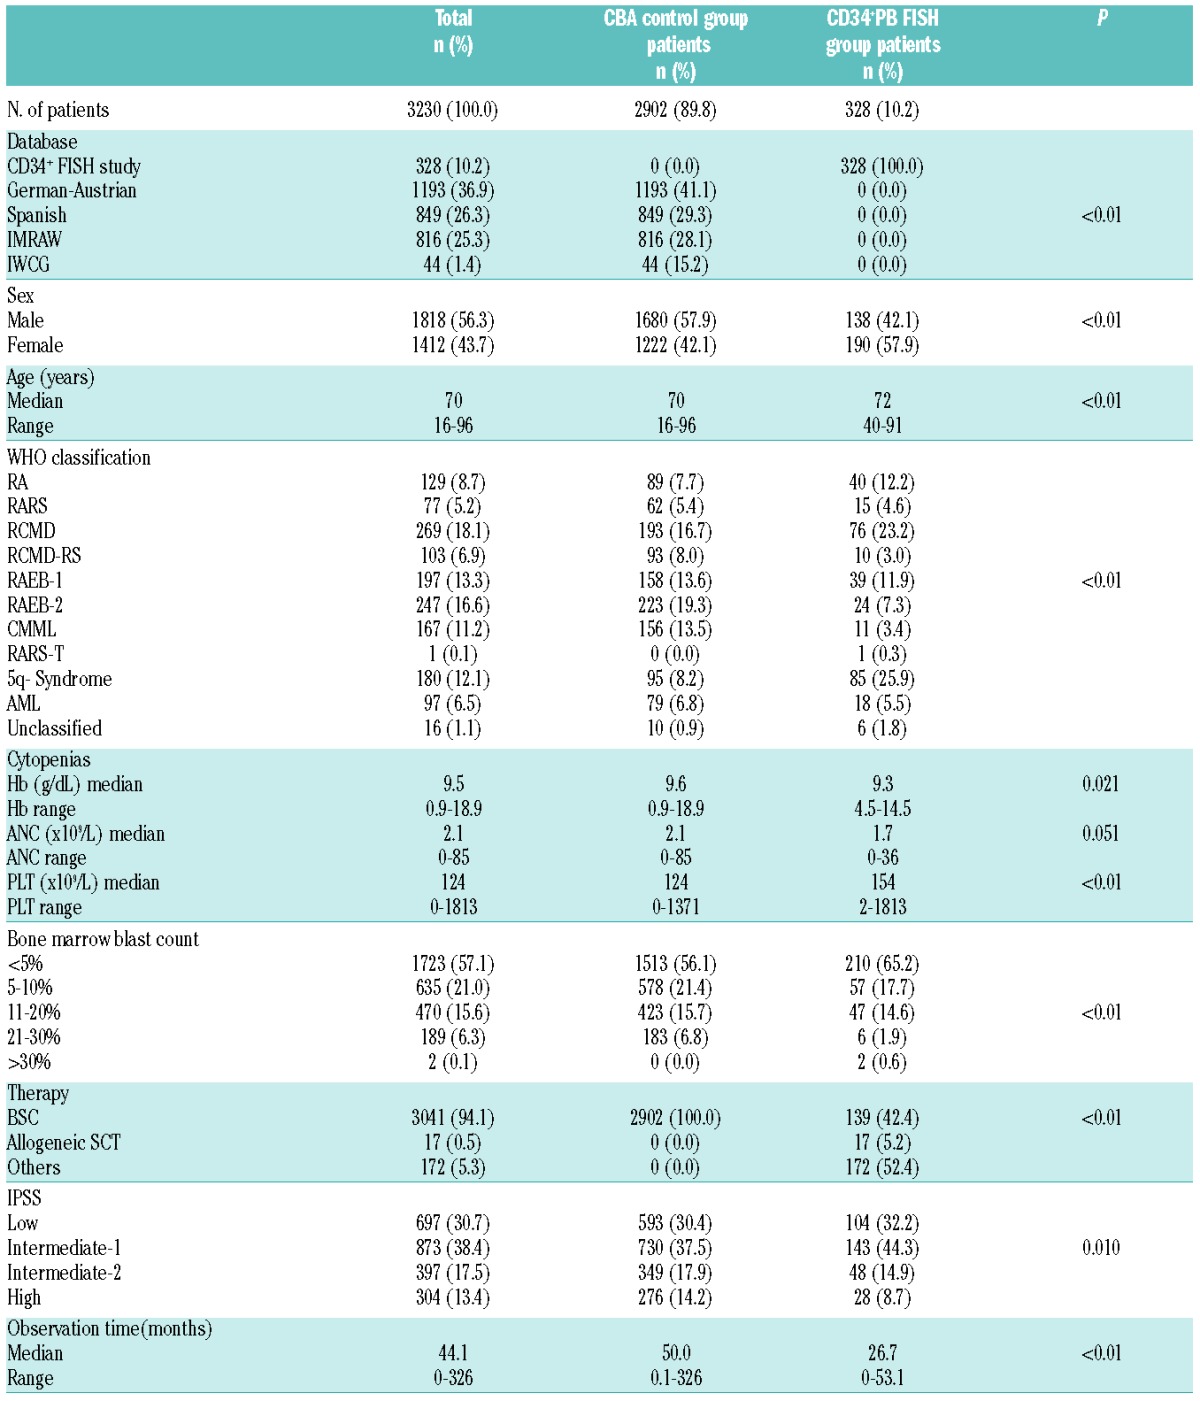
Of these 328 patients, 140 originated from the German LEMON-5 (MDS-LE-MON-5) clinical trial (EudraCT-Nr:2008-001866-10, University of Duesseldorf). For validation of the IPSS/-R assessment, the chromosome banding results of 2902 MDS patients6 of the German-Austrian MDS Study Group (n=1193), the International MDS Risk Analysis Workshop (n=816), the Spanish Haematological Cytogenetics Working Group (n=849), and the International Working Group on MDS Cytogenetics (n=44) databases were analyzed. Results from this study population were published elsewhere,6 but did not focus on the question described here. Patients’ characteristics are shown in Table 1.
Table 1.
Patients’ characteristics (n=3230).
In previous studies,13,14 we had been able to show that CD34+ myeloid progenitor cells can be enriched from peripheral blood by immunomagnetic cell sorting (MACS®, Miltenyi Biotec GmbH, Bergisch Gladbach, Germany) and subsequently used for FISH analyses at acceptable costs, making this strategy generally suitable for routine diagnostic approaches. We could demonstrate that up to 400,000 CD34+ cells can be enriched per sample.13
For this project, FISH analyses of CD34+PB cells were performed in our laboratory, as described previously.13,14
In each patient, the following FISH probe panel was applied at the time of initial screening at study entry: LSI 1p36SO/1q25SG™, LSI CSF1R (5q33–q34)/D5S23,D5S721(5p15.2)™, LSI EGR1(5q31)/D5S23,D5S721(5p15.2)™, LSI D7S522(7q31)/CEP7™, LSI CEP 8 SpectrumOrange™, LSI MLL DualColor™, LSI TEL/AML1 ES™, LSI 13 (RB1)13q14™, LSI IGH/BCL2™, LSI TP53(17p13.1)™, LSI D20S108(20q12)™, and CEP X SpectrumOrange™/Y SpectrumGreen™ (Abbott GmbH & Company, KG, Wiesbaden, Germany) and XL TET2™ (MetaSystems GmbH, Altussheim, Germany).
The entire list of all aberrations possibly detectable with this extended probe panel is available in Online Supplementary Table S2. A summary of the IPSS/-R cytogenetic subgroups and the corresponding FISH probes of this panel is available in Online Supplementary Table S3. Some probes (e.g. IGH/BCL2) are routinely used in lymphoma patients, but they can also be applied to detect aberrations observed in MDS [(e.g. +14, del(18q)]. Using this panel, at least 72% of aberrations (typical for MDS4,6)] can be detected. Cut-off values for each FISH probe were determined in our laboratory according to international consensus.14 A median number of 206 interphase nuclei (range 20–458) was counted per analysis.
Statistical analyses
Statistical analyses were performed using SPSS 20.0 (IBM Cooperation, Armonk, NY, USA) and Graph Pad Prism 4.0 (Graph Pad Software Inc., La Jolla, CA, USA). Time-to-event analyses were performed as described using the Kaplan-Meier method. Differences in time-to-event analyses were calculated using the log rank test. Overall survival (OS) was calculated from the date of first diagnosis to death or last contact; AML-free survival (AFS) from the date of first contact to AML diagnosis. Patients who underwent allogeneic stem cell transplantation (alloSCT, n=17) were censored at the time of transplantation. Multivariate analyses were based on a Cox proportional hazard model. Age, hemoglobin, absolute neutrophil count, and platelet count were calculated as continuous, and sex, bone marrow blast count and treatment as categorical variables. Within the Cox models, the IPSS and IPSS-R cytogenetic and the IPSS prognostic subgroups were analyzed as a numerical scale. Differences between groups were calculated using the χ2 test for categorical and the analysis of variance test for continuous variables. Two-sided P<0.05 was considered significant; P<0.01 as highly significant. Due to the exploratory nature of the study, no adjustment for multiple testing was performed.
Results
For this study, the IPSS-R could only evaluate for cytogenetic, but not for prognostic subgroups evaluated for cytogenetics, because a central retrospective discrimination of the new IPSS-R blast count threshold (<2% or >2–<5% BM blasts) was not possible for all patients. Therefore, prognostic risk groups were evaluated according to IPSS only.
For CD34+ FISH study patients, bone marrow aspiration was recommended, but not performed in every patient. Chromosome banding analyses of bone marrow metaphases at the time of study entry were available for 154 patients (47%) of our CD34+ FISH study. Most of them (82%) were part of the LE-MON-5 trial, and thus belong to cytogenetic good-risk and IPSS low- or int-1 groups. Therefore, an international control group was chosen for an external validation of the dataset. Bone marrow banding analyses of the validation cohort were available for all 2902 patients and centrally reviewed, as described previously.4,6 Karyotypes were documented according to the International System of Human Cytogenetic Nomenclature (ISCN).16 Molecular-cytogenetic results were centrally reviewed.
Bone marrow morphology was performed at each center according to WHO classification.17 IPSS/-R assessment of the banding cohort has been described previously.6 The IPSS/-R score was calculated centrally (FB and JS) for the CD34+PB FISH cohort.
In total, 3230 patients with primary MDS were analyzed for this study. The characteristics of 328 treated and untreated patients analyzed by CD34+PB FISH and of 2902 untreated patients analyzed by chromosome banding analysis of bone marrow metaphases are shown in Table 1. The two groups differed significantly concerning age (70 vs. 72 years), sex, MDS subtype, cytopenias and treatment. The chromosome banding-group was untreated (best supportive care or non-disease altering therapies). The CD34+PB FISH group received the following regimens: 42% received best supportive care (BSC) alone (n=139), 26.8% were treated with lenalidomide alone (n=88), 15% with 5-azacitidine alone (n=49), 1.2% (n=4) with 5-azacitidine plus or followed by one other drug (lenalidomide, etoposide, araC, nilotinib/everolimus, hydroxyurea, eltrombopag), 0.9% (n=3) with 5-azacitidine plus or followed by intensive chemotherapy, 0.9% (n=3) with 5-azacitidine followed by alloSCT, 0.3% (n=1) with 5-azacitidine followed by intensive chemotherapy and alloSCT, 1.2% (n=4) with lenalidomide plus or followed by one other drug (valproic acid, temsirolimus, araC), 0.6% (n=2) with lenalidomide plus or followed by 5-azacitidine, 0.9% (n=3) with lenalidomide followed by alloSCT, 0.3% (n=1) with lenalidomide followed by intensive chemotherapy, 1.3% (n=4) with intensive chemotherapy alone, 0.3% (n=1) with intensive chemotherapy followed by alloSCT, 2.8% (n=9) with alloSCT alone, and 5.2% (n=17) with other treatment modalities (antithymoglobulin/cyclosporine, low-dose araC, low-dose melphalan, nilotinib/everolimus, hydroxycarbamide, hydrodyurea, valproic acid, eltrombopag, panobinostat).
The median observation time was 26.7 months (range 0–53.1) for the FISH group and 50 months for the banding-group (range 0.1–326).
CD34+ peripheral blood FISH versus chromosome banding analysis
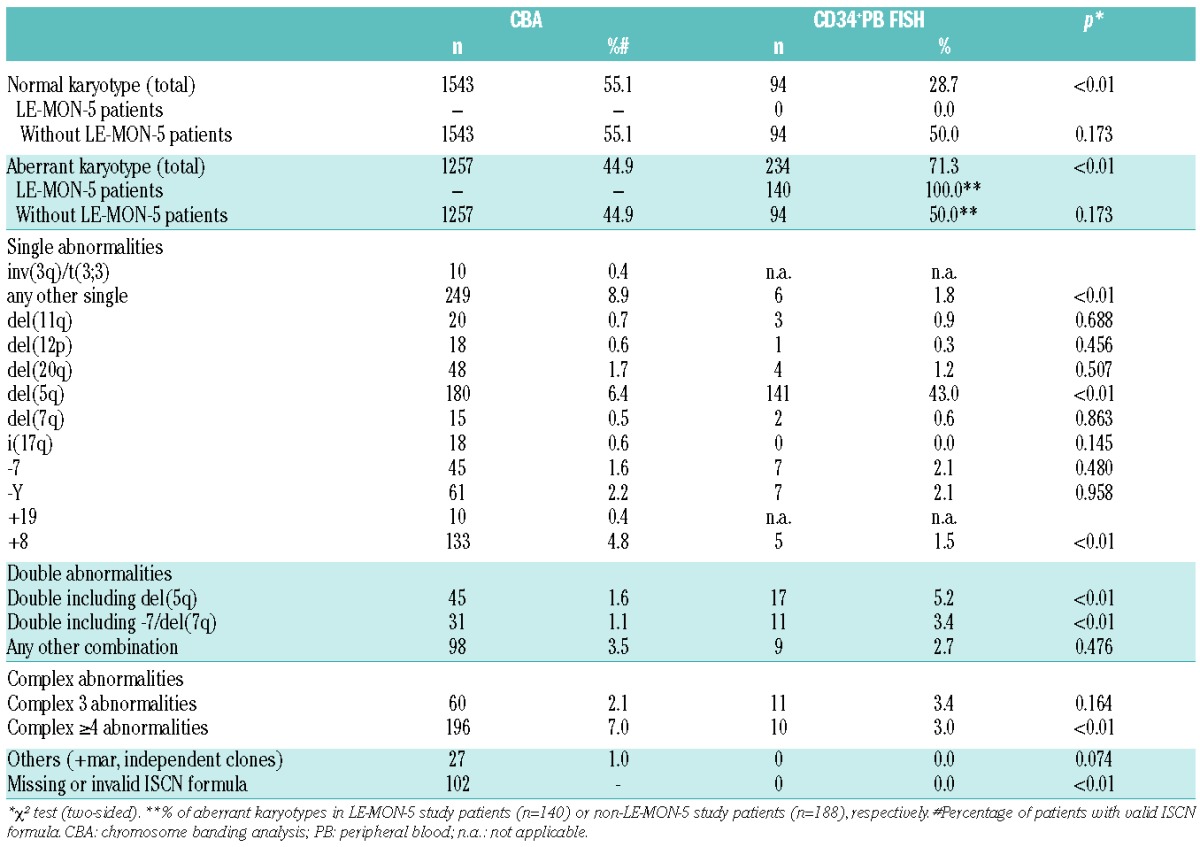
Compared to other published MDS studies1,2,4,6 and to the banding-cohort (44.9%), there was a high incidence (71.3%) of chromosomal aberrations detected in our FISH cohort, due to the bias caused by the inclusion of LE-MON-5-trial-patients, who were required to have a del(5q) to be enrolled in the study. By excluding the 140 LE-MON-5 study patients who showed aberrations in 100% of patients, there was an aberration rate of 50% (n=94) in the CD34+PB FISH cohort that was comparable to the banding-cohort (P=not significant). The distribution of cytogenetic subgroups within the two groups is shown in Table 2. Significant differences were seen for trisomy 8 (CBA: 4.8%, CD34+PB FISH: 1.5%), rare single abnormalities (“any other single”, CBA: 8.9%, CD34+PB FISH: 1.8%), double abnormalities including -7/del(7q) (CBA: 1.1%, CD34+PB FISH: 3.4%) or del(5q) (CBA:1.6%, CD34+PB FISH: 5.2%) and very complex (≥4) abnormalities (CBA: 7.0%, CD34+PB FISH: 3.0%).
Table 2.
Distribution of cytogenetic subgroups.
Treated and untreated patients of the CD34+PB FISH group (Online Supplementary Figure S2) did not differ significantly concerning overall (29.8 vs. 46.5 months, respectively; P=0.378) and AML-free survival (both not reached; P=0.102). There were also no significant imbalances between the chromosome banding group and the CD34+PB FISH group for overall survival (36.0 vs. 32.8 months, respectively; P=0.908; HR: 1.01, range 0.27–1.93) and AML-free survival (203.2 months vs. not reached, respectively; P=0.313; HR: 1.33, range 0.98–1.72) (Online Supplementary Figure S3).
Validation of the IPSS cytogenetic subgroups by CD34+ PB FISH
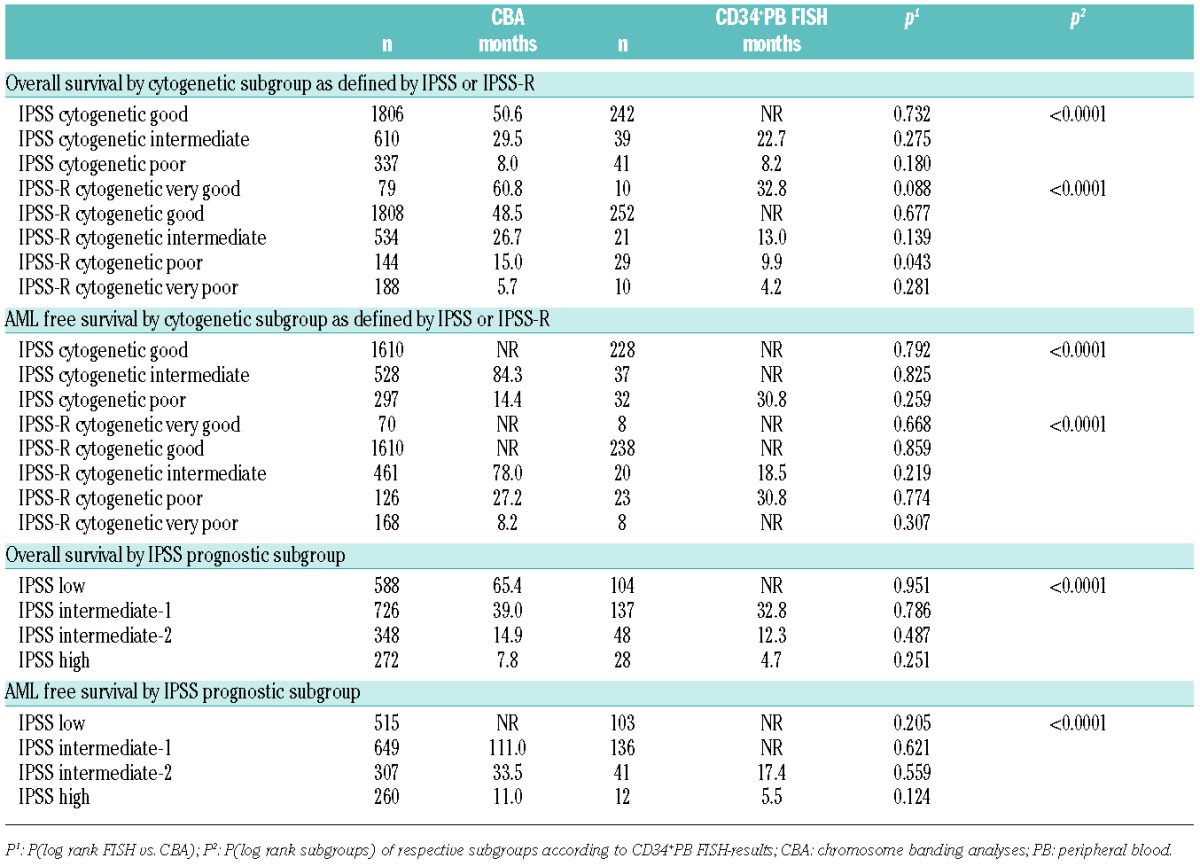
The median overall survival curves for IPSS cytogenetic subgroups separated significantly by CD34+ PB FISH (P<0.01) (Figure 1A): not reached for good-risk, 22.7 months for intermediate-risk and 8.2 months for poor-risk. Compared to the chromosome banding results the overall survival did not differ significantly (Table 3).
Figure 1.
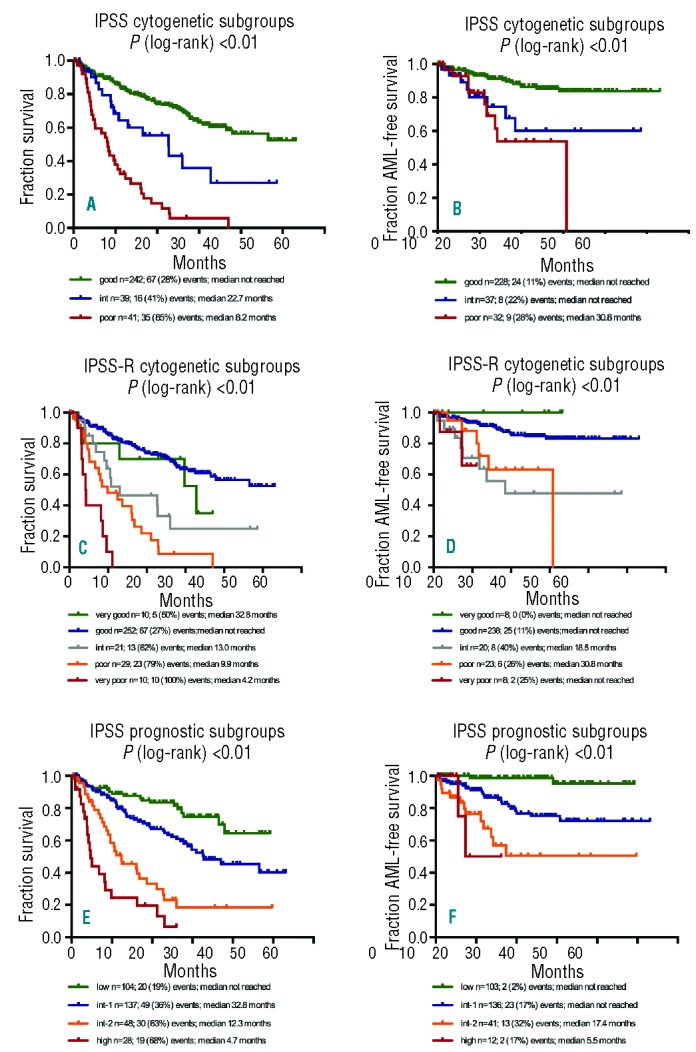
Validation of IPSS- and IPSS-R prognostic classification on CD34+PB FISH. (A) Overall survival for IPSS cytogenetic subgroups (P<0.01). (B) AML-free survival for IPSS cytogenetic subgroups (P<0.01). (C) Overall survival for IPSS-R cytogenetic subgroups (P<0.01). (D) AML-free survival for IPSS-R cytogenetic subgroups (P<0.01). (E) Overall survival for IPSS prognostic subgroups (P<0.01). (F) AML-free survival for IPSS prognostic subgroups (P<0.01).
Table 3.
Overall survival and AML-free survival by IPSS and IPSS-R cytogenetic and IPSS prognostic subgroups.
The AML-free survival curves for IPSS cytogenetic risk groups also differed significantly by CD34+ PB FISH (P<0.01) (Figure 1B): not reached for good- and intermediate-risk, 30.8 months for poor-risk. Compared to banding analyses results there were no significant differences (Table 3).
Validation of the IPSS-R cytogenetic subgroups by CD34+ PB FISH
The median overall survival for the cytogenetic risk groups according to IPPS-R by CD34+PB FISH is shown in Table 3: very good risk 32.8 months, good risk not reached, intermediate risk 13.0 months, poor risk 9.9 months, and very poor risk 4.2 months (P<0.01) (Figure 1C). Compared to chromosome banding results there were no significant differences, except for the poor-risk group. The median overall survival was longer in the chromosome banding group than in the FISH-group (15.0 vs. 9.9 months; P=0.043).
For AML-free survival, all IPSS-R cytogenetic subgroups differed significantly (Figure 1D): not reached for very good, good and very poor risk, 18.5 months for intermediate and 30.8 months for poor risk. Compared to chromosome banding analyses, there were again no significant differences (Table 3). The reason for the shorter AML-free survival of the intermediate risk group remains unclear. There were no significant differences regarding blast count, hemoglobin, ANC or platelet count between the intermediate risk groups defined by banding or by CD34+PB FISH. Thus, we conclude that this is most probably caused by the low number of patients (n=22) in the FISH intermediate group.
Considering the fact that the good risk group contains lenalidomide-treated patients, we re-analyzed this group: 93.5% of patients (n=86) treated with lenalidomide alone had an MDS RA/RARS, RCMD/-RS or RCUD with isolated del(5q), only 6.5% were diagnosed as RAEB-1 (n=5) or RAEB-2 (n=1). None of the lenalidomide-treated patients suffered from AML. In summary, all lenalidomide-treated patients belonged to the low or intermediate-1 risk group (in accordance with the criteria for the drug’s approval). Additional univariate analyses showed that the lenalidomide-treated good-risk patients cause a slight but significant shift towards better overall survival in the good-risk IPSS-R group (32.8 months vs. 38.5 months; P=0.044). There was also a difference in AML-free survival, but this did not reach statistical significance (40.8 months vs. 44.8 months; P=0.05). The IPSS low and intermediate-1 risk groups evaluated by CD34+PB FISH did not differ significantly between lenalidomide treated and untreated patients for OS (33.9 months vs. 38.5 months; P=0.076) and AML-free survival (42.6 months vs. 44.9 months; P=0.92). Moreover, multivariate analyses demonstrated that lenalidomide treatment is not an independent prognostic factor.
Integration of CD34+ PB FISH data into the IPSS
Replacing conventional cytogenetic banding analysis with cytogenetic data from CD34+PB FISH for the complete IPSS allowed separation of prognostic risk groups with highly significant differences in overall survival (not reached for low, 32.8 months for int-1, 12.3 months for int-2, 4.7 months for poor risk) (Table 3 and Figure 1E) and for AML-free survival (not reached for low and int-1, 17.4 months for int-2, 5.5 months for poor risk) (Table 3 and Figure 1F). There were no significant differences between CD34+PB FISH and chromosome banding results (Table 3).
Multivariate analyses
Results from the multivariate analyses are shown in Table 4 and Figure 2. With respect to all known independent risk factors of the IPSS/-R, the Cox models revealed significant differences between the IPSS and IPSS-R cytogenetic risk groups and the IPSS prognostic groups for OS, irrespective of whether they were assessed by banding or by CD34+PB FISH analyses. For AML-free survival, the differences between the IPSS/-R cytogenetic subgroups and the IPSS prognostic subgroups based on CD34+PB FISH were not significant, presumably because the number of patients was too small in these groups (Table 4). However, the data clearly demonstrate that the attribution to a certain cytogenetic risk group is possible by chromosome banding as well as by CD34+PB FISH analysis, and that there were no significant discrepancies between treated and untreated patients.
Table 4.
Results from multivariate analysis for overall survival and AML-free survival: IPSS- and IPSS-R cytogenetic subgroups and IPSS prognostic subgroups in CD34+ PB FISH versus CBA.
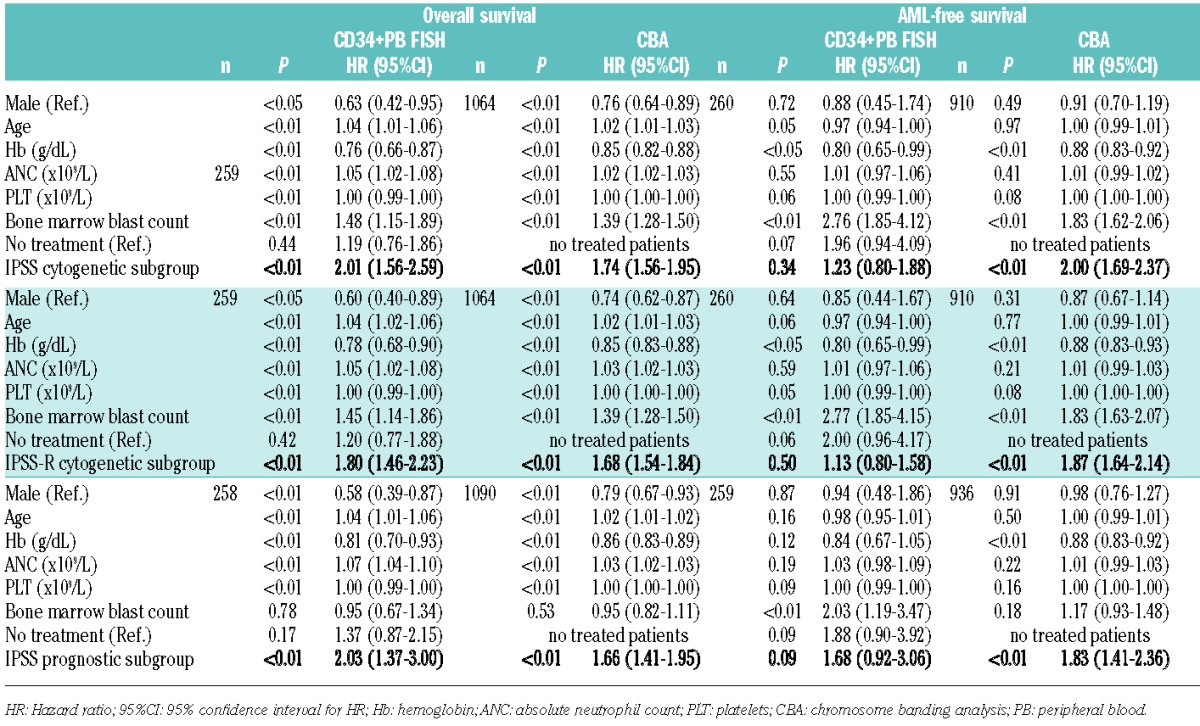
Figure 2.

(A and B) Results from multivariate analyses: IPSS- and IPSS-R cytogenetic subgroups and IPSS prognostic subgroups in CD34+PB FISH versus CBA. IPSS.CY: IPSS cytogenetic subgroups; IPSS-R.CY: IPSS-R cytogenetic subgroups; IPSS: complete IPSS prognostic subgroups.
Discussion
Bone marrow cytomorphology and histopathology are necessary to determine blast counts for both initial diagnosis of MDS and follow up, and bone marrow chromosome banding analyses remain the gold standard of cytogenetics in MDS patients, indispensable for an adequate patient care. The aim of this study was not to replace conventional bone marrow chromosome banding analyses by FISH, but rather we aimed to determine whether cytogenetic analysis of peripheral CD34+ cells by FISH with extended probe panels may allow a valid IPSS/-R risk classification and thus provide important prognostic information in those cases where chromosome banding of bone marrow metaphases is not possible and thus, cytogenetic information is missing.
In the current study, we compared FISH analyses of enriched circulating CD34+ peripheral blood cells of 328 MDS patients with the bone marrow chromosome banding results of 2902 previously published MDS patients. Since banding analyses were available for only 47% of CD34+PB FISH patients at the time of evaluation, we used this well characterized external control group for validation of our results. The design of the cytogenetic module of the IPSS/-R is based on chromosome banding analysis of bone marrow metaphases of primary untreated newly diagnosed MDS patients only,3,7 but several groups have already demonstrated the successful application of the IPSS and IPSS-R in treated and in secondary therapy-related MDS patients.18–22 Here, we were able to show that, in our cohort, there was no significant difference in OS and AML-free survival between treated and untreated patients. OS and AML-free survival were shorter in treated patients, reflecting the fact that the treated group contained more patients with poor prognosis that needed specific treatment regimens.
The CD34+PB FISH group contained more women and more patients with low-risk MDS (RS/-RS, RCMD/-RS, isolated del(5q)) than the banding group, mainly because of the inclusion of the LE-MON-5-study patients. Although the two groups (FISH vs. banding) differed significantly concerning age, sex, MDS subtype, cytopenias and treatment, the IPSS/-R allowed a valid discrimination of the different cytogenetic risk groups. The prognostic risk groups according to the IPSS separated significantly as well.
The absolute median survival of each cytogenetic risk group defined by banding analysis versus CD34+PB FISH differed because the validation cohort contained only MDS patients at the time of initial diagnosis, while the FISH group contained MDS patients at different time points of the disease, and evaluation time was study entry instead of initial diagnosis. Nevertheless, OS and AML-free survival curves separated significantly for IPSS/-R cytogenetic risk groups and IPSS prognostic risk groups defined by CD34+PB FISH without any significant deviations compared to the chromosome banding results.
Multivariate analyses for both IPSS/-R cytogenetic risk groups and IPSS prognostic subgroups showed that neither the diagnostic tool (banding vs. CD34+PB FISH) nor the treatment (best supportive care vs. any other) significantly influenced the predictive power of the scoring systems.
Rare abnormalities occur in up to 9% of MDS patients.4,6 Obviously, there was an advantage for chromosome banding analysis in identifying those rare aberrations because informative FISH probes were not applicable. Adding additional FISH probes for rare aberrations not yet detectable (e.g. der(3q), +19) will help to improve the sensitivity of the method.
FISH is able to detect even small submicroscopic deletions and small clones.23 This might be one reason for the discrepancies in detecting double and complex aberrations: double aberrations including del(5q) or del(7q)/-7 were more often detected by CD34+PB FISH than by banding analysis (P<0.01), whereas complex aberrant karyotypes with 4 or more aberrations were diagnosed more often by chromosome banding than by CD34+PB FISH analysis (7.0% vs. 3.0%; P<0.01). This was reflected by the overall survival curves according to IPSS-R cytogenetic risk groups. The IPSS-R poor-risk group showed a shorter overall survival than the poor-risk group defined by chromosome banding analysis (P=0.043). FISH in general is likely to miss very complex aberrant karyotypes with complex translocations and very rare abnormalities compared to banding analyses, even if an extended probe panel, as in our study, is examined. So our CD34+PB FISH poor-risk-group might include patients with 3 anomalies detectable by FISH, but maybe more than 3 aberrations by banding analysis, and, therefore, with an even poorer prognosis and a shorter OS. Regarding double (=2) abnormalities, the validity of CD34+PB FISH to detect these aberrations is limited for several reasons. The method cannot clearly separate between double abnormalities and unrelated clones because it is not possible to identify whether two abnormalities are found in the same or two different cells without performing additional multi-color hybridizations. As discussed above, in some clones classified as harboring ‘double abnormalities’, there may be some additional abnormalities not detectable by the FISH probe panel used. Thus, some cases identified as having ‘double’ abnormalities by CD34+PB FISH may actually have complex karyotypes.
Chromosome banding analysis provides an overview of the whole chromosome complement and allows a more comprehensive identification of the number of chromosomal anomalies, whereas FISH can only detect certain predefined aberrations.15,24–26 Former studies have already demonstrated that additional FISH analyses of bone marrow blood offer less or no further information if a sufficient banding analysis of at least 20 bone marrow metaphases is available, and that FISH provides only valuable additional impact, if a chromosome banding analysis is missing.10,11,15,24–26 In patients with a normal karyotype by chromosome banding, additional bone marrow FISH analyses seem to be useful to detect small clones or small deletions.11,12 Without doubt, FISH cannot, and should not, replace chromosome banding analysis in general. However, our results provide proof that a valid cytogenetic risk classification according to IPSS/-R, and thus a prognostic profiling, is possible using FISH analyses of CD34+ peripheral blood cells with extended probe panels. This method can be a very helpful tool for those patients with insufficient or missing banding analysis at initial diagnosis, and allows prediction of their individual risk according to international prognostic scoring systems.
Acknowledgments
The authors would like to thank Gesine Bug and Oliver Ottmann (University of Frankfurt, Germany), Michael Stadler (Medizinische Hochschule Hannover, Germany), Philippe Schafhausen (University of Hamburg, Germany), Richard F. Schlenk (University of Ulm, Germany), Igor W. Blau (Charite University of Berlin, Germany), Michael Metz (Gemeinschaftspraxis Göttingen, Germany), Sven Detken and Jörg Seraphin (Gemeinschaftspraxis Northeim, Germany), Kathleen Jentsch-Ullrich (Gemeinschaftspraxis Magdeburg, Germany), Angelika Böhme (Onkologikum Frankfurt am Museumsufer, Frankfurt am Main, Germany), Burkhard Schmidt (Gemeinschaftspraxis Munich, Germany) and Friedrich Wimazal (University of Vienna) for including patients, Heidrun Fascher for organisational assistance and Sebastian Pfeiffer (Institut für anwendungsorientierte Forschung und klinische Studien (IFS), University of Goettingen, Germany) for database care.
Footnotes
The online version of this article has a Supplementary Appendix.
Authorship and Disclosures
Information on authorship, contributions, and financial & other disclosures was provided by the authors and is available with the online version of this article at www.haematologica.org.
References
- 1.Silverman LR. Neoplasms of the hematopoietic system: myelodysplastic Syndrome, In: Holland J, Frei EI, Bast RJ, eds. Cancer Medicine. Hamilton, Canada, BC Decker; 2000:1931–1946. [Google Scholar]
- 2.Fenaux P. Myelodysplastic syndromes: from pathogenesis and prognosis to treatment. Semin Hematol. 2004;41:6–12. [DOI] [PubMed] [Google Scholar]
- 3.Greenberg P, Cox C, LeBeau MM, et al. International scoring system for evaluating prognosis in myelodysplstic syndromes. Blood. 1997;89:2079–2088. [PubMed] [Google Scholar]
- 4.Haase D, Germing U, Schanz J, et al. New insights into prognostic impact of the karyotype in MDS and correlation with subtypes: evidence from a core dataset of 2124 patients. Blood. 2007;110:4385–4395. [DOI] [PubMed] [Google Scholar]
- 5.List A, Kurtin S, Roe DJ, et al. Efficacy of lenalidomide in myelodysplastic syndromes. N Engl J Med. 2005;352:549–557. [DOI] [PubMed] [Google Scholar]
- 6.Schanz J, Tüchler H, Solé F, Mallo M, et al. New comprehensive cytogenetic scoring system for primary myelodysplastic syndromes (MDS) and oligoblastic acute myeloid leukemia after MDS derived from an international database merge. J Clin Oncol. 2012;30(8):820–829. [DOI] [PMC free article] [PubMed] [Google Scholar]
- 7.Greenberg PL, Tuechler H, Schanz J, et al. Revised international prognostic scoring system for myelodysplastic syndromes. Blood. 2012;120(12):2454–2465. [DOI] [PMC free article] [PubMed] [Google Scholar]
- 8.Fenaux P, Mufti GJ, Hellstrom-Lindberg E, et al. Efficacy of azacitidine compared with that of conventional care regimens in the treatment of higher-risk myelodysplastic syndromes: a randomised, open-label, phase III study. Lancet Oncol. 2009;10(3): 223–232. [DOI] [PMC free article] [PubMed] [Google Scholar]
- 9.Rigolin GM, Bigoni R, Milani R, et al. Clinical imprtance of interphase cytogenetics detecting occult chromosome lesions in myelodysplastic syndromes with normal karyotype. Leukemia. 2001;15:1841–57. [DOI] [PubMed] [Google Scholar]
- 10.Romeo M, Chauffaille Mde L, Silva MR, Bahia DM, Kerbauy J. Comparison of cytogenetics with FISH in 40 myelodysplastic syndrome patients. Leuk Res. 2002;26:993–996. [DOI] [PubMed] [Google Scholar]
- 11.Yang W, Stotler B, Sevilla DW, et al. FISH analysis in addition to G-band karyotyping: utility in evaluation of myelodysplastic syndromes? Leuk Res. 2010;34:420–425. [DOI] [PubMed] [Google Scholar]
- 12.Valent P, Horny H-P, Bennett JM, et al. Definitions and standards in the diagnosis and treatment of the myelodysplastic syndromes: Consensus statements and report from working conference. Leuk Res. 2007; 31:727–736. [DOI] [PubMed] [Google Scholar]
- 13.Braulke F, Schanz J, Jung K, et al. FISH Analysis of Circulating CD34+ Cells as a New Tool for Genetic Monitoring in MDS: Verification of the Method and Application to 27 MDS Patients. Leuk Res. 2010; 34:1296–1301. [DOI] [PubMed] [Google Scholar]
- 14.Braulke F, Jung K, Schanz J, et al. Molecular cytogenetic monitoring from CD34+ peripheral blood cells in myelodysplastic syndromes: First results from a prospective multicenter German diagnostic study. Leuk Res. 2013;37:900–906. [DOI] [PubMed] [Google Scholar]
- 15.Cherry AM, Slovak ML, Campbell LJ, et al. Will a peripheral blod (PB) sample yield the same diagnostic and prognostic cytogenetic data as the concomitant bone marrow (BM) in myelodysplasia? Leuk Res. 2012; 36:832–840. [DOI] [PubMed] [Google Scholar]
- 16.Shaffer LG, McGowan-Jordan J, Schmid M. (eds): An international system for human cytogenetic nomenclature. Recommendations of the International Standing Committee on Human Cytogenetic Nomenclature. S. Karger A.G: Basel, 2013. [Google Scholar]
- 17.Harris NL, Jaffe ES, Diebold J, et al. The World Health Organization classification of neoplasms of the hematopoietic and lymphoid tissues: report of the Clinical Advisory Committee meeting–Airlie House, Virginia, November, 1997. Hematol J. 2000;1(1):53–66. [DOI] [PubMed] [Google Scholar]
- 18.Mishra A, Corrales-Yepez M, Ali NA, et al. Validation of the revised international prognostic scoring system in treated patients with myelodysplastic syndromes. Am J Hematol. 2013,88(7):566–570. [DOI] [PMC free article] [PubMed] [Google Scholar]
- 19.Sekeres M, Ades L, Tuechler H, et al. Revised International Prognostic Scoring System (IPSS-R) for primary treated myelodysplastic syndromes (MDS) patients: A report from the IWG-PM. Leuk Res. 2013;37:113 (abstract 113). [Google Scholar]
- 20.Breccia M, Salaroli A, Loglisci G, Alimena G. Revised IPSS (IPSS-R) stratification and outcome of MDS patients treated with azacitidine. Ann Hematol. 2013;92(3):411–412. [DOI] [PubMed] [Google Scholar]
- 21.Schanz J, Steidl C, Fonatsch C, et al. Coalesced Multicentric Analysis of 2351 Patients with Myelodysplastic Syndromes Indicates an Underestimation of Poor-Risk Cytogenetics of Myelodysplastic Syndromes in the International Prognostic Scoring System. J Clin Oncol. 2011; 29:1963–1970. [DOI] [PMC free article] [PubMed] [Google Scholar]
- 22.Neukirchen J, Lauseker M, Blum S, et al. Validation of the revised international prognostic scoring system (IPSS-R) in patients with myelodysplastic syndrome: a multi-centre study. Leuk Res. 2014;38:57–64. [DOI] [PubMed] [Google Scholar]
- 23.Coleman JF, Theil KS, Tubbs RR, Cook JR. Diagnostic yield of bone marrow and peripheral blood FISH panel testing in clinically suspected myelodysplastic syndromes and/or acute myeloid leukemia: a prospective analysis of 433 cases. Am J Clin Pathol. 2011;135(6):915–920. [DOI] [PubMed] [Google Scholar]
- 24.Costa D, Valera S, Carrió A, et al. Do we need to do fluorescence in situ hybridization analysis in myelodysplastic syndromes as often as we do? Leuk Res. 2010;34:1437–1441. [DOI] [PubMed] [Google Scholar]
- 25.Jiang H, Xue Y, Wand Q, et al. The utility of fluorescence in situ hybridization analysis in diagnosing myelodysplastic syndromes is limited to cases with karyotype failure. Leuk Res. 2012;36:448–452. [DOI] [PubMed] [Google Scholar]
- 26.Pinheiro RF, Chauffaille MLLF. Comparison of I-FISH and G-banding for the detection of chromosomal abnormalities during the evolution of myelodysplastic syndrome. [DOI] [PubMed]


