

Abstract
Context:
In honor of the 75th issue of the Journal of Clinical Endocrinology and Metabolism, the author was invited to present his perspectives on genetics in human endocrinology. This paper reviews what the field has achieved in the genetics of common endocrine disease, and offers predictions on where the field will move in the future and its impact on endocrine clinical practice.
Evidence Acquisition:
The October 2015 data release of the National Human Genome Research Institute-European Bioinformatics Institute (NHGRI-EBI) Catalog of Published Genome-wide Association Studies was queried regarding endocrinologic diseases and traits. PubMed searches were focused on genetic prediction of disease, genetic findings and drug targets, functional interrogation of genetic loci, use of genetics to subtype disease, missing heritability, systems genomics, and higher order chromatin structures as regulators of gene function.
Evidence Synthesis:
Nearly a quarter of genome wide association study findings concern endocrinologic diseases and traits. While these findings have not yet dramatically altered clinical care, genetics will have a major impact by providing the drug targets of tomorrow, facilitated by experimental and bioinformatic advances that will shorten the time from gene discovery to drug development. Use of genetic findings to subtype common endocrine disease will allow more precise prevention and treatment efforts. Future advances will allow us to move away from the common view of DNA as a string of letters, allowing exploration of higher order structure that likely explains much “missing heritability.”
Conclusions:
The future will see a greater role of genetics at the bedside, with genetic epidemiologic discoveries leading not only to new treatments of endocrine disease, but also helping us prescribe the right drug to the right patients by allowing subclassification of common heterogeneous endocrine conditions. Future technological breakthroughs will reveal the heritable mysteries hidden in chromatin structure, leading to a more complete characterization of heritability that will propel our ability to translate genetic findings into new preventions and treatments.
Genome-wide association studies (GWAS) have been extremely productive in endocrine traits and diseases. The October 2015 data release of the National Human Genome Research Institute-European Bioinformatics Institute (NHGRI-EBI) Catalog of Published Genome-wide Association Studies lists 2293 studies reporting 16 831 single nucleotide polymorphism (SNP) associations with numerous traits (1). I visited the web site October 5, 2015, and downloaded the data for all traits related to endocrinology, including some traits we share with other disciplines (eg, osteoporosis, blood pressure, lipids), resulting in a dataset listing approximately 4000 SNP associations from 385 publications (Supplemental Table 1). Table 1 lists a selection of these results; whereas some genes have clear relevance to phenotype (eg, GC, which codes for vitamin D binding protein and 25-hydroxyvitamin D levels), most represent novel discoveries. Considering that one in six GWAS and nearly 25% of the results are endocrine-related, we are well represented.
Table 1.
A Selection of Endocrine Traits and Diseases From the NHGRI Catalog of Published Genome-Wide Association Studies
| Trait and Diseases | No. of Publications | No. of Associationsa | Top Locus by Effect Sizeb | Recognizable Nearby Genesc |
|---|---|---|---|---|
| 25-Hydroxyvitamin D levels | 6 | 12 | GC | CYP2R1, DHCR7, GC |
| Adiponectin | 13 | 34 | ADIPOQ | ADIPOQ, VEGFA |
| Calcium levels | 3 | 10 | CASR | CASR |
| Dehydroepiandrosterone sulfate levels | 1 | 8 | ZKSCAN5 | SULT2A1 |
| Estradiol levels | 5 | 4 | TSPYL5 | CYP19A1, SHBG |
| FSH | 2 | 2 | CYP19A1 | CYP19A1 |
| Graves' disease | 4 | 22 | HLA-B | ABO, HLA-B, CTLA4, MHC, TG, TSHR |
| Hypothyroidism | 2 | 6 | PHTF1 | HLA-C/HLA-B |
| Menopause (age of onset) | 9 | 29 | MCM8 | |
| PCOS | 3 | 16 | DENND1A | LHCGR, FSHR, INSR |
| Testosterone levels | 4 | 6 | SHBG | SHBG |
| Thyroid cancer | 4 | 8 | MBIP | |
| Thyroid peroxidase antibody levels or positivity | 5 | 7 | TPO (positivity), MAGI3 (levels) | TPO |
| TSH levels | 8 | 43 | PDE8B | DIO1 |
| T1D | 10 | 66 | HLA-DRB1 | CTLA4, HLA-DRB1, INS, IL10, IL2RA, MHC |
| T2D | 48 | 188 | TCF7L2 | HNF1A, HNF4A, HNF1B, IDE, INS-IGF2, IGF2BP2, IRS1, KCNJ11, MC4R, PPARG, WFS1 |
Total number of associations significant at P < 5 × 10⁻⁸. The number of independent associations will be lower after considering linkage disequilibrium.
Top locus determined by examining odds ratio or beta-coefficient, as listed in the database. Note that some entries do not have a listed effect size.
Gene names that an endocrinologist might recognize based on potential relevance to the associated trait. This subjective list reflects the author's opinion. The number of recognizable genes is generally a small proportion of the total associations. Gene names are assigned by proximity to each associated SNP. GC, group-specific component (vitamin D binding protein); CYP2R1, cytochrome P450, family 2, subfamily R, polypeptide 1 (vitamin D 25-hydroxylase); DHCR7, 7-dehydrocholesterol reductase; ADIPOQ, adiponectin; VEGFA, vascular endothelial growth factor A; CASR, calcium-sensing receptor; ZKSCAN5, zinc finger with KRAB and SCAN domains 5; SULT2A1, sulfotransferase family, cytosolic, 2A, dehydroepiandrosterone (DHEA)-preferring, member 1; TSPYL5, TSPY-like 5; CYP19A1, cytochrome P450, family 19, subfamily A, polypeptide 1 (aromatase); SHBG, sex hormone-binding globulin; HLA-B, major histocompatibility complex, class I, B; ABO, ABO blood group; CTLA4, cytotoxic T-lymphocyte-associated protein 4; MHC, major histocompatibility complex; TG, thyroglobulin; TSHR, thyroid hormone stimulating receptor; PHTF1, putative homeodomain transcription factor 1; HLA-C, major histocompatibility complex, class I, C; MCM8, minichromosome maintenance 8 homologous recombination repair factor; DENND1A, DENN/MADD domain containing 1A; LHCGR, luteinizing hormone/choriogonadotropin receptor; FSHR, follicle stimulating hormone receptor; INSR, insulin receptor; MBIP, MAP3K12 binding inhibitory protein 1; TPO, thyroid peroxidase; MAGI3, membrane associated guanylate kinase, WW and PDZ domain containing 3; PDE8B, phosphodiesterase 8B; DIO1, deiodinase, iodothyronine, type I; HLA-DRB1, major histocompatibility complex, class II, DR beta 1; INS, insulin; IL10, interleukin 10; IL2RA, interleukin 2 receptor, α TCF7L2, transcription factor 7-like 2; HNF1A, HNF1 homeobox A; HNF4A, hepatocyte nuclear factor 4, alpha; HNF1B, HNF1 homeobox B; IDE, insulin degrading enzyme; IGF2, insulin-like growth factor 2; IGF2BP2, insulin-like growth factor 2 mRNA binding protein 2; IRS1, insulin receptor substrate 1; KCNJ11, potassium channel, inwardly rectifying subfamily J, member 11; MC4R, melanocortin 4 receptor; PPARG, peroxisome proliferator-activated receptor γ; WFS1, Wolfram syndrome 1 (wolframin).
Despite yielding much new knowledge in endocrinology and other fields, for the most part, GWAS findings have not yet transformed clinical care. Early hopes that SNPs could be used in disease prediction met with disappointment, with little incremental predictive information from genes when added to traditional risk factors. For example, in type 2 diabetes (T2D), genetic information from 18 GWAS loci minimally improved disease prediction over clinical risk factors such as age, body mass index, and sex (2–4). Although a meaningful improvement in prediction has been seen when a greater number of variants (eg, 65 in T2D) are considered (5), it will be some time before widespread implementation of clinical genotyping occurs. Whole exome and whole genome sequencing have mainly been used clinically to aid in the management of individual patients with challenging clinical findings, at times with dramatic success (6). At the present time, the main benefit of GWAS has been illumination of new biology underlying various phenotypes and diseases. This leads to the question: Where will this knowledge take us? In the following paragraphs, I offer my musings on this question, discussing where we are today and my guesses on what the future will hold. I focus on two of the most common endocrine conditions: diabetes (affecting 9% of the US population), and polycystic ovary syndrome (PCOS; affecting ∼10% of reproductive-age women).
Susceptibility Genes: the Drug Targets of Tomorrow
GWAS (and other large-scale genetic epidemiological studies) will provide a basis for future development of drugs to treat endocrine conditions. A subset of the susceptibility genes identified by GWAS will serve as tomorrow's drug targets. The example of T2D illustrates this point. GWAS have identified approximately 90 loci for T2D, 40 loci for fasting glucose, and 20 loci for fasting insulin (7). Two loci identified in these studies, PPARG (peroxisome proliferator-activated receptor γ) and ABCC8/KCNJ11 (ATP-binding cassette, subfamily C [CFTR/MRP], member 8 and potassium channel, inwardly rectifying subfamily J, member 11), code for the targets of thiazolidinediones and sulfonylureas, respectively. Subsequently, a large-scale study focusing on exomic variants identified a missense variant in GLP1R (glucagon-like peptide 1 receptor) associated with fasting glucose and T2D (8). This receptor is the target for GLP-1 analogs (eg, exenatide, liraglutide, dulaglutide, albiglutide). Thus, for T2D, we have three examples where the drug preceded discovery (by large-scale genetic association studies) of the gene coding for the drug's molecular target (Figure 1A). This represents 25% (three of 12) of the existing Food and Drug Administration-approved antidiabetic drug classes (insulins, sulfonylureas, biguanide, thiazolidinediones, α-glucosidase inhibitors, meglitinides, GLP-1 analogs, dipeptidyl peptidase IV inhibitors, amylin analog, sodium glucose cotransporter 2 inhibitors, quick release bromocriptine, and colesevelam). One can imagine a world wherein these drugs were not yet developed; genetic identification of their molecular targets could have been the first step in the development of these very effective agents. Furthermore, pathway analysis of 102 genes targeted by modern antidiabetic agents revealed enrichment for T2D GWAS loci (9). As stated above, today we have approximately 150 loci for T2D and related quantitative traits. This represents a rich resource harboring potential drug targets (Figure 1B). If targets of three of today's antidiabetic drug classes are found among the 150 loci, it is likely that several of the remaining loci will eventually serve as the drug targets of tomorrow.
Figure 1.
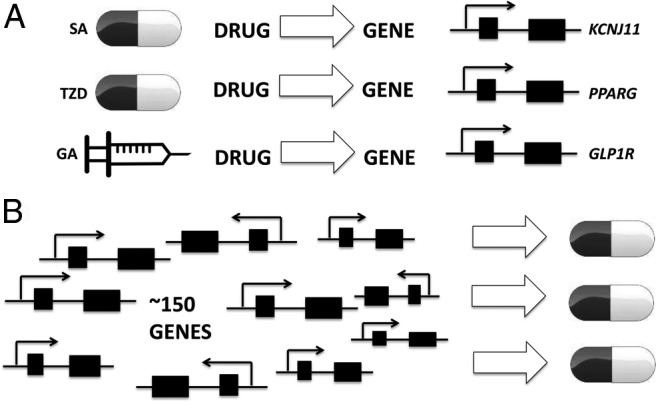
A, Today we have three examples where development of antidiabetic drugs (sulfonylureas [SA], thiazolidinediones [TZD], and GLP-1 agonists [GA]) preceded identification (by large-scale genetic association studies) of genes that code for their direct molecular targets (KCNJ11, PPARG, GLP1R). B, The approximately 150 genes (and more yet to be discovered) for T2D, fasting glucose, and fasting insulin will serve as a rich source for future antidiabetic drug development.
It is important to keep in mind the timeline between gene discovery and the arrival of the corresponding new drug on pharmacy shelves. Figure 2 displays the effect of GWAS on this timeline; the time to gene discovery (time period a) has been greatly shortened. However, the many years subsequently needed for functional characterization of the susceptibility region (period b) and drug development (period c) are not affected by the pace of gene discovery. If anything, by providing so many loci, GWAS may initially have prolonged the time needed for functional experimentation. As an example, FTO (fat mass and obesity associated) was identified as a locus for obesity and T2D in 2007 (10, 11). It was not until 2015 that the function of variation in the FTO locus on adipocytes in humans was described. This was achieved in a comprehensive series of experiments that pinpointed the causal variant rs1421085 (out of ∼90 that have been associated with body mass index); the C allele disrupts binding of the ARID5B repressor, leading to increased expression of IRX3 and IRX5, resulting in fewer energy-burning beige adipocytes and more energy-storing white adipocytes (12). Of note, this variant residing in intron 1 of the FTO gene exerts its effects on IRX3 and IRX5 over 500 kilobases away (13). This work has suggested that a future treatment of obesity may target the ARID5B-FTO-IRX3/IRX5 pathway to shift white adipocytes to beige. The drug development process focusing on this will take another several years (period c in Figure 2). An example where genetic variation presaged drug development is found in PCSK9. In 2006, loss-of-function mutations in PCSK9 were found to confer less low-density lipoprotein (LDL) cholesterol and protection against coronary heart disease (14). Nine years later, the FDA has approved two monoclonal antibodies (alirocumab and evolocumab) that inhibit PCSK9, which results in increased LDL receptor density on hepatocytes, improved LDL cholesterol clearance, and approximately 50% reduction in LDL cholesterol levels (15). GLP1R (drug then gene) and PCSK9 (gene then drug) are examples where the genetic variants are rare or uncommon coding variants. Thus, whole exome and whole genome sequencing efforts currently under way are likely to identify new drug targets.
Figure 2.

Timelines from gene discovery to drug development. The process is simplified as three time periods: time to gene discovery (period a), functional characterization (period b), and drug development (period c). Functional characterization can be divided into two stages, bioinformatic prioritization of targets and experimental interrogation of targets. The three periods are not drawn to scale relative to each other.
Some have questioned the value of the investment in the Human Genome Project and large-scale genetic association studies because they have not substantially transformed clinical care; this reflects a failure to appreciate the timelines involved. In the coming years, we will see the genetic discoveries bearing fruit in terms of new drugs. Robust identification of a SNP association with disease is the first step in this process. The SNP/locus is often named after the nearest gene, which is widely recognized as convenient labeling rather than functional information. Although expedient, this practice can be misleading and can lead to misplaced resources; consider the experimental efforts (eg, overexpression, knockdown, knockout mice) expended on the FTO gene before IRX3 and IRX5 were found to be the genes affected by the FTO SNP (16). For a GWAS finding ever to impact drug development, the next step is functional characterization, identifying the causal SNP in the locus, the gene(s) that are affected by this SNP, and how they are affected. Only with this knowledge can drugs be developed based on the genetic finding, so that the correct gene is targeted. I have depicted the time for functional assessment progressively decreasing in the future (Figure 2). This will occur given bioinformatic and experimental advances. There has been a recent explosion in the number of databases and algorithms for functional annotation of noncoding variation (17), which make up most GWAS-identified SNPs, with ENCODE and NIH ROADMAP Epigenomics projects leading the way in identifying regulatory elements via chromatin accessibility (DNase I hypersensitivity), protein (eg, transcription factor) binding, and histone modifications (the latter two via chromatin immunoprecipitation sequencing, ChIP-seq) (18, 19). These databases facilitate identification of which of the many SNPs in linkage disequilibrium with the GWAS SNP should be examined in the laboratory, a very necessary prioritization given the time and expense involved. The time involved in the bioinformatics prioritization component of functional characterization is already shrinking with the development of algorithms to rapidly annotate long lists of GWAS SNPs using existing epigenetic and transcriptomic data (20); usually, however, the laboratory component still focuses on a handful of targets (21–23). New methods such as genome editing (eg, CRISPR-Cas9) facilitate success of the laboratory efforts (12). The ongoing development of high-throughput experimental methods (24) will further accelerate the time needed for functional assessment (Figure 2), which was 8 years for the FTO locus.
Some have questioned whether GWAS discoveries may lead to new drugs, focusing on the fact that the effect sizes of common susceptibility variants tend to be small, and thus inferring that these would be weak drug targets. This erroneously equates the effect of a common genetic variant with the effect of a drug. Indeed, several effective drugs, such as thiazolidinediones, sulfonylureas, and statins, have drug targets whose genetic variant effect on the relevant phenotype is modest. I would suggest that inherited variants affecting expression or function of biologically critical factors would often have modest effect sizes. Common variants with major effects on expression or function of critical factors (in the absence of additional selective pressures favoring these variants) would be too harmful to health to be maintained in the population. Thus, rare variants with large effect or common variants with small effect may lead to new drug targets.
Using Genetics to Subtype Disease
I predict (or hope) that the future will see greater use of genetics to subclassify disease states. This is needed for heterogeneous conditions that may have different underlying pathophysiologies. Today, we take for granted the subclassification of diabetes into type 1 (T1D) (characterized by β-cell destruction, leading to insulin deficiency) and T2D (insulin resistance with insufficient hyperinsulinemic compensation). Knowledge of which type a patient has is essential to selecting proper therapy. Years ago, before there was knowledge of the pathophysiology, all subjects with hyperglycemia were considered together as diabetic, and they would be treated the same. At that time, insulin was the only medication available for diabetes. Recognition that some hyperglycemic patients responded to insulin whereas others did not was key to the subclassification of diabetes (25). The existence of two types of diabetes was long suspected based on clinical differences (eg, age of onset, presence of obesity). GWAS findings have substantiated the theory that these are two distinct disorders because there is extremely little overlap between the many loci for T1D and T2D (Supplemental Table 1). Where clinical differences are subtle, we can turn to genetics for further subclassification. This is still needed in diabetes, where we have T1D without autoimmunity (type 1B), latent autoimmune diabetes of adults (LADA), lean individuals with T2D, and ketosis-prone T2D (formerly called type 1.5) (26). We have already seen the tremendous impact of genetically based subclassification in rare monogenic forms of diabetes, such as maturity onset diabetes of the young type 3 (mutation in HNF1A) and certain forms of permanent neonatal diabetes, where sulfonylurea treatment is much more efficacious than insulin treatment (27, 28). In terms of more common forms of diabetes, a series of abstracts presented at the American Diabetes Association 75th Scientific Sessions foreshadowed future use of genetic information in common clinical settings. A genetic risk score based on 30 variants for T1D was able to discriminate between T1D and T2D in young adults aged 20–40 years (29). In a cohort of infants with neonatal diabetes (diagnosed before 6 mo of age), the T1D genetic risk score was able to distinguish maturity onset diabetes of the young from T1D (30). A third abstract determined genetic risk scores for T1D and T2D in young adults with clinically defined T1D, LADA, or T2D (31); genetically, those with T1D and LADA were indistinguishable, suggesting that LADA is a particular presentation of T1D, rather than a distinct condition or intermediate trait between T1D and T2D (Table 2). This shows nicely how data from GWAS can be used to clarify disease subtypes.
Table 2.
Use of Genetics to Subtype Common Endocrine Disorders
| Diabetes |
PCOS |
||||
|---|---|---|---|---|---|
| Type 1 | LADA | Type 2 | Type 1 | Type 2 | |
| Common clinical features | Hyperglycemia, micro- and macrovascular complications | Hyperglycemia, micro- and macrovascular complications | Hyperglycemia, micro- and macrovascular complications | Hyperandrogenism, oligomenorrhea, polycystic ovarian morphology | Hyperandrogenism, oligomenorrhea, polycystic ovarian morphology |
| Differentiating clinical featuresa | Childhood onset, islet autoimmunity | Adult onset, islet autoimmunity | Adult onset, no autoimmunity | Lean, elevated LH/FSH ratio | Overweight or obese, insulin resistance |
| Genetic signature | T1D | T1D | T2D | Set 1 | Set 2 |
Differentiating features are general trends, as T2D can occur in children and lean women with PCOS may present with insulin resistance.
With regard to pathophysiological knowledge, today PCOS might be where diabetes mellitus was 100 years ago. This heterogeneous condition is diagnosed based on the presence of hyperandrogenism (elevated circulating androgens or androgen precursors or clinical manifestations such as hirsutism), oligomenorrhea, and polycystic ovarian morphology (32). In treating these women, I have been impressed by the variability in body weight and insulin resistance. Let us propose the existence of at least two types of PCOS. “Type 1 PCOS” patients tend to have normal body weight and elevated ratios of LH to FSH (the classic elevated LH/FSH ratio, which has been noted to be more common in leaner PCOS women). Their underlying pathophysiology is dysfunction of the hypothalamic-pituitary-ovarian axis. “Type 2 PCOS” patients are overweight or obese and insulin resistant. In these patients, insulin resistance is the key initiating factor; the pancreas responds to this insulin resistance by increasing insulin secretion. Although this maintains normal blood glucose, it has the negative effect of stimulating ovarian androgen production and suppressing SHBG levels, exacerbating hyperandrogenemia (33). Today, patients with these patterns are grouped together and treated the same, leading to variable clinical responses. Also, they are usually not subdivided in research studies, which has hindered progress in dissecting the pathophysiology of PCOS. To test the hypothesis of two types of PCOS, we need to collect sufficient sample sizes (defined by the clinical features outlined above) of each subtype, followed by GWAS in each subgroup. If two subtypes of PCOS indeed exist, the sets of susceptibility loci detected by these two GWAS (set 1 and set 2 in Table 2) would be very different, as observed in GWAS for T1D and T2D. This would be a key step in officially establishing two subtypes of PCOS, which would facilitate research efforts and more precise clinical management. The recent formation of the international PCOS Genetics Consortium will make it possible to conduct the studies proposed above.
Currently published GWAS in PCOS, in examining cases of putative type 1 PCOS and type 2 PCOS pooled together, have yielded a mixture of loci, some consistent with type 1 PCOS (LHCGR [LH receptor], FSHR [FSH receptor], and FSHB [FSH β polypeptide]) and others consistent with type 2 PCOS (THADA and HMGA2 [thyroid adenoma associated and high mobility group AT-hook 2; both are loci for T2D], INSR [insulin receptor], and INS [insulin, not genome-wide significant but identified in pathway analysis]) (34–38). This blend of findings may reflect the mixture of these two (or more) subtypes of PCOS; conversely, it may also indicate that gonadotropic and metabolic abnormalities underlie the pathogenesis of PCOS in most patients, with gonadotropic abnormalities less apparent in heavier patients due to a proposed effect of obesity to dampen LH pulse amplitude and increase LH clearance (39, 40). Resolving whether set 1 and set 2 in Table 2 are largely the same or very different will be a fruitful use of genetics with major clinical implications.
Genetic-based efforts in disease subclassification will be more effective with application of the integrative approach of systems genomics, where genomic variation data are considered with other “-omics,” such as transcriptomics and epigenomics in disease-relevant tissues. The increased power of this approach may allow informative studies to be carried out in smaller sample sizes than needed for GWAS. We recently used this approach in subcutaneous adipose tissue, finding that the gene for the LH receptor was overexpressed in nonobese women with PCOS, whereas the gene for the insulin receptor was underexpressed in the obese women with PCOS, consistent with the two PCOS subtypes proposed above, type 1 and type 2, respectively (41). I hope the future will see the utilization in multiple endocrine disorders of this approach of subclassification by clinical features, followed by genetic or multiomic analyses in the subgroups to determine whether the subgroups have the same or different underlying pathophysiologies.
Missing Heritability = Missing Technology
There has been much discussion around the term “missing heritability.” Heritability refers to the proportion of a trait's variance that is attributable to additive effects of genes (in the narrow and widely adopted sense). There is some controversy around the usefulness of this parameter and its accuracy of calculation, but it has often served as the first step in approaching the genetics of common disease. For example, the heritability of T2D has been estimated at 40–50%. Yet, the approximately 100 loci discovered for T2D explain only approximately 10% of this heritability. The unexplained approximately 90% has been called the “missing heritability”; similar scenarios exist for many common diseases. Various proposed inherited factors that may account for this missing heritability include many yet-to-be-discovered common variants (with diminishing effect sizes), rare variants with large effects, gene-gene interactions, gene-environment interactions, epigenetic factors (eg, DNA methylation, histone modification), prenatal programming, and non-SNP variation (eg, copy number variation) (42).
Our success in explaining heritability has been limited by our technologies, which are best at detecting sequence variation (although not perfectly) (43, 44). The environment has been a particularly challenging item to measure, limiting our ability to conduct gene-environment analyses. Although we have made progress in genome-wide scale detection of DNA methylation and copy-number variation, these tools lack the completeness, reproducibility, and efficiency of today's SNP detection methods. The future will see technological advances that will allow us to comprehensively interrogate the possible explanations of missing heritability listed above. This will allow systems genetics approaches integrating multiple dimensions (genomic variation, environment, epigenetics, microbiome, and others) that will yield discoveries beyond those that meet statistical significance cutoffs in GWAS (45). Multidimensional approaches may ultimately prove most informative when acquired at multiple points in time, capturing molecular events heralding incident disease; to date, this approach has been employed on a very small scale (46). In large cohorts, this longitudinal approach may yield critical insights not seen in cross-sectional studies.
In my view, the deeper issue in missing heritability, aggravated by the limits of our technology, is how we think about DNA. We have been very focused on the primary structure of DNA (nucleic acid sequence), and our current technologies are quite good at measuring this (eg, SNP genotyping arrays, next generation sequencing). We tend to envision DNA as a linear string of the letters A, C, G, and T. What we have not focused on as a possible inherited determinant of phenotype is the tertiary (supercoiling) or quaternary (higher-order structure, including interactions with other molecules, eg, nucleosome density and chromatin packaging) structure of the DNA. We are starting to recognize long-range interactions, especially of enhancers with distal targets, with increasing appreciation that these enhancer interactions form physical three-dimensional chromatin domains (47). One could imagine heritable variation in higher-order chromatin structure that could affect gene expression. Interactions between different chromosomes may also regulate gene expression; epigenetic marks or sequence on one chromosome may affect the epigenetic marks and gene expression on other interacting chromosomes (48, 49). Sequence variants may in some cases exert their effects on phenotype by altering chromatin networks; it seems more likely that groups of SNPs rather than single SNPs could exert such an effect on higher-order structure and might depend on sequence variants on both interacting chromosomes. Whole genome sequencing will play a key role in identifying such variants. Three-dimensional structure and chromatin cross talk may also represent a type of genetic variation that is independent of primary sequence. This has been a space largely invisible to genetic epidemiology because we do not have the tools to efficiently interrogate this aspect of DNA at a genome-wide scale in large numbers of study samples. I can envision a time in the future when such technologies are available and lead to explanation of huge portions of today's missing heritability. We are heading in this direction with successive modifications of chromatin conformation capture (3C) methodologies (50), which convert physical chromatin contacts into detectable ligation products, with each new method (4C, 5C, ChIA-PET) (49, 51, 52) improving the potential for large-scale, genome-wide application. Also, the NIH Common Fund recently invested $25 million to establish the 4D Nucleome Program (http://commonfund.nih.gov/4Dnucleome/index), which aims to elucidate how the three-dimensional organization of the nucleus in space and time affects gene expression and cellular function. GWAS may one day utilize intra- and interchromosomal interactions and chromatin structure as independent variables, in addition to SNPs. We might one day look back and laugh at how we used to focus mainly on sequence. Given the complexity within the nucleus, it seems reasonable that SNPs would explain a small portion of phenotype heritability. A more complete characterization of heritability will propel our ability to translate genetic findings into new preventions and treatments.
Conclusion
My hope is that the future will see a greater role of genetics at the bedside, with genetic epidemiological discoveries leading not only to new treatments of endocrine disease, but also the development of effective preventive strategies. Genetics may lead us to new drugs as well as helping us prescribe the right drug to the right patients (via pharmacogenetics). I encourage the field to apply systems genetics approaches to subtype common heterogeneous endocrine conditions and to look forward to future technological breakthroughs that will reveal the heritable mysteries hidden in chromatin structure.
Acknowledgments
This work was supported by National Institute of Diabetes and Digestive and Kidney Disease Diabetes Research Center Grant P30-DK063491 (to the Southern California Diabetes Research Center).
Disclosure Summary: The author has nothing to disclose.
Footnotes
- FTO
- fat mass and obesity associated
- GWAS
- genome-wide association studies
- LADA
- latent autoimmune diabetes of adults
- LDL
- low-density lipoprotein
- PCOS
- polycystic ovary syndrome
- SNP
- single nucleotide polymorphism
- T1D
- type 1 diabetes
- T2D
- type 2 diabetes.
References
- 1. Welter D, MacArthur J, Morales J, et al. The NHGRI GWAS Catalog, a curated resource of SNP-trait associations. Nucleic Acids Res. 2014;42:D1001–D1006. [DOI] [PMC free article] [PubMed] [Google Scholar]
- 2. Lango H, Palmer CN, Morris AD, et al. Assessing the combined impact of 18 common genetic variants of modest effect sizes on type 2 diabetes risk. Diabetes. 2008;57:3129–3135. [DOI] [PMC free article] [PubMed] [Google Scholar]
- 3. Meigs JB, Shrader P, Sullivan LM, et al. Genotype score in addition to common risk factors for prediction of type 2 diabetes. N Engl J Med. 2008;359:2208–2219. [DOI] [PMC free article] [PubMed] [Google Scholar]
- 4. van Hoek M, Dehghan A, Witteman JC, et al. Predicting type 2 diabetes based on polymorphisms from genome-wide association studies: a population-based study. Diabetes. 2008;57:3122–3128. [DOI] [PMC free article] [PubMed] [Google Scholar]
- 5. Talmud PJ, Cooper JA, Morris RW, et al. Sixty-five common genetic variants and prediction of type 2 diabetes. Diabetes. 2015;64:1830–1840. [DOI] [PMC free article] [PubMed] [Google Scholar]
- 6. Sturm AC, Kline CF, Glynn P, et al. Use of whole exome sequencing for the identification of Ito-based arrhythmia mechanism and therapy. J Am Heart Assoc. 2015;4:pii:e001762. [DOI] [PMC free article] [PubMed] [Google Scholar]
- 7. Mohlke KL, Boehnke M. Recent advances in understanding the genetic architecture of type 2 diabetes. Hum Mol Genet. 2015;24:R85–R92. [DOI] [PMC free article] [PubMed] [Google Scholar]
- 8. Wessel J, Chu AY, Willems SM, et al. Low-frequency and rare exome chip variants associate with fasting glucose and type 2 diabetes susceptibility. Nat Commun. 2015;6:5897. [DOI] [PMC free article] [PubMed] [Google Scholar]
- 9. Segrè AV, Wei N, DIAGRAM Consortium, MAGIC Investigators, Altshuler D, Florez JC. Pathways targeted by antidiabetes drugs are enriched for multiple genes associated with type 2 diabetes risk. Diabetes. 2015;64:1470–1483. [DOI] [PMC free article] [PubMed] [Google Scholar]
- 10. Scuteri A, Sanna S, Chen WM, et al. Genome-wide association scan shows genetic variants in the FTO gene are associated with obesity-related traits. PLoS Genet. 2007;3:e115. [DOI] [PMC free article] [PubMed] [Google Scholar]
- 11. Frayling TM, Timpson NJ, Weedon MN, et al. A common variant in the FTO gene is associated with body mass index and predisposes to childhood and adult obesity. Science. 2007;316:889–894. [DOI] [PMC free article] [PubMed] [Google Scholar]
- 12. Claussnitzer M, Dankel SN, Kim KH, et al. FTO obesity variant circuitry and adipocyte browning in humans. N Engl J Med. 2015;373:895–907. [DOI] [PMC free article] [PubMed] [Google Scholar]
- 13. Smemo S, Tena JJ, Kim KH, et al. Obesity-associated variants within FTO form long-range functional connections with IRX3. Nature. 2014;507:371–375. [DOI] [PMC free article] [PubMed] [Google Scholar]
- 14. Cohen JC, Boerwinkle E, Mosley TH, Jr, Hobbs HH. Sequence variations in PCSK9, low LDL, and protection against coronary heart disease. N Engl J Med. 2006;354:1264–1272. [DOI] [PubMed] [Google Scholar]
- 15. Navarese EP, Kolodziejczak M, Schulze V, et al. Effects of proprotein convertase subtilisin/kexin type 9 antibodies in adults with hypercholesterolemia: a systematic review and meta-analysis. Ann Intern Med. 2015;163:40–51. [DOI] [PubMed] [Google Scholar]
- 16. Tung YC, Yeo GS, O'Rahilly S, Coll AP. Obesity and FTO: changing focus at a complex locus. Cell Metab. 2014;20:710–718. [DOI] [PubMed] [Google Scholar]
- 17. Rosse SA, Auer PL, Carlson CS. Functional annotation of putative regulatory elements at cancer susceptibility loci. Cancer Inform. 2014;13:5–17. [DOI] [PMC free article] [PubMed] [Google Scholar]
- 18. ENCODE Project Consortium. An integrated encyclopedia of DNA elements in the human genome. Nature. 2012;489:57–74. [DOI] [PMC free article] [PubMed] [Google Scholar]
- 19. Chadwick LH. The NIH Roadmap Epigenomics Program data resource. Epigenomics. 2012;4:317–324. [DOI] [PMC free article] [PubMed] [Google Scholar]
- 20. Chen CY, Chang IS, Hsiung CA, Wasserman WW. On the identification of potential regulatory variants within genome wide association candidate SNP sets. BMC Med Genomics. 2014;7:34. [DOI] [PMC free article] [PubMed] [Google Scholar]
- 21. Lo KS, Vadlamudi S, Fogarty MP, Mohlke KL, Lettre G. Strategies to fine-map genetic associations with lipid levels by combining epigenomic annotations and liver-specific transcription profiles. Genomics. 2014;104:105–112. [DOI] [PMC free article] [PubMed] [Google Scholar]
- 22. Hazelett DJ, Rhie SK, Gaddis M, et al. Comprehensive functional annotation of 77 prostate cancer risk loci. PLoS Genet. 2014;10:e1004102. [DOI] [PMC free article] [PubMed] [Google Scholar]
- 23. Yao L, Tak YG, Berman BP, Farnham PJ. Functional annotation of colon cancer risk SNPs. Nat Commun. 2014;5:5114. [DOI] [PMC free article] [PubMed] [Google Scholar]
- 24. Lowe WL, Jr, Reddy TE. Genomic approaches for understanding the genetics of complex disease. Genome Res. 2015;25:1432–1441. [DOI] [PMC free article] [PubMed] [Google Scholar]
- 25. Himsworth HP. Diabetes mellitus: its differentiation into insulin-sensitive and insulin-insensitive types. Lancet. 1936;227:127–130. [DOI] [PubMed] [Google Scholar]
- 26. Umpierrez GE, Smiley D, Kitabchi AE. Narrative review: ketosis-prone type 2 diabetes mellitus. Ann Intern Med. 2006;144:350–357. [DOI] [PubMed] [Google Scholar]
- 27. Pearson ER, Flechtner I, Njølstad PR, et al. Switching from insulin to oral sulfonylureas in patients with diabetes due to Kir6.2 mutations. N Engl J Med. 2006;355:467–477. [DOI] [PubMed] [Google Scholar]
- 28. Raile K, Schober E, Konrad K, et al. Treatment of young patients with HNF1A mutations (HNF1A-MODY). Diabet Med. 2015;32:526–530. [DOI] [PubMed] [Google Scholar]
- 29. Oram RA, Hill A, McDonald TJ, et al. A novel, inexpensive test can discriminate between type 1 and type 2 diabetes. Diabetes. 2015;64(suppl 1):A453 (Abstract 1745–P). [Google Scholar]
- 30. Patel KA, Weedon MN, Ellard S, Oram RA, Hattersley AT. Type 1 diabetes genetic risk score – a novel tool to differentiate monogenic diabetes from T1D. Diabetes. 2015;64 (suppl 1):A453 (Abstract 1746-P). [DOI] [PMC free article] [PubMed] [Google Scholar]
- 31. Kavvoura FK, Moutsianas L, Bennett AJ, et al. Can genomic information aid in establishing aetiology of young adult onset diabetes? Diabetes. 2015;64(suppl 1):A452 (Abstract 1744–P). [Google Scholar]
- 32. Rotterdam ESHRE/ASRM-Sponsored PCOS Consensus Workshop Group. Revised 2003 consensus on diagnostic criteria and long-term health risks related to polycystic ovary syndrome. Fertil Steril. 2004;81:19–25. [DOI] [PubMed] [Google Scholar]
- 33. Nestler JE, Powers LP, Matt DW, et al. A direct effect of hyperinsulinemia on serum sex hormone-binding globulin levels in obese women with the polycystic ovary syndrome. J Clin Endocrinol Metab. 1991;72:83–89. [DOI] [PubMed] [Google Scholar]
- 34. Chen ZJ, Zhao H, He L, et al. Genome-wide association study identifies susceptibility loci for polycystic ovary syndrome on chromosome 2p16.3, 2p21 and 9q33.3. Nat Genet. 2011;43:55–59. [DOI] [PubMed] [Google Scholar]
- 35. Hayes MG, Urbanek M, Ehrmann DA, et al. Genome-wide association of polycystic ovary syndrome implicates alterations in gonadotropin secretion in European ancestry populations. Nat Commun. 2015;6:7502. [DOI] [PMC free article] [PubMed] [Google Scholar]
- 36. Shi Y, Zhao H, Shi Y, et al. Genome-wide association study identifies eight new risk loci for polycystic ovary syndrome. Nat Genet. 2012;44:1020–1025. [DOI] [PubMed] [Google Scholar]
- 37. Day FR, Hinds DA, Tung JY, et al. Causal mechanisms and balancing selection inferred from genetic associations with polycystic ovary syndrome. Nat Commun. 2015;6:8464. [DOI] [PMC free article] [PubMed] [Google Scholar]
- 38. Shim U, Kim HN, Lee H, OH JY, Sung YA, Kim HL. Pathway analysis based on a genome-wide association study of polycystic ovary syndrome. PLoS One. 2015;10:e0136609. [DOI] [PMC free article] [PubMed] [Google Scholar]
- 39. Srouji SS, Pagán YL, D'Amato F, et al. Pharmacokinetic factors contribute to the inverse relationship between luteinizing hormone and body mass index in polycystic ovarian syndrome. J Clin Endocrinol Metab. 2007;92:1347–1352. [DOI] [PubMed] [Google Scholar]
- 40. Pagán YL, Srouji SS, Jimenez Y, Emerson A, Gill S, Hall JE. Inverse relationship between luteinizing hormone and body mass index in polycystic ovarian syndrome: investigation of hypothalamic and pituitary contributions. J Clin Endocrinol Metab. 2006;91:1309–1316. [DOI] [PubMed] [Google Scholar]
- 41. Jones MR, Brower MA, Xu N, et al. Systems genetics reveals the functional context of PCOS loci and identifies genetic and molecular mechanisms of disease heterogeneity. PLoS Genet. 2015;11:e1005455. [DOI] [PMC free article] [PubMed] [Google Scholar]
- 42. Manolio TA, Collins FS, Cox NJ, et al. Finding the missing heritability of complex diseases. Nature. 2009;461:747–753. [DOI] [PMC free article] [PubMed] [Google Scholar]
- 43. Clark MJ, Chen R, Lam HY, et al. Performance comparison of exome DNA sequencing technologies. Nat Biotechnol. 2011;29:908–914. [DOI] [PMC free article] [PubMed] [Google Scholar]
- 44. Lam HY, Clark MJ, Chen R, et al. Performance comparison of whole-genome sequencing platforms. Nat Biotechnol. 2012;30:78–82. [DOI] [PMC free article] [PubMed] [Google Scholar]
- 45. Multhaup ML, Seldin MM, Jaffe AE, et al. Mouse-human experimental epigenetic analysis unmasks dietary targets and genetic liability for diabetic phenotypes. Cell Metab. 2015;21:138–149. [DOI] [PMC free article] [PubMed] [Google Scholar]
- 46. Chen R, Mias GI, Li-Pook-Than J, et al. Personal omics profiling reveals dynamic molecular and medical phenotypes. Cell. 2012;148:1293–1307. [DOI] [PMC free article] [PubMed] [Google Scholar]
- 47. Pasquali L, Gaulton KJ, Rodríguez-Seguí SA, et al. Pancreatic islet enhancer clusters enriched in type 2 diabetes risk-associated variants. Nat Genet. 2014;46:136–143. [DOI] [PMC free article] [PubMed] [Google Scholar]
- 48. Sandhu KS, Shi C, Sjölinder M, et al. Nonallelic transvection of multiple imprinted loci is organized by the H19 imprinting control region during germline development. Genes Dev. 2009;23:2598–2603. [DOI] [PMC free article] [PubMed] [Google Scholar]
- 49. Zhao Z, Tavoosidana G, Sjölinder M, et al. Circular chromosome conformation capture (4C) uncovers extensive networks of epigenetically regulated intra- and interchromosomal interactions. Nat Genet. 2006;38:1341–1347. [DOI] [PubMed] [Google Scholar]
- 50. Dekker J, Rippe K, Dekker M, Kleckner N. Capturing chromosome conformation. Science. 2002;295:1306–1311. [DOI] [PubMed] [Google Scholar]
- 51. Dostie J, Richmond TA, Arnaout RA, et al. Chromosome Conformation Capture Carbon Copy (5C): a massively parallel solution for mapping interactions between genomic elements. Genome Res. 2006;16:1299–1309. [DOI] [PMC free article] [PubMed] [Google Scholar]
- 52. Zhang J, Poh HM, Peh SQ, et al. ChIA-PET analysis of transcriptional chromatin interactions. Methods. 2012;58:289–299. [DOI] [PubMed] [Google Scholar]