

Abstract
IMPORTANCE
High body mass index (BMI) and low physical fitness are risk factors for hypertension, but their interactive effects are unknown. Elucidation of interactions between these modifiable risk factors may help inform more effective interventions in susceptible subgroups.
OBJECTIVE
To determine the interactive effects of BMI and physical fitness on the risk of hypertension in a large national cohort.
DESIGN, SETTING, AND PARTICIPANTS
This cohort study included all 1 547 189 military conscripts in Sweden from January 1, 1969, through December 31, 1997 (97%–98% of all 18-year-old men nationwide each year), who were followed up through December 31, 2012 (maximum age, 62 years). Data analysis was conducted August 1 through August 15, 2015.
EXPOSURES
Standardized aerobic capacity, muscular strength, and BMI measurements obtained at a military conscription examination.
MAIN OUTCOMES AND MEASURES
Hypertension identified from outpatient and inpatient diagnoses.
RESULTS
A total of 93 035 men (6.0%) were diagnosed with hypertension in 39.7 million person-years of follow-up. High BMI and low aerobic capacity (but not muscular strength) were associated with increased risk of hypertension, independent of family history and socioeconomic factors (BMI, overweight or obese vs normal: incidence rate ratio, 2.51; 95% CI, 2.46–2.55; P < .001; aerobic capacity, lowest vs highest tertile: incidence rate ratio, 1.50; 95% CI, 1.47–1.54; P < .001). Aerobic capacity was inversely associated with hypertension across its full distribution (incidence rate ratio per 100 W, 0.70; 95% CI, 0.69–0.71; P < .001). A combination of high BMI (overweight or obese vs normal) and low aerobic capacity (lowest vs highest tertile) was associated with the highest risk of hypertension (incidence rate ratio, 3.53; 95% CI, 3.41–3.66; P < .001) and had a negative additive and multiplicative interaction (P < .001). Although high BMI was a significant risk factor for hypertension, low aerobic capacity also was a significant risk factor among those with normal BMI.
CONCLUSIONS AND RELEVANCE
In this large national cohort study, high BMI and low aerobic capacity in late adolescence were associated with higher risk of hypertension in adulthood. If confirmed, our findings suggest that interventions to prevent hypertension should begin early in life and include not only weight control but aerobic fitness, even among persons with normal BMI.
Hypertension is one of the most common medical disorders, affecting 1 in 4 adults in the United States1 and worldwide,2 with a lifetime prevalence that may exceed 90%.3 Its prevalence has increased in the United States and worldwide during the past 20 years concurrently with increasing rates of obesity and a sedentary lifestyle.4 Hypertension is associated with increased risks of stroke, ischemic heart disease, heart failure, kidney disease, and premature mortality.5 Despite its health importance, hypertension has a low rate of successful treatment; as many as two-thirds of adults in the United States with hypertension are either untreated or undertreated.6 Because of the known difficulty of successfully treating hypertension as well as its large health burden, better primary prevention through lifestyle modifications is a major public health priority. High body mass index (BMI),7–11 low physical activity,10–15 and low physical fitness9,13,16 are established modifiable risk factors for hypertension. Physical fitness (particularly aerobic capacity) has been found to be a stronger predictor of cardiovascular disease than physical activity17 and a better indicator of habitual physical activity than self-reported activity.18 However, to our knowledge, interactive effects between physical fitness and BMI early in life have not been examined in association with risk of hypertension in adulthood. A better understanding of these common modifiable risk factors, including their combined and interactive effects, is needed to inform more effective preventive interventions.
We conducted a large cohort study to examine the interactive effects between physical fitness (including both aerobic capacity and muscular strength) and BMI in late adolescence in association with the risk of hypertension in adulthood. Aerobic capacity, muscular strength, and BMI were assessed using standardized measurements in approximately 1.5 million 18-year-old male military conscripts in Sweden who were observed up to a maximum age of 62 years. Our aims were to examine interactions among aerobic capacity, muscular strength, and/or BMI in association with hypertension risk in a large national cohort, which may help inform more effective interventions early in life.
Methods
Study Population
We identified 1547 478 men aged 18 years who underwent a military conscription examination in Sweden from January 1, 1969, through December 31, 1997. This examination was compulsory for all males aged approximately 18 years nationwide each year except for 2% to 3% who either were incarcerated or had severe chronic medical conditions or disabilities documented by a physician. We excluded 289 (0.02%) individuals who had a prior diagnosis of hypertension identified from hospital discharge diagnoses. A total of 1 547 189 men (>99.9% of the original cohort) remained for inclusion in the study. This study was approved by the Regional Ethics Committee of Lund University in Sweden. Participant consent was not required for this study as it used only registry-based secondary data. To ensure confidentiality, all names and national identification numbers were replaced by anonymous serial numbers. The primary data analyses were conducted August 1 through August 15, 2015.
Ascertainment of Aerobic Capacity, Muscular Strength, and BMI
Aerobic capacity, muscular strength, and BMI measurements were obtained from the Swedish Military Conscription Registry, which contains information from a 2-day standardized physical and psychological examination required for all conscripts starting in 1969. Aerobic capacity was measured as the maximal aerobic workload in watts, using a standard well-validated electrically braked stationary bicycle ergometer test, as previously described.19 Maximal aerobic workload is highly correlated with maximal oxygen uptake (correlation of approximately 0.9),20 and its measurement using this bicycle ergometer test is highly reproducible, with a test-retest correlation of 0.95.21 Muscular strength was measured as the weighted sum of maximal knee extension (weighted × 1.3), elbow flexion (weighted × 0.8), and hand grip (weighted × 1.7), each measured in newtons, using standard well-validated isometric dynamometer tests.22 Each dynamometer test was performed 3 times and the maximum value was recorded for analysis, except when the last value was the highest value, in which case testing was repeated until strength values stopped increasing. Body mass index was determined using standardized height and weight measurements and calculated as weight in kilograms divided by height in meters squared. All testing equipment was calibrated daily.19,22
Aerobic capacity and muscular strength were modeled alternatively as continuous variables or categorical variables intertiles (aerobic capacity in watts: low, <240; medium, 240–288; or high, ≥289; and muscular strength in newtons: low, <1900; medium, 1900–2170; or high, ≥2171]). Body mass index was modeled alternatively as a continuous or categorical variable using definitions from the Centers for Disease Control and Prevention (CDC) for children and adolescents aged 2 to 19 years to facilitate comparability with US studies: overweight or obesity is defined as the 85th percentile or higher on the CDC’s 2000 sex-specific growth charts of BMI for age, which corresponds to a BMI of 25.6 or more for 18-year-old men.23
Ascertainment of Hypertension
The study cohort was followed up through December 31, 2012, for essential (primary) hypertension, which was identified using International Classification of Diseases (ICD) diagnosis codes (400–401 in ICD-8, 401 in ICD-9, and I10 in ICD-10) in the Swedish Hospital Registry and Swedish Outpatient Registry. The Swedish Hospital Registry contains all primary and secondary hospital discharge diagnoses from 6 populous counties in southern Sweden starting in 1964, with nationwide coverage starting in 1987; the Swedish Outpatient Registry contains outpatient diagnoses from all specialty clinics nationwide starting in 2001.
Adjustment Variables
Other variables that may be associated with hypertension were obtained from the Swedish Military Conscription Registry and national census data, which were linked using an anonymous personal identification number. The following were used as adjustment variables: year of the military conscription examination (modeled simultaneously as a continuous and categorical [1969–1979, 1980–1989, or 1990–1997] variable to account for follow-up time and attained age); family history of hypertension in a parent or sibling (yes or no; identified from diagnoses in the Swedish Hospital Registry during 1964–2012 and the Swedish Outpatient Registry during 2001–2012 using the same diagnostic codes as noted above, plus 444–445 in ICD-7); highest educational level attained during the study period (<12, 12–14, or ≥15 years); and neighborhood socioeconomic status (SES) at baseline (included because neighborhood SES characteristics have been associated with hypertension24,25 and with physical activity and BMI26; composed of an index that includes low educational level, low income, unemployment, and receipt of social welfare, as previously described27; categorized as low [>1 SD below the mean], medium [within 1 SD of the mean], or high [>1 SD above the mean]).
As alternatives to BMI, we also examined height and weight simultaneously in a separate model, which were modeled alternatively as continuous or categorical (height: <175, 175–184, or ≥185 cm; weight: <60, 60–79, or ≥80 kg) variables. In addition, we examined income at last follow-up (continuous and categorical variable in tertiles) and neighborhood SES at last follow-up (categorical variable as noted above) as potential confounders; however, they were highly correlated with highest educational level attained and baseline neighborhood SES, and further adjustment for them had no effect on other risk estimates; hence, they were not included in the final analyses.
Missing data for each variable were imputed using a standard multiple imputation procedure based on the variable’s association with all other covariates.28 Missing data were relatively infrequent for aerobic capacity (88 189 [5.7%]), muscular strength (77 359 [5.0%]), height (111 397 [7.2%]), weight (112 944 [7.3%]), educational level (5615 [0.4%]), and neighborhood SES (140 794 [9.1%]). As an alternative to multiple imputation, sensitivity analyses were performed after restricting the cohort to individuals with complete data for all variables (1 361 083 [88.0%]).
Statistical Analysis
Poisson regression with robust SEs was used to compute incidence rate ratios (IRRs) and 95% CIs for associations between aerobic capacity, muscular strength, or BMI and subsequent risk of hypertension.29 Two different adjusted models were performed: the first was adjusted for year of the military conscription examination (to account for follow-up time and attained age) and the second was additionally adjusted for aerobic capacity, muscular strength, BMI, family history of hypertension, educational level, and neighborhood SES (each as a categorical variable as defined above). Poisson model goodness-of-fit was assessed using deviance and Pearson χ2 tests, which showed a good fit in all models.
Interactions among aerobic capacity, muscular strength, and BMI on either the additive or multiplicative scale were examined in association with risk of hypertension. Additive interactions were assessed using relative excess risk owing to interaction (RERI), which is computed for binary variables as RERIIRR = IRR11 − IRR – IRR10 + 1.30,31 Multiplicative interactions were assessed using the ratio of IRRs: IRR11/(IRR10 × IRR01).30 All statistical tests were 2-sided and significance was set at P < .05. All analyses were conducted using STATA, version 13.0 (Stata Corp).32
Results
Amongthe1 547 189meninthiscohort, 93 035(6.0%) were subsequently diagnosed with hypertension in 39.7 million person-years of follow-up (mean follow-up, 25.7 years). The median age of participants at the end of follow-up was 46.0 years (mean [SD], 45.6 [9.3] years; range, 19.0–62.0 years). The median age of participants at hypertension diagnosis was 49.8 years (mean [SD], 48.5 [7.5] years; range, 18.0–62.0 years). The median BMI among men diagnosed with hypertension was 21.4 (mean [SD], 22.3 [3.4]; range, 15.6–40.6) and was 21.1 (mean [SD], 21.6 [2.8]; range 15.6–37.5) among those not diagnosed with hypertension. Median aerobic capacity among men diagnosed with hypertension was 231.8 W (mean [SD], 239.2 [46.7] W; range, 110.8–421.0 W) and was 264.0 W (mean [SD], 268.7 [54.4] W; range, 114.9–455.0 W) among those not diagnosed with hypertension. Median muscular strength among men diagnosed with hypertension was 2000 N (mean [SD], 2036 [341] N; range, 608–3220 N) and was 2020 N (mean [SD], 1982 [459] N; range, 425–3197 N) among those not diagnosed with hypertension.
Main Effects of Aerobic Capacity, Muscular Strength, and BMI
Low aerobic capacity was associated with a subsequent increased risk of hypertension, after adjusting for BMI and other potential confounders (IRR for lowest vs highest tertile, 1.50; 95% CI, 1.47–1.54; P < .001), including an inverse trend across the full range of aerobic capacity (IRR for trend test per 100 W, 0.70; 95% CI, 0.69–0.71; P < .001) (Table 1) . Muscular strength was slightly positively associated with risk of hypertension (IRR for trend test per 1000 N, 1.02; 95% CI, 1.00–1.04; P = .02).
Table 1.
Adjusted IRRs for Associations Between Physical Fitness, BMI, or Other Factors and Subsequent Risk of Hypertension Among 18-Year-Old Men
| Characteristic | Hypertension, No. (%) | Adjusted Model 1a | Adjusted Model 2b | |||
|---|---|---|---|---|---|---|
| No (n = 1 454 154) |
Yes (n = 93 035) |
IRR (95% CI) |
P Value | IRR (95% CI) |
P Value | |
| Aerobic capacity, tertiles | ||||||
| Low | 461 595 (31.7) | 49 659 (53.4) | 1.51 (1.48–1.54) | <.001 | 1.50 (1.47–1.54) | <.001 |
| Medium | 489 229 (33.6) | 31 219 (33.6) | 1.30 (1.27–1.33) | <.001 | 1.27 (1.24–1.30) | <.001 |
| High | 503 330 (34.6) | 12 157 (13.1) | 1 [Reference] | 1 [Reference] | ||
| Per 100 W, trend test | 0.74 (0.73–0.75) | <.001 | 0.70 (0.69–0.71) | <.001 | ||
| Muscular strength, tertiles | ||||||
| Low | 481 712 (33.1) | 29 370 (31.6) | 0.94 (0.93–0.96) | <.001 | 0.98 (0.97–1.00) | .03 |
| Medium | 488 919 (33.6) | 34 558 (37.1) | 0.94 (0.93–0.96) | <.001 | 0.98 (0.96–0.99) | .002 |
| High | 483 523 (33.3) | 29 107 (31.3) | 1 [Reference] | 1 [Reference] | ||
| Per 1000 N, trend test | 1.09 (1.07–1.11) | <.001 | 1.02 (1.00–1.04) | .02 | ||
| BMIc | ||||||
| Normal | 1 347 242 (92.6) | 80 037 (86.0) | 1 [Reference] | 1 [Reference] | ||
| Overweight or obese | 106 912 (7.4) | 12 998 (14.0) | 2.52 (2.48–2.56) | <.001 | 2.51 (2.46–2.55) | <.001 |
| Per 1 BMI unit, trend test | 1.08 (1.07–1.08) | <.001 | 1.08 (1.07–1.09) | <.001 | ||
| Height, cm | ||||||
| <175 | 324 780 (22.3) | 22 042 (23.7) | 1.03 (1.02–1.05) | <.001 | 1.14 (1.12–1.16) | <.001 |
| 175–184 | 856 680 (58.9) | 57 093 (61.4) | 1 [Reference] | 1 [Reference] | ||
| ≥185 | 272 694 (18.8) | 13 900 (14.9) | 0.86 (0.84–0.87) | <.001 | 0.78 (0.76–0.79) | <.001 |
| Per 5 cm, trend test | 0.95 (0.94–0.96) | <.001 | 0.90 (0.89–0.91) | <.001 | ||
| Weight, kg | ||||||
| <60 | 181 458 (12.5) | 10 282 (11.1) | 0.83 (0.81–0.84) | <.001 | 0.71 (0.70–0.73) | <.001 |
| 60–79 | 1 083 260 (74.5) | 65 331 (70.2) | 1 [Reference] | 1 [Reference] | ||
| ≥80 | 189 436 (13.0) | 17 422 (18.7) | 1.87 (1.84–1.90) | <.001 | 2.17 (2.14–2.21) | <.001 |
| Per 5 kg, trend test | 1.15 (1.14–1.16) | <.001 | 1.19 (1.18–1.20) | <.001 | ||
| Family history of hypertension | ||||||
| No | 742 697 (51.1) | 32 608 (35.0) | 1 [Reference] | 1 [Reference] | ||
| Yes | 711 457 (48.9) | 60 427 (65.0) | 1.56 (1.54–1.58) | <.001 | 1.54 (1.52–1.56) | <.001 |
| Educational level, y | ||||||
| <12 | 215 583 (14.8) | 21 199 (22.8) | 1.02 (1.00–1.03) | .04 | 0.98 (0.97–1.00) | .06 |
| 12–14 | 642 388 (44.2) | 41 098 (44.2) | 1 [Reference] | 1 [Reference] | ||
| ≥15 | 596 183 (41.0) | 30 738 (33.0) | 0.75 (0.74–0.76) | <.001 | 0.81 (0.80–0.83) | <.001 |
| Per higher category, trend | 0.85 (0.84–0.85) | <.001 | 0.90 (0.89–0.91) | <.001 | ||
| Neighborhood SES | ||||||
| Low | 222 647 (15.3) | 16 705 (18.0) | 1.05 (1.04–1.07) | <.001 | 1.03 (1.01–1.05) | .001 |
| Medium | 957 958 (65.9) | 64 079 (68.9) | 1 [Reference] | 1 [Reference] | ||
| High | 273 549 (18.8) | 12 251 (13.2) | 0.85 (0.84–0.87) | <.001 | 0.92 (0.90–0.94) | <.001 |
| Per higher category, trend | 0.90 (0.89–0.91) | <.001 | 0.95 (0.94–0.96) | <.001 | ||
Abbreviations: BMI, body mass index (calculated as weight in kilograms divided by height in meters squared); IRR, incidence rate ratio; SES, socioeconomic status.
Adjusted for year of the military conscription examination (to account for follow-up time and attained age).
Adjusted for year of the military conscription examination, aerobic capacity, muscular strength, BMI, family history of hypertension, educational level, and neighborhood SES. Height and weight were modeled simultaneously as an alternative to BMI in a separate model.
BMI was categorized using definitions from the Centers for Disease Control and Prevention for children and adolescents aged 2 to 19 years: overweight or obese is defined as the 85th percentile or higher from the Centers for Disease Control and Prevention’s 2000 sex-specific growth charts for BMI for age, which corresponds to a BMI of 25.6 or more for 18-year-old men.
High BMI was a significant risk factor for hypertension. Overweight or obese men (≥85th percentile on the CDC’s 2000 sex-specific growth chart of BMI for age) had a 2.5-fold risk of hypertension relative to those with normal BMI, after adjusting for potential confounders (IRR, 2.51; 95% CI, 2.46–2.55; P < .001) (Table 1). When both height and weight were included in the model as an alternative to BMI, low height and high weight were each independently associated with increased hypertension risk (Table 1), although high weight was a much stronger risk factor (P < .001 for heterogeneity).
A first-degree family history of hypertension was associated with a 1.5-fold risk of hypertension, after adjusting for BMI and other potential confounders (IRR, 1.54; 95% CI, 1.52–1.56; P < .001) (Table 1). Educational level and neighborhood SES were inversely associated with hypertension risk (ie, high educational level and high neighborhood SES were modestly protective) (P < .001 for trend) (Table 1). There was no evidence of statistical or biologically meaningful interaction between neighborhood SES and other variables in association with hypertension risk (P > .05 for each). In sensitivity analyses that were restricted to individuals with no missing data, all risk estimates were similar to the main results.
Interactions Among Aerobic Capacity, Muscular Strength, and BMI
The interactive effects of aerobic capacity and BMI on the risk of hypertension are shown in Table 2. Low aerobic capacity was associated with increased risk of hypertension even among men with normal BMI (IRR, 1.62; 95% CI, 1.58–1.67; P < .001). The combination of low aerobic capacity and high BMI was associated with highest risk of hypertension, which was approximately 3.5-fold higher relative to the reference group of men with high aerobic capacity and normal BMI (IRR, 3.53; 95% CI, 3.41–3.66; P < .001). Low aerobic capacity and high BMI had a significant negative interaction on both the additive and multiplicative scale (P < .001) (ie, the combined effect of these factors was less than the sum or product of their separate effects). The Figure shows the probability of hypertension for the 25th, 50th, and 75th percentiles of aerobic capacity across the full distribution of BMI, from the fully adjusted model.
Table 2.
Interactions Between Aerobic Capacity and BMI Among 18-Year-Old Men in Association With Subsequent Risk of Hypertensiona
| BMI | Aerobic Capacity (Tertiles) | IRRs (95% CI) for Aerobic Capacity Within Strata of BMI | ||||||
|---|---|---|---|---|---|---|---|---|
| High
|
Medium
|
Low
|
||||||
| No. Cases/Total No. | IRR (95% CI) |
No. Cases/Total No. | IRR (95% CI) |
No. Cases/Total No. | IRR (95% CI) |
Medium | Low | |
| Normal | 8819/457 911 | 1 [Reference] | 25 640/479 708 | 1.36 (1.32 to 1.39) |
45 578/489 660 | 1.62 (1.58 to 1.67) |
1.36 (1.32 to 1.39) |
1.62 (1.58 to 1.67) |
| Overweight or obese | 3338/57 576 | 3.24 (3.12 to 3.37) |
5579/40 740 | 3.38 (3.27 to 3.50) |
4081/21 594 | 3.53 (3.41 to 3.66) |
1.04 (1.00 to 1.09)b |
1.09 (1.04 to 1.14) |
| IRRs (95% CI) for BMI within strata of aerobic capacity | 3.24 (3.12 to 3.37) |
2.49 (2.43 to 2.56) |
2.18 (2.11 to 2.24) |
|||||
| Interaction on additive scale: RERI (95% CI) | −0.22 (−0.35 to −0.08)c |
−0.33 (−0.48 to −0.19) |
||||||
| Interaction on multiplicative scale: IRR (95% CI) | 0.77 (0.73 to 0.81) |
0.67 (0.64 to 0.70) |
||||||
Abbreviations: BMI, body mass index (calculated as weight in kilograms divided by height in meters squared); IRR, incidence rate ratio; RERI, relative excess risk owing to interaction.
IRRs are adjusted for year of military conscription examination, muscular strength, family history of hypertension, educational level, and neighborhood socioeconomic status. P< .001 for all except where otherwise indicated.
P= .05.
P= .002.
Figure. Probability of Developing Hypertension by Aerobic Capacity and BMI in 18-Year-Old Men.
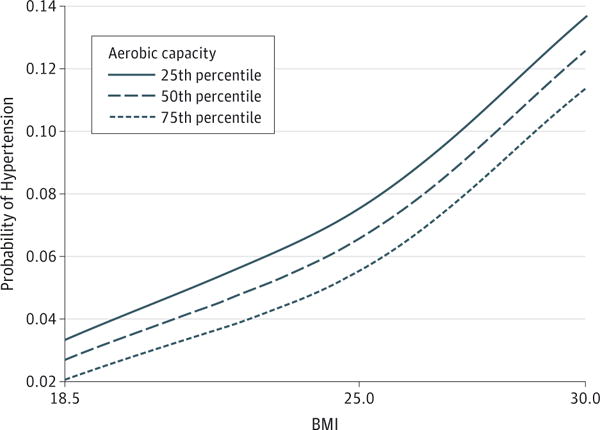
Median attained age was 46 years (maximum, 62 years). BMI indicates body mass index (calculated as weight in kilograms divided by height in meters squared).
In contrast, muscular strength had little effect on the risk of hypertension, regardless of BMI (eTable 1 in the Supplement) or aerobic capacity (eTable 2 in the Supplement). We found no interactions between muscular strength and BMI in association with the risk of hypertension on either the additive (P = .89) or multiplicative (P = .56) scale (eTable 1 in the Supplement). There was a modestly positive additive interaction between low muscular strength and low aerobic capacity (P = .001), suggesting that low aerobic capacity accounted for more cases of hypertension among men with low muscular strength than among those with high muscular strength (eTable 2 in the Supplement).
Discussion
In this large national cohort study, we found that high BMI and low aerobic capacity (but not muscular strength) in late adolescence were independently associated with a higher risk of hypertension in adulthood, after adjusting for family history and socioeconomic factors. Second, these factors had important joint effects: a combination of low aerobic capacity and high BMI was associated with the highest risk of hypertension, which was 3.5-fold higher than that of men with high aerobic capacity and normal BMI, but these factors had a negative interaction. Third, although high BMI was a significant risk factor for hypertension, low aerobic capacity also was a significant risk factor among men with normal BMI. If these associations are causal, they suggest that preventive interventions should begin early in life and include both weight control and aerobic fitness, even among those with normal BMI.
To our knowledge, this large cohort study is the first to examine not only the independent and combined effects of physical fitness and BMI on risk of hypertension but also potential multiplicative and additive interactions. A better understanding of the interactive effects of these common modifiable factors can help inform preventive interventions in susceptible subgroups. Additive interactions are often unexamined despite being more informative about the effect on public health.33,34 Previous studies have reported similar main effects for aerobic fitness9,13,16 or BMI7–11 in association with hypertension, without examining their interactions. Studies of self-reported physical activity (rather than objectively measured physical fitness) found that higher levels of physical activity in adulthood can partially offset the increased risks of hypertension associated with obesity.10,11 In addition, other evidence has suggested that aerobic fitness is protective against cardiovascular disease overall and more predictive of risk of cardiovascular disease than is physical activity.35–37 We found that the combination of low aerobic capacity and high BMI in late adolescence was associated with the highest risk of hypertension in adulthood, although these factors had a negative additive and multiplicative interaction (ie, their combined effect was less than the sum or product of their separate effects).
This study provides evidence that BMI and fitness level are important factors affecting the long-term risk of hypertension. The risk estimate that we observed for BMI (a 2.5-fold risk of hypertension among overweight or obese men) is consistent overall with previous estimates.7–11 Our findings indicate that obesity has a stronger influence than physical fitness on hypertension risk. However, low aerobic capacity is also a strong risk factor among those with normal BMI. This finding suggests that better aerobic fitness early in life may have long-term health benefits even among those who are not overweight or obese. Evidence from other studies also suggests that aerobic fitness is associated with better cardiovascular disease prognosis and lower mortality, independent of obesity.38
In contrast, we found that after adjusting for BMI, muscular strength had only a very weak (positive) association with the risk of hypertension. However, other studies have found that high muscular strength is associated with better outcomes in adults either with or without hypertension. A US cohort study of 1506 adult men with hypertension reported that high muscular strength was associated with lower all-cause mortality, independent of aerobic fitness, during a mean of 18 years of follow-up (hazard ratio for highest vs lowest tertile of muscular strength, 0.66; 95% CI, 0.45–0.98).39 Other studies also have reported that high muscular strength is associated with lower all-cause mortality in healthy adult men.40,41
Strengths of this study include its large national cohort design with prospective ascertainment of aerobic capacity, muscular strength, BMI, and hypertension. The national cohort design prevented selection bias, and the use of registry data with prospectively measured exposures prevented bias that may result from self-reporting. We examined well-validated, objective measures of aerobic capacity and muscular strength, which are likely better indicators of habitual physical activity than is self-reported activity.18 We were able to adjust for several other important risk factors for hypertension, including family history and individual and neighborhood-level socioeconomic factors, which also were prospectively ascertained and not self-reported.
Limitations of our study include measurement of physical fitness and BMI at only one age (18 years), which prevented us from examining changes in these factors over time. We lacked other measures of adiposity, such as waist circumference, as well as information on dietary factors that may potentially modify associations between physical fitness or BMI and hypertension. Although data on smoking were unavailable, aerobic capacity (maximal oxygen uptake) has been reported to be only 7% lower in 18-year-old male smokers compared with nonsmokers42; thus, smoking is unlikely to account for more than a small proportion of our observed association between aerobic capacity and the risk of hypertension. Because this study was based on Swedish military conscripts, the cohort consisted entirely of men. However, other studies have reported similar main effects for high BMI10,11 or low physical fitness9,13,16 in association with hypertension among women. Outpatient diagnoses in our study were available only from specialty clinics starting in 2001; hence, hypertension was under- reported. Furthermore, there were changes in diagnostic criteria during the study period. However, such underreporting and diagnostic changes are expected to be nondifferential with respect to physical fitness or BMI level and, therefore, are expected to influence our results conservatively (ie, toward the null hypothesis). Last, this study cohort was relatively young, with a median age of 46 years (maximum of 62 years) at the end of follow-up. Additional follow-up will be needed to examine these associations at older ages when hypertension is more common.
Conclusions
To our knowledge, this large national cohort study is the first to examine interactions between physical fitness and BMI in late adolescence in association with hypertension risk in adulthood. We found that high BMI and low aerobic capacity in late adolescence were independently associated with higher risk of hypertension in adulthood and had a negative interaction. Low aerobic capacity was a significant risk factor even among men with normal BMI. If confirmed, these findings suggest that interventions to prevent hypertension should begin early in life and include not only weight control but also aerobic fitness, even among those with a normal BMI.
Supplementary Material
Acknowledgments
Funding/Support: This work was supported by grant R01 HL116381 from the National Heart, Lung, and Blood Institute at the National Institutes of Health; the Swedish Research Council; and Avtal om Läkarutbildning och Forskning (Agreement on Medical Training and Research) project grant from Region Skåne/Lund University, Sweden.
Role of the Funder/Sponsor: The funding sources had no role in the design and conduct of the study; collection, management, analysis, and interpretation of the data; preparation, review, or approval of the manuscript; and decision to submit the manuscript for publication.
Footnotes
Author Contributions: Dr J. Sundquist had full access to all data in the study and takes responsibility for integrity of the data and accuracy of the data analysis.
Study concept and design: All authors.
Acquisition, analysis, or interpretation of data: Crump, J. Sundquist, K. Sundquist.
Drafting of the manuscript: Crump.
Critical revision of the manuscript for important intellectual content: All authors.
Statistical analysis: Crump, J. Sundquist, Winkleby.
Obtained funding: J. Sundquist, Winkleby, K. Sundquist.
Administrative, technical, or material support: J. Sundquist, K. Sundquist.
Study supervision: Crump, Winkleby, K. Sundquist.
Conflict of Interest Disclosures: None reported.
Contributor Information
Casey Crump, Department of Medicine, Stanford University, Stanford, California.
Jan Sundquist, Center for Primary Health Care Research, Lund University, Malmö, Sweden.
Marilyn A. Winkleby, Stanford Prevention Research Center, Stanford University, Stanford, California.
Kristina Sundquist, Center for Primary Health Care Research, Lund University, Malmö, Sweden.
References
- 1.Fields LE, Burt VL, Cutler JA, Hughes J, Roccella EJ, Sorlie P. The burden of adult hypertension in the United States 1999 to 2000: a rising tide. Hypertension. 2004;44(4):398–404. doi: 10.1161/01.HYP.0000142248.54761.56. [DOI] [PubMed] [Google Scholar]
- 2.Kearney PM, Whelton M, Reynolds K, Muntner P, Whelton PK, He J. Global burden of hypertension: analysis of worldwide data. Lancet. 2005;365(9455):217–223. doi: 10.1016/S0140-6736(05)17741-1. [DOI] [PubMed] [Google Scholar]
- 3.Vasan RS, Beiser A, Seshadri S, et al. Residual lifetime risk for developing hypertension in middle-aged women and men: the Framingham Heart Study. JAMA. 2002;287(8):1003–1010. doi: 10.1001/jama.287.8.1003. [DOI] [PubMed] [Google Scholar]
- 4.Hajjar I, Kotchen JM, Kotchen TA. Hypertension: trends in prevalence, incidence, and control. Annu Rev Public Health. 2006;27:465–490. doi: 10.1146/annurev.publhealth.27.021405.102132. [DOI] [PubMed] [Google Scholar]
- 5.Wang TJ, Vasan RS. Epidemiology of uncontrolled hypertension in the United States. Circulation. 2005;112(11):1651–1662. doi: 10.1161/CIRCULATIONAHA.104.490599. [DOI] [PubMed] [Google Scholar]
- 6.Hajjar I, Kotchen TA. Trends in prevalence, awareness, treatment, and control of hypertension in the United States, 1988–2000. JAMA. 2003;290(2):199–206. doi: 10.1001/jama.290.2.199. [DOI] [PubMed] [Google Scholar]
- 7.Gelber RP, Gaziano JM, Manson JE, Buring JE, Sesso HD. A prospective study of body mass index and the risk of developing hypertension in men. Am J Hypertens. 2007;20(4):370–377. doi: 10.1016/j.amjhyper.2006.10.011. [DOI] [PMC free article] [PubMed] [Google Scholar]
- 8.Shihab HM, Meoni LA, Chu AY, et al. Body mass index and risk of incident hypertension over the life course: the Johns Hopkins Precursors Study. Circulation. 2012;126(25):2983–2989. doi: 10.1161/CIRCULATIONAHA.112.117333. [DOI] [PMC free article] [PubMed] [Google Scholar]
- 9.Rankinen T, Church TS, Rice T, Bouchard C, Blair SN. Cardiorespiratory fitness, BMI, and risk of hypertension: the HYPGENE study. Med Sci Sports Exerc. 2007;39(10):1687–1692. doi: 10.1249/mss.0b013e31812e527f. [DOI] [PubMed] [Google Scholar]
- 10.Jackson C, Herber-Gast GC, Brown W. Joint effects of physical activity and BMI on risk of hypertension in women: a longitudinal study. J Obes. 2014;2014:271532. doi: 10.1155/2014/271532. [DOI] [PMC free article] [PubMed] [Google Scholar]
- 11.Hu G, Barengo NC, Tuomilehto J, Lakka TA, Nissinen A, Jousilahti P. Relationship of physical activity and body mass index to the risk of hypertension: a prospective study in Finland. Hypertension. 2004;43(1):25–30. doi: 10.1161/01.HYP.0000107400.72456.19. [DOI] [PubMed] [Google Scholar]
- 12.Pereira MA, Folsom AR, McGovern PG, et al. Physical activity and incident hypertension in black and white adults: the Atherosclerosis Risk in Communities Study. Prev Med. 1999;28(3):304–312. doi: 10.1006/pmed.1998.0431. [DOI] [PubMed] [Google Scholar]
- 13.Carnethon MR, Evans NS, Church TS, et al. Joint associations of physical activity and aerobic fitness on the development of incident hypertension: coronary artery risk development in young adults. Hypertension. 2010;56(1):49–55. doi: 10.1161/HYPERTENSIONAHA.109.147603. [DOI] [PMC free article] [PubMed] [Google Scholar]
- 14.Huai P, Xun H, Reilly KH, Wang Y, Ma W, Xi B. Physical activity and risk of hypertension: a meta-analysis of prospective cohort studies. Hypertension. 2013;62(6):1021–1026. doi: 10.1161/HYPERTENSIONAHA.113.01965. [DOI] [PubMed] [Google Scholar]
- 15.Semlitsch T, Jeitler K, Hemkens LG, et al. Increasing physical activity for the treatment of hypertension: a systematic review and meta-analysis. Sports Med. 2013;43(10):1009–1023. doi: 10.1007/s40279-013-0065-6. [DOI] [PubMed] [Google Scholar]
- 16.Juraschek SP, Blaha MJ, Whelton SP, et al. Physical fitness and hypertension in a population at risk for cardiovascular disease: the Henry Ford ExercIse Testing (FIT) Project. J Am Heart Assoc. 2014;3(6):e001268. doi: 10.1161/JAHA.114.001268. [DOI] [PMC free article] [PubMed] [Google Scholar]
- 17.Williams PT. Physical fitness and activity as separate heart disease risk factors: a meta-analysis. Med Sci Sports Exerc. 2001;33(5):754–761. doi: 10.1097/00005768-200105000-00012. [DOI] [PMC free article] [PubMed] [Google Scholar]
- 18.Swift DL, Lavie CJ, Johannsen NM, et al. Physical activity, cardiorespiratory fitness, and exercise training in primary and secondary coronary prevention. Circ J. 2013;77(2):281–292. doi: 10.1253/circj.cj-13-0007. [DOI] [PMC free article] [PubMed] [Google Scholar]
- 19.Nordesjo L, Schele R. Validity of an ergometer cycle test and measures of isometric muscle strength when predicting some aspects of military performance. Swedish J Defence Med. 1974;10:11–23. [Google Scholar]
- 20.Patton JF, Vogel JA, Mello RP. Evaluation of a maximal predictive cycle ergometer test of aerobic power. Eur J Appl Physiol Occup Physiol. 1982;49(1):131–140. doi: 10.1007/BF00428971. [DOI] [PubMed] [Google Scholar]
- 21.Andersen LB. A maximal cycle exercise protocol to predict maximal oxygen uptake. Scand J Med Sci Sports. 1995;5(3):143–146. doi: 10.1111/j.1600-0838.1995.tb00027.x. [DOI] [PubMed] [Google Scholar]
- 22.Höök O, Tornvall G. Apparatus and method for determination of isometric muscle strength in man. Scand J Rehabil Med. 1969;1(3):139–142. [PubMed] [Google Scholar]
- 23.Ogden CL, Flegal KM. Changes in terminology for childhood overweight and obesity. Natl Health Stat Report. 2010 Jun;25(25):1–5. [PubMed] [Google Scholar]
- 24.Mujahid MS, Diez Roux AV, Morenoff JD, et al. Neighborhood characteristics and hypertension. Epidemiology. 2008;19(4):590–598. doi: 10.1097/EDE.0b013e3181772cb2. [DOI] [PubMed] [Google Scholar]
- 25.Buys DR, Howard VJ, McClure LA, et al. Association between neighborhood disadvantage and hypertension prevalence, awareness, treatment, and control in older adults: results from the University of Alabama at Birmingham Study of Aging. Am J Public Health. 2015;105(6):1181–1188. doi: 10.2105/AJPH.2014.302048. [DOI] [PMC free article] [PubMed] [Google Scholar]
- 26.Stoddard PJ, Laraia BA, Warton EM, et al. Neighborhood deprivation and change in BMI among adults with type 2 diabetes: the Diabetes Study of Northern California (DISTANCE) Diabetes Care. 2013;36(5):1200–1208. doi: 10.2337/dc11-1866. [DOI] [PMC free article] [PubMed] [Google Scholar]
- 27.Crump C, Sundquist K, Sundquist J, Winkleby MA. Neighborhood deprivation and psychiatric medication prescription: a Swedish national multilevel study. Ann Epidemiol. 2011;21(4):231–237. doi: 10.1016/j.annepidem.2011.01.005. [DOI] [PMC free article] [PubMed] [Google Scholar]
- 28.Rubin DB. Multiple Imputation for Nonresponse in Surveys. New York, NY: Wiley; 1987. [Google Scholar]
- 29.Zou G. A modified poisson regression approach to prospective studies with binary data. Am J Epidemiol. 2004;159(7):702–706. doi: 10.1093/aje/kwh090. [DOI] [PubMed] [Google Scholar]
- 30.VanderWeele TJ, Knol MJ. A tutorial on interaction. Epidemiol Method. 2014;3(1):33–72. doi: 10.1515/em-2013-0005. [DOI] [Google Scholar]
- 31.Li R, Chambless L. Test for additive interaction in proportional hazards models. Ann Epidemiol. 2007;17(3):227–236. doi: 10.1016/j.annepidem.2006.10.009. [DOI] [PubMed] [Google Scholar]
- 32.StataCorp. Stata Statistical Software: Release 13. College Station, TX: StataCorp LP; 2013. [Google Scholar]
- 33.Knol MJ, Egger M, Scott P, Geerlings MI, Vandenbroucke JP. When one depends on the other: reporting of interaction in case-control and cohort studies. Epidemiology. 2009;20(2):161–166. doi: 10.1097/EDE.0b013e31818f6651. [DOI] [PubMed] [Google Scholar]
- 34.Greenland S. Interactions in epidemiology: relevance, identification, and estimation. Epidemiology. 2009;20(1):14–17. doi: 10.1097/EDE.0b013e318193e7b5. [DOI] [PubMed] [Google Scholar]
- 35.Lavie CJ, Arena R, Swift DL, et al. Exercise and the cardiovascular system: clinical science and cardiovascular outcomes. Circ Res. 2015;117(2):207–219. doi: 10.1161/CIRCRESAHA.117.305205. [DOI] [PMC free article] [PubMed] [Google Scholar]
- 36.Myers J, McAuley P, Lavie CJ, Despres JP, Arena R, Kokkinos P. Physical activity and cardiorespiratory fitness as major markers of cardiovascular risk: their independent and interwoven importance to health status. Prog Cardiovasc Dis. 2015;57(4):306–314. doi: 10.1016/j.pcad.2014.09.011. [DOI] [PubMed] [Google Scholar]
- 37.McAuley PA, Beavers KM. Contribution of cardiorespiratory fitness to the obesity paradox. Prog Cardiovasc Dis. 2014;56(4):434–440. doi: 10.1016/j.pcad.2013.09.006. [DOI] [PubMed] [Google Scholar]
- 38.Lavie CJ, McAuley PA, Church TS, Milani RV, Blair SN. Obesity and cardiovascular diseases: implications regarding fitness, fatness, and severity in the obesity paradox. J Am Coll Cardiol. 2014;63(14):1345–1354. doi: 10.1016/j.jacc.2014.01.022. [DOI] [PubMed] [Google Scholar]
- 39.Artero EG, Lee DC, Ruiz JR, et al. A prospective study of muscular strength and all-cause mortality in men with hypertension. J Am Coll Cardiol. 2011;57(18):1831–1837. doi: 10.1016/j.jacc.2010.12.025. [DOI] [PMC free article] [PubMed] [Google Scholar]
- 40.Ruiz JR, Sui X, Lobelo F, et al. Association between muscular strength and mortality in men: prospective cohort study. BMJ. 2008;337:a439. doi: 10.1136/bmj.a439. [DOI] [PMC free article] [PubMed] [Google Scholar]
- 41.Artero EG, Lee DC, Lavie CJ, et al. Effects of muscular strength on cardiovascular risk factors and prognosis. J Cardiopulm Rehabil Prev. 2012;32(6):351–358. doi: 10.1097/HCR.0b013e3182642688. [DOI] [PMC free article] [PubMed] [Google Scholar]
- 42.Dyrstad SM, Aandstad A, Hallén J. Aerobic fitness in young Norwegian men: a comparison between 1980 and 2002. Scand J Med Sci Sports. 2005;15(5):298–303. doi: 10.1111/j.1600-0838.2005.00432.x. [DOI] [PubMed] [Google Scholar]
Associated Data
This section collects any data citations, data availability statements, or supplementary materials included in this article.