

Abstract
♦ Background:
The use of automated and continuous ambulatory peritoneal dialysis (APD and CAPD) prescriptions (Rxs) to achieve adequate uremic toxin and fluid removal targets is important for attaining optimal patient outcomes. One approach for predicting such Rxs is the use of kinetic modeling.
♦ Methods:
Demographic data and peritoneal membrane characteristics derived from a peritoneal equilibration test (PET) were available from 1,005 patients in North American centers who participated in a national adequacy initiative in 1999. Twelve patient subgroups were identified according to peritoneal membrane transport type and tertiles of total body water, assumed equal to urea distribution volume (Vurea). Each patient was then modeled using PD Adequest 2.0 to be treated by 12 CAPD and 34 APD Rxs using both glucose and icodextrin solutions to achieve adequacy targets of weekly urea Kt/V of 1.7 and 1 L of daily ultrafiltration (UF). Residual kidney function (RKF) was assumed to be 0, 2, 4, and 6 mL/min. Feasible peritoneal dialysis (PD) Rxs were identified where: 1) the 95% confidence limit achieved the goal of meeting the targets for urea Kt/V, daily UF, and both in 85%, 75%, and 70% of patients, respectively; 2) average PD solution dextrose concentration was < 2.5%; and 3) the number of daytime exchanges was minimized.
♦ Results:
Feasible PD Rxs were similar when RKF was ≥ 2 mL/min, allowing condensed recommendations based on RKF ≥ 2 mL/min or < 2 mL/min. Individuals with lower or slower membrane transport required relatively greater 24-h solution volumes to achieve adequacy targets when RKF fell below 2 mL/min. With increasing Vurea, there was disproportionately greater dependence on RKF to achieve targets. While multiple Rxs achieving urea Kt/V and daily UF goals were identified for all membrane transport types, use of icodextrin in the long dwell reduced the need for a midday exchange in APD, glucose exposure, required fill and 24-h dwell volumes, irrespective of RKF and Vurea. While these benefits were most notable in high and high-average transporters, similar results were also seen in low and low-average transporters.
♦ Conclusions:
Kinetic modeling identified multiple APD and CAPD Rxs that achieved adequate uremic solute and fluid removal for patients, irrespective of RKF and Vurea. Use of icodextrin rather than glucose in the long dwell reduced the complexity of the PD regimen, total glucose exposure, and 24-h total treatment solution volumes. Irrespective of modeling, adequacy of any PD prescription should be based upon individual clinical evaluation both for volume and solute removal.
Keywords: Glucose, icodextrin, kinetic modeling, peritoneal dialysis, prescription, total body water, ultrafiltration, urea Kt/V
The major goal of renal replacement therapy (RRT) is to optimize the survival and clinical outcome of patients with end-stage renal disease (ESRD). Previously, adequacy targets for peritoneal dialysis (PD) patients were founded on both urea and creatinine kinetics based on the original interpretation of the results from the CANUSA trial (1). In recent years, minimum adequacy targets for PD patients have been altered based upon results from the ADEMEX and Hong Kong trials (2,3). The ADEMEX trial found no difference in survival of patients who received an average urea Kt/V of 1.80 or 2.27, and the Hong Kong trial similarly found no improvement in survival if patients received urea Kt/V of greater than 1.5 – 1.7. In neither study was a correlation noted between total creatinine cleared and patient outcome. Although neither of these trials demonstrated a significant difference in the hard outcome of survival over the near 3 years of study, the patients in the lowest clearance arms of both studies had worse “soft” clinical outcomes (e.g., uremic symptoms, hypo-responsiveness to erythropoietin). As such, even though a minimum urea Kt/V was not defined in the above studies, many national and international renal clinical practice guidelines have recommended a minimum urea Kt/V of 1.7 (4–8).
Additionally, as previous work has suggested a survival benefit associated with net fluid removed or ultrafiltration (9) and euvolemia (10,11), in particular for patients who are anuric (12–14), several renal clinical practice guidelines have recommended particular attention to volume removal (4,7,8). It is notable that several guidelines have been more directive in suggesting a minimum total ultrafiltration (UF) requirement of 750 or 1,000 mL per day (renal + peritoneal) as an additional parameter to assess adequacy (4,7). Current evidence-based literature highlights the prevalence of volume overload in patients with ESRD treated with PD (15–20), with average volume excesses of > 2 L (18). The relationship between urine output and volume overload (21) is uncertain, however, perhaps related to variable adherence to fluid intake restriction by the ESRD population.
Despite the above, there is ongoing controversy as to whether urea removal, as it is now measured, is the appropriate parameter to appraise adequate dialysis (8,22,23). Likewise, volume removal may merely be a surrogate for better nutrition or enhanced middle molecule clearance (5). Consequently, most renal clinical practice guidelines strongly emphasize the importance of monitoring other clinical parameters to assess the adequacy of PD. Nonetheless, clinicians would benefit from a simple prescription tool based on actual patient-based modeling that takes into account the individual patient's total body water (TBW), residual kidney function (RKF), and membrane transport type to achieve adequacy targets. Ideally, this tool would also provide prescriptions that would minimize the complexity of the PD prescription, limit exposure to hypertonic glucose, and provide a minimum peritoneal UF which could be adjusted, as required, depending upon the patient's volume status. The former two objectives would help lessen the impact of performing PD on the patient's quality of life and potentially attenuate cardiovascular risk (24,25) while diminishing structural and functional changes to the peritoneal membrane (26). The current work describes a prescription tool based on kinetic modeling that meets these objectives.
Methods
Patient Population
Data from 1,005 patients who participated in a national adequacy initiative (TARGET, Treatment Adequacy Review for Gaining Enhanced Therapy, Baxter Healthcare Corporation, Deerfield, IL, USA) were submitted by North American centers to the Renal Division of Baxter Healthcare Corporation in 1999. The subset of data from the TARGET study used in this analysis included patient age, gender, height, weight, and urea, creatinine, and glucose concentrations and drained volume measurements from an overnight exchange and a 4-h peritoneal equilibration test or PET. The latter was performed according to the protocol established by Twardowski et al. (27). Of the 1,005 patients in the dataset, 51% were women and 42% were anuric. Median age was 56 years, and median body surface area (BSA) was 1.9 m2. Peritoneal membrane transport classification was based on 4-h D/P creatinine measurements during the 4-h PET according to that specified by Twardowski et al. (27) as shown in Table 1. The patients were then divided into groups based on peritoneal membrane transport category (i.e. PET category); Table 2 shows the detailed characteristics of patients within these groups. Several representative summaries of peritoneal fluid and solute transport parameters derived from the TARGET study, including those assumed for icodextrin fractions, have been previously published (28–30).
TABLE 1.
Peritoneal Membrane Transport Categories by D/P Creatinine

TABLE 2.
Characteristics of Patient Population Categorized by Peritoneal Membrane Characteristics as Determined During PET

Modeled Patient Subgroups
In the above cohort, TBW was calculated for each patient according to Watson et al. (31) using the formulas given in Equation 1:
 |
Total body water was used for this subclassification since it is also assumed equal to the urea distribution volume (Vurea) in analyses using urea kinetics. The patient cohort was then subdivided into tertiles of TBW or Vurea with resulting intertertile values of 34 and 42 L (i.e. 33.3% and 66.7%). Consequently, the patients were divided into 3 subgroups with Vurea: less than 34 L, 34 – 42 L, and greater than 42 L. The estimated values of the patients' own RKF were not used when prescriptions were modeled for each patient. Instead, distinct levels of RKF of 0, 2, 4, and 6 mL/min of residual kidney urea clearance were superimposed to predicted total clearances. Figure 1 illustrates how the 48 distinct patient subgroups, defined by peritoneal membrane transport type as determined by PET, Vurea, or TBW, and 1 of 4 distinct levels of RKF (0, 2, 4, 6 mL/min) were derived.
Figure 1 —

Summary of the modeled patient groups. Only a subgroup of modeled patients are shown for simplicity.
RKF = residual kidney function; Vurea = urea distribution volume; H= high; HA = high-average; LA = low-average; L = low.
Considered Prescriptions
A total of 12 continuous ambulatory PD (CAPD) and 34 automated PD (APD) 24-h therapy prescriptions using both glucose- and icodextrin-based solutions were devised based upon the authors' clinical experience and their assessment as to the clinical utility of these prescriptions. For APD, both 9- and 10-h cycler times were considered. For CAPD, both 6- and 8-h overnight dwells were considered. Concentrations of glucose, fill volumes, and numbers of exchanges were varied to suit the majority of any PD population to which they could be applied. These prescriptions are summarized in Figure 2.
Figure 2 —

CAPD and APD prescriptions considered in the modeling. CAPD = continuous ambulatory peritoneal dialysis; APD = automated peritoneal dialysis.
PD Adequest 2.0 (Baxter Healthcare Corporation), a validated kinetic modeling software program based upon a modified 3-pore model that has been shown to accurately predict urea and creatinine 24-h clearances and daily UF for CAPD and APD prescriptions (32–34), was used in this study. The prescriptions shown in Figure 2 were simulated using PD Adequest 2.0 for kinetic parameters gathered during the 4-h PET and the long dwell exchange of greater than 8 hours (33), allowing the prediction of weekly urea Kt/V and daily UF for each prescription. The ability of each prescription in Figure 2 to achieve: 1) a minimum weekly urea Kt/V of 1.7 and/or daily peritoneal UF of 1 L; 2) minimal use of hypertonic (> 2.5% dextrose) solutions; and (3) minimum number of daytime exchanges (≤ 5) was evaluated.
The reported UF only included peritoneal UF predicted by PD Adequest. Neither the patient's own residual urine volume nor any derived value for urine volume loss based upon assignment of 1 of the 4 imposed levels of residual kidney urea clearance was used in the determination of UF. However, RKF (residual kidney urea clearance) was used to assess the total urea Kt/V achieved at each of the 4 distinct levels of RKF as shown in Equation 2:
 |
Data Analysis
Results for the above-mentioned 12 CAPD and 34 APD prescriptions were summarized for each patient subgroup segmented by transport type and Vurea category. The number of patients in each subgroup was not uniform, with low-average and high-average groups containing the largest number of patients as shown in Figure 3. An example of the methodological approach is described in more detail below.
Figure 3 —

Patient distribution in the modeled membrane transport type and Vurea groups. Y axis represents the percentage of patients in the cohort falling into each of four specific membrane transport characteristics and Vurea tertiles. The table illustrates specific numerical percentages for each specific Transport-Vurea subcategory. L = low; LA = low-average; HA = high-average; H= high; Vurea = urea distribution volume.
The Clopper-Pearson method (35,36) was used to determine the 95% confidence interval for the likelihood of the cohort to achieve the goal targets of urea Kt/V, daily UF, or both for each of the CAPD and APD prescriptions.
Results
Daily UF and urea Kt/V values obtained for each of the 48 modeled patient subgroups according to Figure 1 were compared against the target minimum values. The percentage of patients meeting the targets (i.e. urea Kt/V of 1.7 and daily UF of 1 L) in each subgroup was recorded along with the 95% confidence intervals. The specific prescriptions meeting urea Kt/V, daily UF, and both targets were then identified for any particular segment of the patient cohort based upon their membrane transport type, Vurea and RKF.
An example of such analyses is shown in Tables 3 and 4. Table 3 shows APD prescriptions or regimens 1.1 to 1.4 as 8 L therapies with 3 nighttime exchanges of either 1.5%/2.5% (i.e. mixed) or 2.5% dextrose and a single long day dwell of either 2.5% dextrose or icodextrin. Table 4 shows modeling results for high membrane transport patients with Vurea < 34 L and no residual kidney urea clearance that met the urea Kt/V and daily UF targets using each of the four APD regimens. This example also demonstrates the difference between icodextrin and an exclusively glucose-based PD prescription for patient subgroups with faster membrane transport characteristics. Here, only 45% and 21% of patients in this subgroup achieved both urea Kt/V and daily UF minimum targets when APD prescription 1.1 and APD prescription 1.2 were applied, respectively, using 2.5% and mixed dextrose solutions. Notably, both of the prescriptions utilizing icodextrin in the long day dwell (i.e. APD therapies 1.3 and 1.4) significantly increased the percentage of this population achieving urea Kt/V and daily UF minimum targets to 70% (APD 1.3) and 79% (APD 1.4). This was illustrated in other prescriptions where icodextrin was used as well.
TABLE 3.
APD Regimens 1.1 to 1.4

TABLE 4.
Sample Results for APD Regimen 1.1 to 1.4 for the High Transport Patient Group with Vurea Less than 34 L (n=33) and No Residual Kidney Urea Clearance

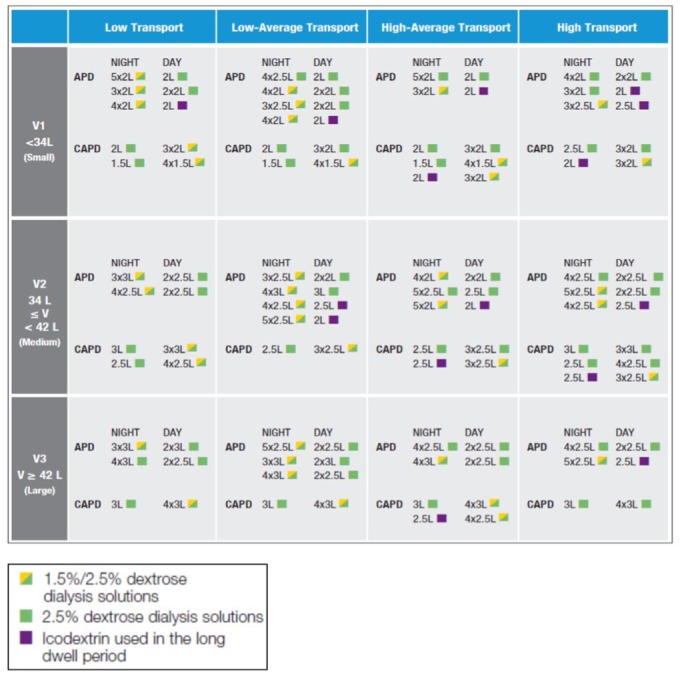
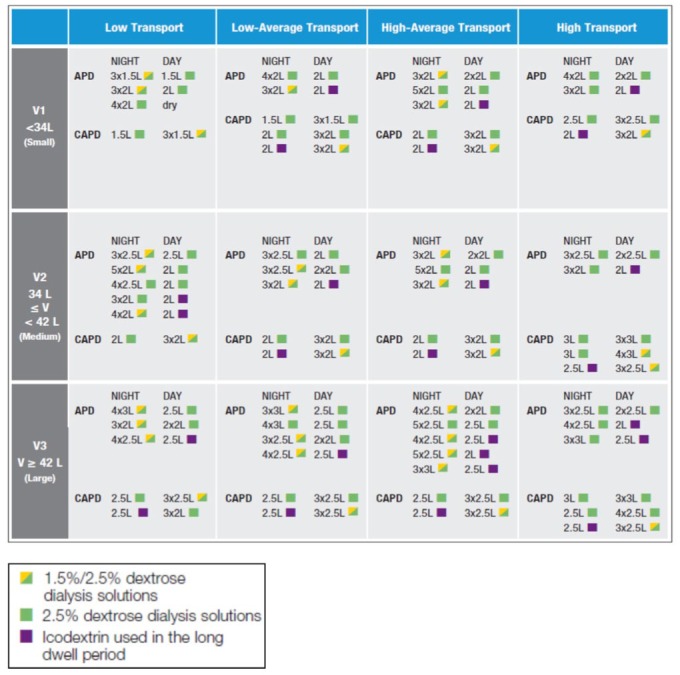
The same procedure was repeated for all APD and CAPD regimens, with patients segmented by tertiles of Vurea and the 4 distinct levels of imposed residual kidney urea clearance. Once all the parameters were investigated, little difference was noted in the likelihood of achieving the urea Kt/V and daily UF targets among the various levels of residual kidney urea clearance ≥ 2 mL/min for any of the CAPD or APD prescriptions, irrespective of membrane transport type. Hence, for simplicity, the RKF groups were collapsed into 2 groups: ≥ 2 mL/min and < 2 mL/min residual kidney urea clearance. As few prescriptions met 100% of the adequacy goals for all patients within each of the 48 subgroups, criteria were arbitrarily established to limit prescriptions to only those that achieved the minimum goals of urea Kt/V, daily UF, and both in 85%, 75%, and 70%, respectively. These percentages were chosen as they were the highest common denominator that all 48 subgroups could achieve for these parameters. To further narrow the spectrum of prescriptions to a more useable formulation, prescriptions that were perceived as overly burdensome for patients were also eliminated (i.e., more than 3 daytime exchanges in CAPD or multiple manual daytime exchanges in APD). A detailed summary of the selected prescriptions that met the pre-established adequacy guidelines, minimization of glucose loading, and ease of implementation is shown in Figures 4 and 5.
Figure 4 —
Prescriptions for patients with residual urea clearance less than 2 mL/min.
APD = automated peritoneal dialysis; CAPD = continuous ambulatory peritoneal dialysis.
Figure 5 —
Prescriptions for patients with residual urea clearance greater than or equal to 2 mL/min.
APD = automated peritoneal dialysis; CAPD = continuous ambulatory peritoneal dialysis.
Discussion
The latest version of Kidney Disease Outcome Quality Initiatives (KDOQI) guidelines for PD recommended targeting urea and not creatinine clearance in assessing adequacy of waste or uremic solute removal. Additionally, other national and international guidelines have suggested increased attention to achievement of euvolemia by enhancing volume removal when using PD therapy. Kinetic modeling based upon the 3-pore model using PD Adequest has been demonstrated to accurately predict solute mass and fluid removal from the patient (32–34). We utilized PD Adequest to develop a menu of prescriptions for patients based upon tertiles of a wide range of individual Vurea values obtained from a large cohort of PD patients. The criteria used in formulating these PD prescriptions provided here (Figures 4 and 5) allow the clinician to achieve a weekly urea Kt/V of 1.7, daily peritoneal UF of ≥ 1 L, or both with 85, 75, and 70% certainty for any patient according to membrane transport type, residual kidney urea clearance (RKF) ≥ or < 2 mL/min, and Vurea. The additional criteria used in selecting final prescriptions, specifically the restriction to those prescriptions using dextrose concentrations ≤ 2.5% and those having a negative impact on performance of daily life, should help mitigate systemic metabolic and peritoneal membrane consequences of PD, improve adherence, and enhance technique success.
The imposition of distinct levels of residual kidney urea clearance coupled with an absolute peritoneal UF on the determination of likelihood for each patient in the study cohort to achieve adequate solute and peritoneal volume removal enabled us to segment and extrapolate the success of each PD prescription to a broad range of patients, segmented by tertiles of Vurea. It should be noted that every 1 mL/min of residual kidney urea clearance in a 70 kg patient with an estimated Vurea of 42 L provides a weekly urea Kt/V of approximately 0.25. In the same individual, 2, 4, or 6 mL/min of residual kidney urea clearance will contribute a weekly urea Kt/V of 0.5, 1, or 1.5 toward a target Kt/V of 1.7, or approximately 30, 60, or 90% of the total urea Kt/V target, respectively. As such, it is obvious why greater levels of residual kidney urea clearance would provide more flexibility in the PD prescription regimen. This enabled us to collapse the categorization of PD prescriptions down to residual kidney urea clearance values of either ≥ 2 mL/min or < 2 mL/min. Conversely, it is also apparent from this work that the absence of RKF (urea clearance), especially in patients in the largest tertile of Vurea and low membrane transport, results in greater limitations and more onerous PD prescriptions (i.e. greater fill volume, dwell time, and number of exchanges) in order to achieve adequacy targets, particularly for urea removal. Although these concepts are well known qualitatively by clinicians, the current effort clarifies these limitations quantitatively and proposes practical prescriptions that can achieve adequacy targets in a large percentage of patients.
The analysis also suggests that use of icodextrin in PD prescriptions can reduce the number and frequency of exchanges while still achieving adequacy goals. This simplification should theoretically minimize the complexity of the therapy for patients, reducing the burden of therapy and improving the likelihood of technique success. The effectiveness of icodextrin to enhance volume and waste removal is due to the well-described ability of icodextrin to primarily engage the small pores of the peritoneal capillaries to generate sustained UF and accompanying solute drag over extended periods of dwell time. Conversely, glucose-based PD solutions not only become iso-osmolar compared with plasma over time as glucose is absorbed across peritoneal capillaries, but a large portion of the ultrafiltrate obtained is devoid of solute resulting from the action of these solutions on peritoneal capillary aquaporins. The contrasting mechanisms of these osmotic agents ensure that volume removal using icodextrin will also remove more sodium than the same UF volume when using glucose-based solutions (29,30).
As discussed above, a 1-L peritoneal UF target was included as a prescription goal. Including a UF target was felt to be imperative given increasing evidence of the risk of overhydration in a large fraction of PD patients (15–20), and that management of volume status in ESRD patients is now widely recognized as crucial to optimize clinical outcomes (37,38). Obviously, many patients on PD still have a significant urine output and may not require this volume of peritoneal volume removal. As there is a poor correlation between renal excretory function and urine output, we did not include residual urine volume in our calculations. Moreover, greater or lesser amounts of UF may be required for individual patients depending upon their oral intake, level of urine output, and state of effective arterial volume (hydration status). More volume removal may be required in some, less in others depending upon these values. While this prescription guide could have been expanded to include prescriptions that would assume various levels of urine output (i.e. 500, 1,000, 1,500 mL, etc.), the result for clinicians and their patients could be a change in prescription on as much as a daily basis, depending on adherence to fluid and solute intake. Such an approach is likely impractical. An alternative approach is to attenuate the desired peritoneal UF, based on known urine output and fluid gain, using these same prescriptions, but by decreasing the glucose concentration of solutions used in the prescription. More specifically, for non-anuric patients, use of all 1.5% dextrose solutions would be advised for prescriptions where a blended use of 1.5/2.5% dextrose solutions is suggested. In like manner, use of a blended 1.5/2.5% dextrose solution prescription in such non-anuric patients may be necessary where all 2.5% dextrose solutions were suggested. According to evaluations made by Rippe et al. (39), substitution of a 1.5% dextrose PD solution for a 2.5% dextrose solution will result in 200 mL less UF for each short dwell and any long dwell. Such an approach would likely continue to achieve adequate solute removal, at least approximately, because solute removal is determined largely by total daily treatment volume, not UF volume. This latter approach is similar to current clinical practice and what most patients routinely do to achieve target or dry weight.
It should be noted that the current prescription guide may not be applicable to all PD patients, and other prescriptions may be necessary. For example, patients with a copious urine volume output who are just starting dialysis, particularly those residing in the lowest Vurea tertile, may require CAPD prescriptions of only 3 daytime exchanges, or APD prescriptions with fewer nocturnal exchanges or a dry day. These “incremental” PD prescriptions were not evaluated here. As the prescriptions chosen from the tool for a specific patient do not provide 100% certainty of reaching the targets, but 80 % or even less, it is imperative that clinicians subsequently not only follow up on patient well-being, but check adequacy results with real 24-h measurements. The tool described here is meant to be used as a guide in prescription writing, not as a substitute for an actual determination of the patient's delivered solute and fluid removal.
As can be noted, there are several prescriptions (Figures 4 and 5), where 3-L fill volumes are required to achieve adequacy targets. Three-liter fill volumes are more frequently required to achieve targets when residual kidney urea clearance is < 2 mL/min. As with all other considerations with regard to PD prescription, clinicians must consider individual patient tolerance to a specific fill volume. While abdominal compliance and tolerance to larger fill volumes is greater when patients are in the supine position, individual body size, habitus, and comorbidities may increase intraperitoneal pressures to undesirable levels, potentially compromising patient safety, particularly after ultrafiltrate is added to the dwell volume (40,41). If nothing else, demonstration of extremes of PD prescription, such as 3-L fill volumes that would be needed to achieve adequacy for patients with < 2mL/min of residual renal urea clearance, higher Vurea, and slower membrane transport function, should help highlight for prescribers when it might be appropriate to consider transfer to another dialysis modality, particularly if APD is not an option.
There are several additional limitations to our analyses. While ESRD patients typically lose RKF and urine volume over time, most, if not all, patients start dialysis with residual urine volume; conservatively, no residual urine volume was taken into account in our study. As such, in implementing the prescriptions suggested here for specific patients, clinicians need to take into account existing urine losses of each patient and modify the PD prescription accordingly. This would usually mean attenuating the dwell volume, the glucose concentration of the PD solution, or even decreasing the number of exchanges. In doing so, it is important to note that any of these maneuvers can also attenuate solute removal (Kt), due to reductions in overall diffusive and convective solute removal. Given the expanded spectrum of waste removed with even minimal RKF, however, this is unlikely to be a clinical issue impacting adequacy or outcome. Our decision to default to a scenario devoid of urine volume represents our impression of the importance of volume control, especially in anuric patients. Nonetheless, it is important that attention be paid to avoiding intravascular volume depletion of PD patients so as to avoid hypotension which could potentially compromise RKF (42).
In this study, peritoneal fluid and solute transport parameters were determined using PD Adequest 2.0 from an overnight exchange and a 4-h PET. While this approach is valid, it is not unique and other methods could have alternatively been employed (43–47). These alternative methods may provide more accurate estimates of peritoneal transport parameters, but they also require additional procedures that make their clinical application more cumbersome. All of these approaches are based on the 3-pore model and would likely provide similar results to those in the present study. It should also be recognized that the modeling predictions for icodextrin solutions in PD Adequest 2.0 use default values for blood levels of icodextrin and its metabolites and therefore can overestimate UF in patients treated with icodextrin solutions over the long term (48). Thus, the predictions for icodextrin solutions should be considered as those only at the initiation of the prescription. As with any clinical guidance using kinetic models, the predictions from such models are intended to be approximations only and should not replace actual measurements of adequate therapy.
Finally, it should be emphasized that there are multiple factors contributing to the outcome of PD patients, and it is not the intention of this analysis and prescription guide to overstate the importance of urea Kt/V. Nonetheless, achieving both adequate small solute clearance and volume removal through appropriate PD prescriptions plays an important role in patient health and well-being. Patients in the lowest clearance arms of both the ADEMEX and the Hong Kong adequacy trials had worse “soft” clinical outcomes that could partially be attributed to insufficient toxin removal.
The PD prescription needed to achieve minimum solute and volume removal adequacy depends upon the volume of distribution of uremic wastes, the peritoneal membrane transport characteristics, and the remaining residual kidney urea clearance, all of which were accounted for in this prescriptive analysis. As such, it should accommodate the prescriptive needs for a majority of patients. Use of this prescription guide will also hopefully improve clinicians' confidence in prescribing PD, enhance overall patient adherence to therapy, and ensure achievement of waste and volume removal targets with the caveat that clinical findings should be the primary driver of PD therapy.
Disclosures
All authors were employees of Baxter Healthcare Corporation with ownership interests at the time of this work.
Acknowledgments
All funds for this work were provided by Baxter Healthcare Corporation. All authors were employees of Baxter Healthcare Corporation with ownership interests at the time of this work. The comments and editorial assistance from J.K. Leypoldt of Baxter Healthcare Corporation are gratefully acknowledged.
REFERENCES
- 1. Canada-USA (CANUSA) Peritoneal Dialysis Study Group Adequacy of dialysis and nutrition in continuous peritoneal dialysis: association with clinical outcomes. J Am Soc Nephrol 1996; 7:198–207. [DOI] [PubMed] [Google Scholar]
- 2. Paniagua R, Amato D, Vonesh E, Correa-Rotter R, Ramos A, Moran J, et al. Effects of increased peritoneal clearances on mortality rates in peritoneal dialysis: ADEMEX, a prospective, randomized, controlled trial. J Am Soc Nephrol 2002; 13:1307–20. [DOI] [PubMed] [Google Scholar]
- 3. Lo WK, Ho YW, Li CS, Wang KS, Chan TM, Yu AW, et al. Effect of Kt/V on survival and clinical outcome in CAPD patients in a randomized prospective study. Kidney Int 2003; 64:649–56. [DOI] [PubMed] [Google Scholar]
- 4. Dombros NV, Dratwa M, Feriani M, Gokal R, Heimbürger O, Krediet RT, et al. European best practice guidelines for peritoneal dialysis. Adequacy of peritoneal dialysis. Nephrol Dial Transplant 2005; 20(Suppl 9):ix24–7. [DOI] [PubMed] [Google Scholar]
- 5. National Kidney Foundation KDOQI clinical practice guidelines and clinical practice recommendations for 2006 updates: hemodialysis adequacy, peritoneal dialysis adequacy and vascular access. Am J Kidney Dis 2006; 48(Suppl 1):S1–232. 17045862 [Google Scholar]
- 6. Lo W-K, Bargman JM, Burkart J, Krediet RT, Pollock C, Kawanishi H, et al. Guideline on targets for solute and fluid removal in adult patients on chronic peritoneal dialysis. Perit Dial Int 2006; 26:520–2. [PubMed] [Google Scholar]
- 7. Woodrow G, Davis S. Peritoneal Dialysis in CKD. http://www.renal.org/guidelines/modules/peritoneal-dialysis-in-ckd#sthash.jaX1OBrk.dpbs, 30 July 2010.
- 8. Blake PG, Bargman JM, Brimble KS, Davison SN, Hirsh D, McCormick BB, et al. Clinical practice guidelines and recommendations on peritoneal dialysis adequacy 2011. Perit Dial Int 2011; 31:218–39. [DOI] [PubMed] [Google Scholar]
- 9. Ateş K, Nergizoğlu G, Keven K, Şen A, Kutlay S, Ertürk S, et al. Effect of fluid and sodium removal on mortality in peritoneal dialysis patients. Kidney Int 2001; 60:767–76. [DOI] [PubMed] [Google Scholar]
- 10. Paniagua R, Ventura M-J, Ávila-Díaz M, Hinojosa-Heredia H, Mendéz-Durán A, Cueto-Manzano A, et al. NT-proBNP, fluid volume overload and dialysis modality are independent predictors of mortality in ESRD patients. Nephrol Dial Transplant 2010; 25:551–7. [DOI] [PubMed] [Google Scholar]
- 11. Koh K-H, Wong H-S, Go K-W, Morad Z. Normalized bioimpedance indices are better predictors of outcome in peritoneal dialysis patients. Perit Dial Int 2011; 31:574–82. [DOI] [PubMed] [Google Scholar]
- 12. Brown EA, Davies SJ, Rutherford P, Meeus F, Borras M, Riegel W, et al. Survival of functionally anuric patients on automated peritoneal dialysis: the European APD Outcome Study. J Am Soc Nephrol 2003; 14:2948–57. [DOI] [PubMed] [Google Scholar]
- 13. Jansen MA, Termorshuizen F, Korevaar JC, Dekker FW, Boeschoten E, Krediet RT, et al. Predictors of survival in anuric peritoneal dialysis patients. Kidney Int 2005; 68:1199–205. [DOI] [PubMed] [Google Scholar]
- 14. Davies SJ, Brown EA, Reigel W, Clutterbuck E, Heimbürger O, Diaz NV, et al. What is the link between poor ultrafiltration and increased mortality in anuric patients on automated peritoneal dialysis? Analysis from EAPOS. Perit Dial Int 2006; 4:458–65. [PubMed] [Google Scholar]
- 15. Konings CJAM, Kooman JP, Schonck M, Dammers R, Cheriex E, Meulemans APP, et al. Fluid status, blood pressure, and cardiovascular abnormalities in patients on peritoneal dialysis. Perit Dial Int 2002; 22:477–87. [PubMed] [Google Scholar]
- 16. Van Biesen W, Williams JD, Covic AC, Fan S, Claes K, Vichodziejewska-Niemierko M, et al. Fluid status in peritoneal dialysis patients: the European Body Composition Monitoring (EuroBCM) Study Cohort. PLoS ONE 2011; 6:e17148. [DOI] [PMC free article] [PubMed] [Google Scholar]
- 17. Fan S, Sayed RH, Davenport A. Extracellular volume expansion in peritoneal dialysis patients. Int J Artif Organs 2012; 35:338–45. [DOI] [PubMed] [Google Scholar]
- 18. van Biesen W, Claes K, Covic A, Fan S, Lichodziejewska-Niemierko M, Schroder V, et al. A multicentric, international matched pair analysis of body composition in peritoneal dialysis versus haemodialysis patients. Nephrol Dial Transplant 2013; 28: 2620–8. [DOI] [PubMed] [Google Scholar]
- 19. Kwan BC, Szeto C-C, Chow K-M, Law MC, Cheng MS, Leung CB, et al. Bioimpedance spectroscopy for the detection of fluid overload in Chinese peritoneal dialysis patients. Perit Dial Int 2014; 34:409–16. [DOI] [PMC free article] [PubMed] [Google Scholar]
- 20. Kocyigit I, Sipahioglu MH, Orscelik O, Unal A, Celik A, Abbas SR, et al. The association between arterial stiffness and fluid status in peritoneal dialysis patients. Perit Dial Int 2014; 34:781–90. [DOI] [PMC free article] [PubMed] [Google Scholar]
- 21. Cheng LT, Chen W, Tang W, Wang T. Residual renal function and volume control in peritoneal dialysis patients. Nephron Clin Pract 2006; 104:c47–54. [DOI] [PubMed] [Google Scholar]
- 22. Yalavarthy R, Teitelbaum I. Peritoneal dialysis adequacy: not just small solute clearance. Adv Perit Dial 2008; 24:99–103. [PubMed] [Google Scholar]
- 23. Bargman JM. Adequacy of peritoneal dialysis: time to move on from Kt/V? Perit Dial Int 2002; 22:549–51. [PubMed] [Google Scholar]
- 24. Garciá-López E, Carrero JJ, Suliman ME, Lindholm B, Stenvinkel P. Risk factors for cardiovascular disease in patients undergoing peritoneal dialysis. Perit Dial Int 2007; 27(Suppl 2):S205–9. [PubMed] [Google Scholar]
- 25. Krediet RT, Balafa O. Cardiovascular risk in the peritoneal dialysis patient. Nat Rev Nephrol 2010; 6:451–60. [DOI] [PubMed] [Google Scholar]
- 26. Davies SJ, Phillips L, Naish PF, Russell GI. Peritoneal glucose exposure and changes in membrane solute transport with time on peritoneal dialysis. J Am Soc Nephrol 2001; 12:1046–51. [DOI] [PubMed] [Google Scholar]
- 27. Twardowski ZJ, Nolph KD, Khanna R, Prowant BF, Ryan LP, Moore HL, et al. Peritoneal equilibration test. Perit Dial Bull 1987; 7:138–47. [Google Scholar]
- 28. Mujais S, Vonesh E. Profiling of peritoneal ultrafiltration. Kidney Int 2002; 62(Suppl 81):S17–22. [DOI] [PubMed] [Google Scholar]
- 29. Akonur A, Guest S, Sloand JA, Leypoldt JK. Automated peritoneal dialysis prescriptions for enhancing sodium and fluid removal: a predictive analysis of optimized, patient-specific dwell times for the day dwell. Perit Dial Int 2013; 33:646–54. [DOI] [PMC free article] [PubMed] [Google Scholar]
- 30. Akonur A, Sloand J, Davis I, Leypoldt J. Icodextrin simplifies PD therapy by equalizing UF and sodium removal among patient transport types during long dwells: a modeling study. Perit Dial Int 2014. Epub ahead of print. [DOI] [PMC free article] [PubMed] [Google Scholar]
- 31. Watson PE, Watson ID, Batt RD. Total body water volumes for adult males and females estimated from simple anthropometric measurements. Am J Clin Nutr 1980; 33:27–39. [DOI] [PubMed] [Google Scholar]
- 32. Vonesh EF, Burkart J, McMurray SD, Williams PF. Peritoneal dialysis kinetic modeling: validation in a multicenter clinical study. Perit Dial Int 1996; 16:471–81. [PubMed] [Google Scholar]
- 33. Vonesh EF, Story KO, O'Neil WT, PD Adequest International Study Group A multinational clinical validation study of PD Adequest 2.0. Perit Dial Int 1999; 19:556–71. [PubMed] [Google Scholar]
- 34. Vonesh EF, Story KO, Douma CE, Krediet RT. Modeling of icodextrin in PD Adequest 2.0. Perit Dial Int 2006; 26: 475–81. [PubMed] [Google Scholar]
- 35. Clopper CJ, Pearson ES. The use of confidence or fiducial limits illustrated in the case of the binomial. Biometrika 1934; 26:404–13. [Google Scholar]
- 36. Newcombe RG. Two-sided confidence intervals for the single proportion: comparison of seven methods. Statist Med 1998; 17:857–72. [DOI] [PubMed] [Google Scholar]
- 37. Woodrow G. Volume status in peritoneal dialysis. Perit Dial Int 2011; 31(Suppl 2):S77–82. [DOI] [PubMed] [Google Scholar]
- 38. Weiner DE, Brunelli SM, Hunt A, Schiller B, Glassock R, Maddux FW, et al. Improving clinical outcomes among hemodialysis patients: a proposal for a “volume first” approach from the chief medical officers of US dialysis providers. Am J Kidney Dis 2014; 64:685–95. [DOI] [PubMed] [Google Scholar]
- 39. Rippe B, Stelin G, Haraldsson B. Computer simulations of peritoneal fluid transport in CAPD. Kidney Int 1991; 40:315–25. [DOI] [PubMed] [Google Scholar]
- 40. Davis I, Cizman B, Mundt K, Wu L, Childers R, Mell R, et al. Relationship between drain volume/fill volume ratio and clinical outcomes associated with overfill complaints in peritoneal dialysis patients. Perit Dial Int 2011; 31:148–53. [DOI] [PubMed] [Google Scholar]
- 41. Cizman B, Lindo S, Bilionis B, Davis I, Brown A, Miller J, et al. The occurrence of increased intraperitoneal volume events in automated peritoneal dialysis in the US: role of programming, patient/user actions and ultrafiltration. Perit Dial Int 2014; 34:434–42. [DOI] [PMC free article] [PubMed] [Google Scholar]
- 42. Konings CJ, Kooman JP, Gladziwa U, van der Sande FM, Leunissen KM. A decline in residual glomerular filtration during the use of icodextrin may be due to underhydration. Kidney Int 2005; 67:1190–1. [DOI] [PubMed] [Google Scholar]
- 43. Haraldsson B. Assessing the peritoneal dialysis capacities of individual patients. Kidney Int 1995; 47:1187–98. [DOI] [PubMed] [Google Scholar]
- 44. Cnossen TT, Smit W, Konings CJAM, Kooman JP, Leunissen KM, Krediet RT. Quantification of free water transport during the peritoneal equilibration test. Perit Dial Int 2009; 29:523–7. [PubMed] [Google Scholar]
- 45. Bernardo AP, Bajo MA, Santos O, del Peso G, Carvalho MJ, Cabrita A, Selgas R, Rodrigues A. Two-in-one protocol: simultaneous small-pore and ultrasmall-pore peritoneal transport quantification. Perit Dial Int 2012; 32:537–44. [DOI] [PMC free article] [PubMed] [Google Scholar]
- 46. Galach M, Antosiewicz S, Baczynski D, Wankowicz Z, Waniewski J. Sequential peritoneal equilibration test: a new method for assessment and modeling of peritoneal transport. Nephrol Dial Transplant 2013; 28:447–54. [DOI] [PubMed] [Google Scholar]
- 47. Coester AM, Smit W, Struijk DG, Parikova A, Krediet RT. Longitudinal analysis of peritoneal fluid transport and its determinants in a cohort of incident peritoneal dialysis patients. Perit Dial Int 2014; 34:195–203. [DOI] [PMC free article] [PubMed] [Google Scholar]
- 48. Amici G, Da Rin G, Bocci C. Icodextrin modeling error with PD Adequest, Version 2.0. Perit Dial Int 2001; 21:516–8. [PubMed] [Google Scholar]