
Figure 7.
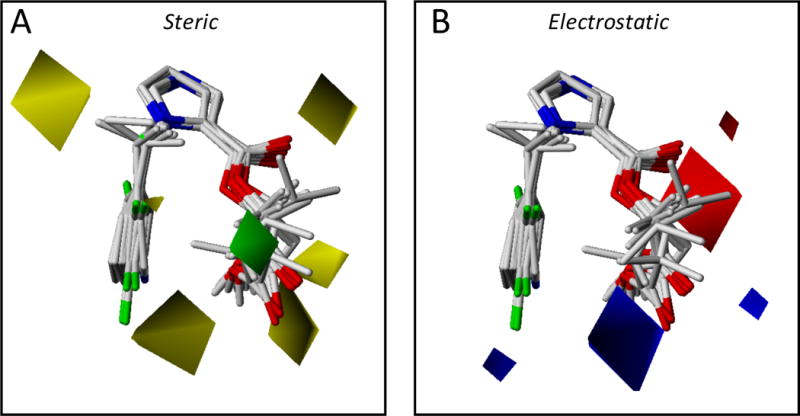
Alignment of etomidate and etomidate analogues and comparative molecular field analysis contour maps for direct activation of α1(L264T)β3γ2 γ-aminobutyric acid type A (GABAA) receptors. (A) Steric field contour map. The green contours represent regions where bulky substituents increase analogue potency whereas yellow contours represent regions where they decrease potency. (B) Electrostatic contour map. The blue contours represent regions where electropositive substituents increase analogue potency whereas red contours represent regions where electronegative substituents increase potency.