

Abstract
Purpose
To demonstrate a proof of concept that quantitative texture feature analysis of double contrast-enhanced magnetic resonance imaging (MRI) can classify fibrosis noninvasively, using histology as a reference standard.
Materials and Methods
A Health Insurance Portability and Accountability Act (HIPAA)-compliant Institutional Review Board (IRB)-approved retrospective study of 68 patients with diffuse liver disease was performed at a tertiary liver center. All patients underwent double contrast-enhanced MRI, with histopathology-based staging of fibrosis obtained within 12 months of imaging. The MaZda software program was used to compute 279 texture parameters for each image. A statistical regularization technique, generalized linear model (GLM)-path, was used to develop a model based on texture features for dichotomous classification of fibrosis category (F ≤2 vs. F ≥3) of the 68 patients, with histology as the reference standard. The model's performance was assessed and cross-validated. There was no additional validation performed on an independent cohort.
Results
Cross-validated sensitivity, specificity, and total accuracy of the texture feature model in classifying fibrosis were 91.9%, 83.9%, and 88.2%, respectively.
Conclusion
This study shows proof of concept that accurate, noninvasive classification of liver fibrosis is possible by applying quantitative texture analysis to double contrast-enhanced MRI. Further studies are needed in independent cohorts of subjects.
Keywords: hepatic fibrosis, double contrast-enhanced MRI, quantitative texture analysis, MaZda, GLM-path
Hepatic Fibrosis, the progressive deposition of collagen in the extracellular matrix of the liver, is a fundamental alteration of liver parenchyma in many chronic liver diseases. It impairs liver function, may lead to cirrhosis and hepatocellular carcinoma, and constitutes an important cause of morbidity, mortality, and health care costs (1–4). Early diagnosis is important to initiate treatment and halt progression. Biopsy is the current gold standard for diagnosis, but it is expensive and invasive—factors that limit utility in longitudinal assessments (5–16). The limitations of biopsy for longitudinal assessment have impeded progress in clinical care and research of diffuse liver diseases associated with hepatic fibrosis. There is a need to develop noninvasive imaging techniques that can safely diagnose fibrosis.
Conventional ultrasound, computed tomography, and magnetic resonance imaging (MRI) can assess gross liver morphology, or contour, to confirm cirrhosis in patients with advanced liver disease, but such an assessment is insensitive to the early stages of fibrosis and cirrhosis (6,17–19). An alternative imaging-based approach to evaluate hepatic fibrosis is to assess internal liver architecture, or texture. Texture can be defined as a complex visual pattern within an image that consists of simpler subpatterns with characteristic features (20). These features can be assessed objectively by quantitative texture analysis (TA).
Quantitative TA has been used to noninvasively classify the liver in a dichotomous fashion as normal or cirrhotic on unenhanced MR images (21,22). In a study with 13 healthy volunteers and 5 cirrhotic patients, quantitative TA of high spatial resolution T2-weighted images provided 100% sensitivity and specificity for discrimination between normal volunteers and cirrhotic patients (21).
In another study of 43 cirrhotic patients and 10 normal volunteers, quantitative TA on unenhanced T2-weighted MR images classified patients as cirrhotic or normal with a misclassification rate of 8% (22). Both studies used a publicly available, free software program (MaZda, v. 3.20, Instytut Elektroniki Politechnika, Lodza, Poland) to compute TA parameters from liver images and to generate multivariate predictive models from the parameters (23–25).
Because double contrast-enhanced MRI shows fibrosis with greater clarity than unenhanced imaging (26–30), we hypothesized that quantitative TA of double contrast-enhanced MRI may permit accurate dichotomous classification of fibrosis in clinical patients with a spectrum of fibrosis severity, not just discrimination between healthy volunteers versus patients with cirrhosis. The purpose of this pilot, retrospective study was to demonstrate proof of concept that noninvasive quantitative TA on double contrast-enhanced MR liver images can classify liver fibrosis dichotomously in clinical patients, using histology as the reference standard. We used the same software program used in prior studies (MaZda) to compute TA parameters and applied statistical techniques to develop classification models based on the TA parameters.
Materials and Methods
Design
This was a Health Insurance Portability and Accountability Act (HIPAA)-compliant, retrospective, cross-sectional pilot study performed at a single tertiary liver center. The Institutional Review Board approved the study and waived informed consent for data review.
Patients
The study sample consisted of 68 consecutive patients with diffuse liver disease who underwent double contrast-enhanced MRI for clinical care for evaluation of known or suspected liver nodules between January 2005 and June 2005, with histopathology obtained within 12 months of imaging as the reference standard. The January–June 2005 time period was selected for this retrospective study because double contrast-enhanced MR was performed routinely for clinical purposes in patients with diffuse liver disease at our center during this period.
Collection of Patient Information
A trained research assistant (A.C., 1 year experience) retrospectively reviewed radiology and pathology records to identify patients who met inclusion criteria. Information collected included: demographics; double contrast-enhanced MRI dates and indications; liver disease history, etiology, and risk factors; liver biopsy and/or transplantation dates; liver pathology and hepatitis viral serology results.
Reference Standard
Histopathology (percutaneous biopsy and/or liver explant) served as the reference standard. Percutaneous liver biopsies were done by one of two hepatologists (one with 20 years experience; one, TH, with 15 years experience). The right lobe of the liver was sampled with a 16G needle under ultrasound guidance. A single liver pathologist (13 years experience) judged all specimens diagnostically adequate. Blinded to imaging results, the pathologist staged the histological specimens for fibrosis using the Metavir system (31): F0, no fibrosis; F1, portal fibrosis without septa; F2, portal fibrosis with rare septa; F3, numerous septa without cirrhosis; F4, cirrhosis.
The five-point fibrosis stage was dichotomized into two fibrosis categories: F ≤2 (comprising F0, F1, and F2 stages) and F ≥3 (comprising F3 and F4 stages). Dichotomization was done in part because of the small numbers of patients with intermediate (Metavir F2 and F3) fibrosis stages and in part because dichotomous classification of no-to-moderate fibrosis (Metavir stage F ≤2) versus advanced fibrosis (Metavir stage F ≥3) is of clinical relevance. Patients with advanced fibrosis are at high risk of developing complications of diffuse liver disease (including portal hypertension, hepatocellular dysfunction, and hepatocellular carcinoma [HCC]) and usually require intense monitoring and intervention. By comparison, patients with no-to-moderate fibrosis (Metavir stage F ≤2) are at lower risk of developing complications of diffuse liver disease and usually do not require intense monitoring or intervention.
MRI Technique
Superparamagnetic iron oxide (SPIO) particles (Ferumoxides, Advanced Magnetics, Cambridge, MA, for Berlex Laboratories) were used in all patients. The SPIO particles were diluted in 1000 mL of 5% dextrose at a dose of 10 μmol/kg and infused intravenously through a 5-μm filter over 30 minutes while the patient was in a preparation room prior to scanning. Pre-SPIO images were not obtained. Thirty to 60 minutes after completion of infusion, patients were scanned supine with a torso phased-array surface coil centered over the liver, in a 1.5 T MR scanner (Magnetom Symphony, Siemens Medical Systems, Erlangen, Germany). SPIO-enhanced images were acquired during suspended respiration before and after injection of 0.1 mmol/kg of an extracellular gadolinium-based contrast agent (GBCA) (Gd-DTPA-BMEA, gadoversetamide, OptiMARK; Mallinckrodt, St. Louis, MO) at a rate of 2 mL/sec followed by a 20-mL saline chaser. Images acquired after the GBCA injection were considered double contrast-enhanced. One of the double contrast-enhanced sequences was an axial, breath-held 2D spoiled gradient echo acquisition (2D SPGR) acquired 3–5 minutes after GBCA injection. Only this 2D SPGR sequence was analyzed for this study. Parameters for this sequence included 8-mm slice thickness without interslice gaps; TR 80–140 msec, adjusted by the technologist to accommodate each patient's breath-hold capacity; TE 4.6 msec; matrix 256 × 256; flip angle 70°; rectangular field of view optimized for each patient's body habitus, range 20–32 × 34–42 cm). These parameters were selected because they permitted coverage of the entire liver in a single breath-hold of 20–25 seconds while providing reasonably high T1 weighting and moderate T2* weighting to exploit the T1- and T2*-shortening effects of GBCA and SPIO, respectively. Parallel imaging was not used.
Image Analysis
Image Selection
Without knowledge of clinical or histology information and without viewing any other images, a radiologist (C.S., a body MR attending with 9 years experience in liver MRI) retrospectively reviewed the aforementioned double contrast-enhanced spoiled gradient echo images in a random per-patient order on a 2048 × 2560 pixel resolution gray-scale picture archiving and communicating system (PACS) monitors (Agfa Healthcare IMPAX, Ridgefield Park, NJ) and selected three consecutive axial images through the center of the liver at the level of the right portal vein for quantitative TA Three images per patient were used to increase the number of regions of interest (ROIs) for computing TA parameters of the liver. Selected images were transferred offline for TA. Noise analysis was not performed.
Computation of TA Parameters
Using a standard desktop personal computer, an undergraduate research assistant (J.C., 1 month experience in liver imaging research laboratory, 2 hours of training with quantitative TA software) manually placed 3–15 ROIs measuring 2–3 cm2 on each of the three representative images selected per patient (total of 9–45 ROIs per patient) using MaZda (v. 3.2) software. The ROIs were placed in areas representative of liver texture while avoiding visible blood vessels, prominent artifacts, and liver margins. The number of ROIs varied among slices in the same patient and among patients depending on liver morphology.
MaZda (v. 3.2) was used to compute the following 279 TA features (23) for each ROI:
Nine first-order histogram features: these describe the histogram of the signal intensity values of pixels in the ROI and include the mean, variance, skewness, and kurtosis of the intensity values. These features mathematically summarize the signal intensity of pixels in the ROI. For example, the mean is the average intensity across the ROI, the variance is the variability in intensity, and the skewness and kurtosis describe the shape of the intensity distribution.
Five gradient-based histogram features: these describe the histogram of the absolute gradient values of 3 × 3 neighborhoods of pixels in the ROI and include the mean, variance, skewness, and kurtosis of the gradient values as well as the percentage of pixels with nonzero gradient values. These features mathematically summarize computed gradient values of pixels in the ROI rather than signal intensity. For example, the mean is the average gradient across the ROI, the variance is the variability in gradient, and the skewness and kurtosis describe the shape of the gradient distribution.
Twenty run-length matrix-based features: these describe the length, frequency, and uniformity of runs of similar pixel intensity values in different directions in the ROI, thereby summarizing homogeneity of signal intensity in specific directions of an image ROI.
Two hundred twenty co-occurrence matrix (or second-order histogram) features: these describe the joint probability of pixel pairs along all directions at different distances in the ROI. These features summarize a different aspect of homogeneity than in the previous item: changes in signal intensity with increasing distance in the ROI.
Five autoregressive model features: these describe the manner in which the signal intensity values of pixels can be modeled by the signal intensity values of neighboring pixels. These features summarize the pattern of signal intensity, as opposed to the random scatter of signal intensity in the ROI.
Twenty wavelet transform features: these describe the wavelet transform of the pixels in the ROI. In these transforms an image ROI is decomposed into a weighted sum of wavelet functions. These features summarize the frequency of similar signal intensities in the ROI.
A more detailed mathematical and physical explanation of these features is beyond the scope of this article but can be found in the MaZda documentation (23).
Statistical Analysis and Development of Prediction Models
A team of two biostatisticians (a senior level staff statistician, TW, under the supervision of a professor of statistics, AG., both with over 15 years of experience) performed the statistical analysis.
Patient characteristics were summarized descriptively. Male and female patient ages were compared using an unpaired Student's t-test.
Using the MaZda-computed TA features, a statistical model was developed for dichotomous classification of fibrosis category (F ≤2 vs. F ≥3) in our 68 patients with histology as the reference standard. Prior to the modeling, each TA feature was first averaged across ROIs for each subject, then standardized across subjects to equalize the features' scales. Since the number of ROIs was variable across patients, the number of ROIs per patient was entered into the model as a weight.
To construct the model based on TA features, the generalized linear model (GLM)-path algorithm (32) was applied to the 279 individual MaZda-computed features, using histology as the reference. GLM-path is an extension of the L1-regularization techniques LARS (33) and LASSO (34) to the GLM framework. Regularization techniques, such as GLM-path, are designed to identify optimal prediction models (35) from large high-dimensional sets of potential predictors. N optimal models are identified: the optimal single-predictor model is identified, then the optimal two-predictor model, then the optimal three-predictor model, …, and finally the optimal N-predictor model, where N is either the number of subjects or potential predictors, whichever is smaller. Ten-fold cross-validation then was used to construct unbiased, conservative estimates of the classification accuracy of the multiple prediction models identified by GLM-path. (Cross-validation is a power-saving alternative to the training set vs. validation set approach to adjusting naïvely estimated performance parameters (36), in which each subject's data gets a chance to “serve” as both training and validation data.) The model with the smallest number of predictors in the highest cross-validated predictive accuracy window was selected.
Results
Subjects
The 68 patients (mean age 53.8 years, range 28–79 years) included 50 men (mean age 54.3, range 39–75) and 18 women (mean age 53.7, range 28–79); men and women did not differ in age (P = 0.79). Thirty-one patients had histology fibrosis stage F ≤2 (16 F0, 11 F1, 4 F2) and 37 had histology fibrosis stage F ≥3 (4 F3, 33 F4). The etiology of liver disease was hepatitis C viral infection in 45 patients, hepatitis B viral infection in 10, alcohol consumption in four, nonalcoholic fatty liver disease in five, and cryptogenic in four.
Classification Model
Using the GLM-path algorithm, a seven-predictor model was selected as the model with the smallest number of predictors in the highest cross-validated predictive accuracy window, using the following equation:
where p is the probability of fibrosis and logit(p) = ln(p/(1-p)).
The seven TA predictors selected from the set of 279 contained three co-occurrence matrix parameters (S.0.1.SumVarnc, S.2.2.SumOfSqs, S.0.2.SumEntrp), an autoregressive parameter (Teta2), and three wavelet parameters (WavEnLL.s.5, WavEnLH.s.3, and WavEnHH.s.4). In the co-occurrence parameters the identifiers such as 0.1. indicate average distance between pixels in horizontal and vertical directions. SumVarnc refers to sum variance, SumOfSqs refers to sum of squares, and Entrp refers to entropy, one of the measures of uncertainty. In the wavelet parameters, the letters L and H refer to the low-pass and high-pass filters in the horizontal and/or vertical dimension (these are parameters indicating the amount of smoothing or blurring of images). The identifiers “s.3” and “s.4” refer to the scale of the decomposition. Further information about these variables can be found in the MaZda user's manual (23).
The model assigned to each patient predicted probability ranging from 0 to 1 of having F ≥3 fibrosis. Using a probability of 0.5 as the classification threshold, 29 patients were correctly classified as F ≤2, 34 patients correctly classified as F ≥3, two patients with histology-determined fibrosis stages F ≤2 (F1, F2) incorrectly classified as F ≥3, and three patients with histology-determined fibrosis stages F ≥3 (F3, F3, F4) incorrectly classified as F ≤2 (Fig. 1). Of the five misclassified subjects, three had probabilities within 0.04 of the 0.5 threshold. The raw classification accuracy, sensitivity, specificity, positive predictive value, and negative predictive value of the model ranged from 0.906 to 0.944 (Table 1). The cross-validated classification accuracy, sensitivity, specificity, positive predictive value, and negative predictive value of the model ranged from 0.839 to 0.919 (Table 2).
Figure 1.
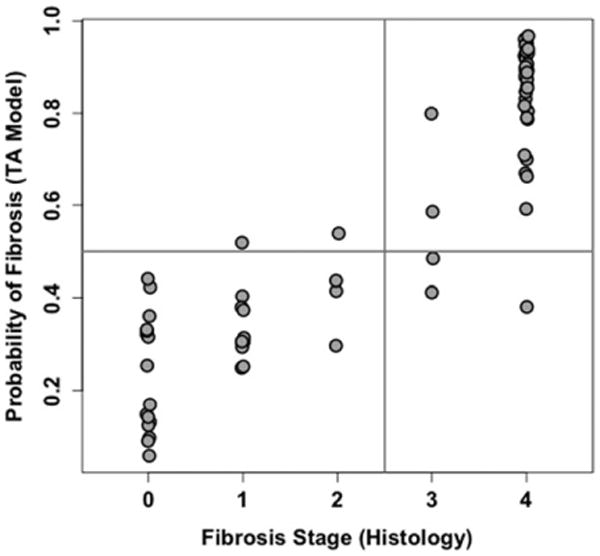
Model-estimated probability of dichotomized fibrosis plotted vs. actual histology-determined fibrosis stage for the final selected texture feature model. Horizontal line is drawn at estimated probability of fibrosis = 0.5. Vertical line separates absent or early stage fibrosis (F ≤2) from advanced fibrosis (F ≥3). As shown, five subjects are misclassified (two false-positive and three false-negative); MR images for the five subjects are shown in Fig. 3.
Table 1. Texture Feature-Based Classification Model: Raw Performance Parameters.
| Numerator | Denominator | Parameter | Lower bound 95% CL | Upper bound 95% CL | |
|---|---|---|---|---|---|
| Sensitivity | 34 | 37 | 0.919 | 0.781 | 0.983 |
| Specificity | 29 | 31 | 0.935 | 0.786 | 0.992 |
| PPV | 34 | 36 | 0.944 | 0.813 | 0.993 |
| NPV | 29 | 32 | 0.906 | 0.750 | 0.980 |
| Total accuracy | 63 | 68 | 0.926 | 0.837 | 0.976 |
The numerator and denominator for computing the raw (naïve) performance parameters are presented, as well as the lower and upper 95% binomial confidence limit (CL) around each parameter. PPV = Positive Predictive Value. NPV = Negative Predictive Value.
Table 2. Texture Feature-Based Classification Model: Cross-Validated Performance Parameters.
| Numerator | Denominator | Parameter | Lower bound 95% CL | Upper bound 95% CL | |
|---|---|---|---|---|---|
| Sensitivity | 34 | 37 | 0.919 | 0.781 | 0.983 |
| Specificity | 26 | 31 | 0.839 | 0.663 | 0.945 |
| PPV | 34 | 39 | 0.872 | 0.726 | 0.957 |
| NPV | 26 | 29 | 0.897 | 0.726 | 0.978 |
| Total Accuracy | 60 | 68 | 0.882 | 0.781 | 0.948 |
The numerator and denominator for computing the cross-validated performance parameters are presented, as well as the lower and upper 95% binomial confidence limit (CL) around each parameter. PPV = Positive Predictive Value. NPV = Negative Predictive Value. Compared to the raw parameters listed in Table 1, these cross-validated parameters more realistically assess how well the model would perform beyond the training dataset.
An example of five subjects correctly classified by the model (one from each histology-determined fibrosis stage) is shown in Fig. 2. The five subjects incorrectly classified by the model are shown in Fig. 3.
Figure 2.
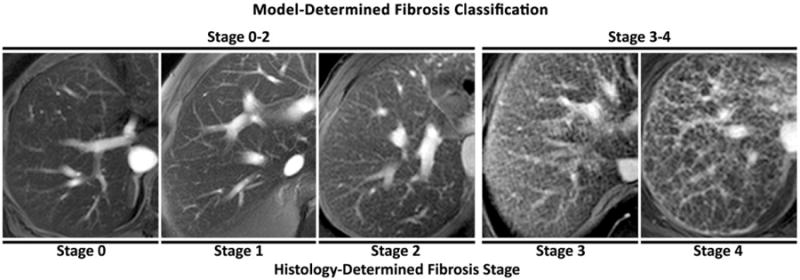
Five representative subjects classified correctly by the texture feature model. Histology-determined fibrosis stage of each subject is shown below the images. Model-estimated dichotomized fibrosis category (early stage fibrosis F ≤2 vs. advanced fibrosis F ≥3) is shown above the images.
Figure 3.
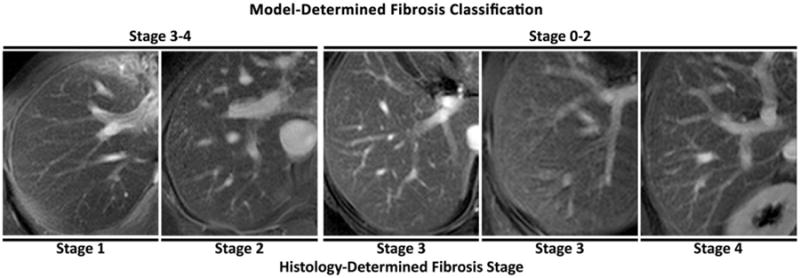
The five subjects classified incorrectly by the texture feature model. Histology-determined fibrosis stage of each subject is shown below the images. For the two misclassifications in the F = 3 category, the subject on the left is closer to the P = 0.5 probability threshold than the subject on the right. Model-estimated dichotomized fibrosis category (early stage fibrosis F ≤2 vs. advanced fibrosis F ≥3) is shown above the images.
Discussion
There is need for noninvasive imaging methods to assess hepatic fibrosis. Such methods would advance clinical care and research in patients with diffuse liver disease by facilitating 1) early diagnosis and intervention, 2) disease monitoring and clinical decision-making, 3) identification and evaluation of new therapies, and 4) large-scale epidemiology and natural history studies. Biopsy, the current clinical gold standard for liver fibrosis (2,3,37–39), has limitations. Biopsy is invasive, impractical for repeated measurements, and unsuitable for population-based studies or clinical trials requiring frequent hepatic assessments. Serum biomarkers for liver fibrosis (3,40,41) have been described, but their clinical efficacy has not been proven. Conventional cross-sectional imaging modalities can identify advanced cirrhosis based on morphologic changes of the liver (37,42–44) or secondary signs of portal hypertension (18,19,37,40,41,43). Such imaging findings have limited utility in detection of early fibrosis and in staging of fibrosis. New imaging techniques that measure hepatic blood flow (17), water diffusion (45), or liver stiffness (46–49) for diagnosis and staging of fibrosis have been proposed. While these new techniques show great promise, a potential shortcoming is that they measure indirect markers of fibrosis rather than directly assess the architectural alterations of hepatic fibrosis.
A fundamentally different approach, which more directly assesses architectural alterations of fibrosis, is TA of liver parenchyma using conventional MR sequences and computer-assisted quantitative techniques. In this study we demonstrated proof of concept that noninvasive quantitative TA of double contrast-enhanced MR liver images can classify hepatic fibrosis in clinical patients, using histopathology as the reference standard. We developed and tested a seven-predictor individual TA feature-based model, which had a cross-validated classification accuracy rate of 88.2%. Expertise is not required for the image analysis; in this study, an undergraduate research assistant with limited training placed the ROIs from which the individual texture features were extracted automatically by the TA software.
Prior investigators used TA of unenhanced MR images to classify liver in a binary fashion as normal or cirrhotic (21,22). Unlike prior studies, which used normal volunteers, a strength of our study is that we relied exclusively on a clinical patient cohort. Normal volunteers may have higher degrees of compliance with imaging instructions, which may not accurately represent clinical practice. Moreover, healthy volunteers and cirrhotic patients represent opposite ends of the histopathological spectrum; differentiation between groups at opposite ends of the spectrum is simpler than differentiation between patients spanning the spectrum and may have more limited clinical relevance. For histopathology staging of fibrosis, we used the Metavir score, which has greater inter- and intraobserver concordance compared to other histopathology scoring methods (3,17,38,42,50), and we also relied on a single experienced hepatopathologist to evaluate all histology specimens.
We focused on double contrast-enhanced MRI, in which SPIOs and an extracellular GBCA are administered sequentially, based on prior studies suggesting synergistic effects of GBCA and SPIO for visualizing fibrosis (26,28). SPIOs and extracellular GBCAs improve the visibility of fibrosis by different mechanisms (26,28); SPIOs preferentially accumulate in nonfibrotic liver parenchyma and cause signal loss (T2* shortening), whereas extracellular GBCAs preferentially accumulate on delayed images in fibrotic tissue and cause signal enhancement (T1 shortening). Individually, each agent is of limited efficacy but, in combination, the two agents depict liver fibrosis with high clarity as a meshwork of high-signal reticulations superimposed on low-signal liver tissue. While our study focused on double contrast-enhanced imaging, our study was intended as proof of concept, and a TA approach could be extended to other contrast agents or contrast agent combinations in the future.
A limitation of our study was its retrospective design. Patients had diffuse liver disease of various etiologies; as the histopathological alterations of diffuse liver disease depend on the etiology of disease, studies focusing on patients with single etiologies are needed. In addition, many patients had advanced fibrosis (F4), while the number of patients with F2 and F3 histology-determined fibrosis stages was small. Further studies that include a larger number of patients with intermediate stages of fibrosis are needed. We used cross-validation to construct unbiased, conservative estimates of the classification performance parameters. Although cross-validation permits a good assessment of how our selected model would perform beyond the dataset on which it was derived (36), this and subsequent studies would still benefit from validation on an independent set of subjects, and the results of the present study should be interpreted as preliminary. As this was a proof-of-concept study, we did not directly compare TA of double contrast-enhanced MR images with TA of single contrast-enhanced or unenhanced MR images or with other experimental noninvasive methods for fibrosis assessment such as MR elastography or diffusion-weighted imaging. Future comparative studies are needed. We also did not assess inter- or intraobserver variability, and such analyses are required. The imaging technique used in this study was a routine clinical sequence designed for assessment of focal liver lesions not fibrosis; it is possible that a sequence with higher spatial resolution, with a larger matrix and thinner slices and greater T2* weighting would be more optimal for fibrosis assessment. A longer TE sequence with increased T2* weighting, for example, may have increased the effects of SPIOs and possibly improved the classification accuracy of the TA, but such a sequence was not performed for clinical care during the study period and thus was not part of our study. Another limitation was the use of phased array coils, which may have caused TA alterations due to signal-intensity inhomogeneity within and between the ROIs. However, the use of these coils was necessary to provide adequate signal-to-noise ratio. In future studies, it may be necessary to normalize the signal across the ROIs to reduce coil-related signal inhomogeneity. The time interval between histology and imaging (up to 12 months) may have modified the relationship between TA and fibrosis, since changes might have occurred in the interim. Our retrospective, pilot study did not include normal controls; the inclusion of normal controls will require a prospective design. Another potential limitation of our study is the use of texture features predetermined by a publicly available software program rather than developing and customizing our own texture features. Nevertheless, this study supports the concept that a set of texture features can be identified to accurately classify fibrosis. A final and perhaps most important limitation is that SPIOs are no longer clinically available. While the exact imaging technique described in this study may no longer be possible, this article describes a general methodological TA approach to fibrosis classification, which can be applied in future studies to images acquired with currently available contrast agents, including extracellular or hepatobiliary GBCAs.
In conclusion, our study demonstrates proof of concept that noninvasive dichotomous classification of liver fibrosis is possible by applying quantitative TA to double contrast-enhanced MRI. While the specific technique described here is no longer possible due to lack of availability of SPIOs, this general approach could in principle be applied to single-contrast studies; however, further studies would be needed. Optimization of MRI parameters, further development of TA, application of TA to single contrast-enhanced MR images, validation studies in patients with milder fibrosis, and comparative studies of different noninvasive approaches are needed.
Acknowledgments
Contract grant sponsor: San Diego EXPORT Center, National Center of Minority Health and Health Disparities; Contract grant number: P60 MD00220l; Contract grant sponsor: RSNA Research and Education Foundation for a Medical Student Grant (to G.B.).
References
- 1.Trends in mortality from cirrhosis and alcoholism—United States, 1945–1983. MMWR Morb Mortal Wkly Rep. 1986;35:703–705. [PubMed] [Google Scholar]
- 2.Afdhal NH. Biopsy or biomarkers: is there a gold standard for diagnosis of liver fibrosis? Clin Chem. 2004;50:1299–1300. doi: 10.1373/clinchem.2004.035899. [DOI] [PubMed] [Google Scholar]
- 3.Afdhal NH, Nunes D. Evaluation of liver fibrosis: a concise review. Am J Gastroenterol. 2004;99:1160–1174. doi: 10.1111/j.1572-0241.2004.30110.x. [DOI] [PubMed] [Google Scholar]
- 4.Talwalkar JA, Kim WR. Medical and economic impact of autoimmune hepatitis. Clin Liver Dis. 2002;6:649–667. doi: 10.1016/s1089-3261(02)00030-2. [DOI] [PubMed] [Google Scholar]
- 5.Little AF, Ferris JV, Dodd GD, 3rd, Baron RL. Image-guided percutaneous hepatic biopsy: effect of ascites on the complication rate. Radiology. 1996;199:79–83. doi: 10.1148/radiology.199.1.8633176. [DOI] [PubMed] [Google Scholar]
- 6.Angelucci E, Baronciani D, Lucarelli G, et al. Needle liver biopsy in thalassaemia: analyses of diagnostic accuracy and safety in 1184 consecutive biopsies. Br J Haematol. 1995;89:757–761. doi: 10.1111/j.1365-2141.1995.tb08412.x. [DOI] [PubMed] [Google Scholar]
- 7.Bruguera M, Bordas JM, Mas P, Rodes J. A comparison of the accuracy of peritoneoscopy and liver biopsy in the diagnosis of cirrhosis. Gut. 1974;15:799–800. doi: 10.1136/gut.15.10.799. [DOI] [PMC free article] [PubMed] [Google Scholar]
- 8.Froehlich F, Lamy O, Fried M, Gonvers JJ. Practice and complications of liver biopsy. Results of a nationwide survey in Switzerland. Dig Dis Sci. 1993;38:1480–1484. doi: 10.1007/BF01308607. [DOI] [PubMed] [Google Scholar]
- 9.Lindor KD, Bru C, Jorgensen RA, et al. The role of ultrasonography and automatic-needle biopsy in outpatient percutaneous liver biopsy. Hepatology. 1996;23:1079–1083. doi: 10.1002/hep.510230522. [DOI] [PubMed] [Google Scholar]
- 10.Maharaj B, Maharaj RJ, Leary WP, et al. Sampling variability and its influence on the diagnostic yield of percutaneous needle biopsy of the liver. Lancet. 1986;1:523–525. doi: 10.1016/s0140-6736(86)90883-4. [DOI] [PubMed] [Google Scholar]
- 11.Olsson R, Hagerstrand I, Broome U, et al. Sampling variability of percutaneous liver biopsy in primary sclerosing cholangitis. J Clin Pathol. 1995;48:933–935. doi: 10.1136/jcp.48.10.933. [DOI] [PMC free article] [PubMed] [Google Scholar]
- 12.Pagliaro L, Rinaldi F, Craxi A, et al. Percutaneous blind biopsy versus laparoscopy with guided biopsy in diagnosis of cirrhosis. A prospective, randomized trial. Dig Dis Sci. 1983;28:39–43. doi: 10.1007/BF01393359. [DOI] [PubMed] [Google Scholar]
- 13.Perrault J, McGill DB, Ott BJ, Taylor WF. Liver biopsy: complications in 1000 inpatients and outpatients. Gastroenterology. 1978;74:103–106. [PubMed] [Google Scholar]
- 14.Poniachik J, Bernstein DE, Reddy KR, et al. The role of laparoscopy in the diagnosis of cirrhosis. Gastrointest Endosc. 1996;43:568–571. doi: 10.1016/s0016-5107(96)70192-x. [DOI] [PubMed] [Google Scholar]
- 15.Terjung B, Lemnitzer I, Dumoulin FL, et al. Bleeding complications after percutaneous liver biopsy. An analysis of risk factors Digestion. 2003;67:138–145. doi: 10.1159/000071293. [DOI] [PubMed] [Google Scholar]
- 16.Thampanitchawong P, Piratvisuth T. Liver biopsy: complications and risk factors. World J Gastroenterol. 1999;5:301–304. doi: 10.3748/wjg.v5.i4.301. [DOI] [PMC free article] [PubMed] [Google Scholar]
- 17.Annet L, Materne R, Danse E, Jamart J, Horsmans Y, Van Beers BE. Hepatic flow parameters measured with MR imaging and Doppler US: correlations with degree of cirrhosis and portal hypertension. Radiology. 2003;229:409–414. doi: 10.1148/radiol.2292021128. [DOI] [PubMed] [Google Scholar]
- 18.Awaya H, Mitchell DG, Kamishima T, Holland G, Ito K, Matsumoto T. Cirrhosis: modified caudate-right lobe ratio. Radiology. 2002;224:769–774. doi: 10.1148/radiol.2243011495. [DOI] [PubMed] [Google Scholar]
- 19.Ito K, Mitchell DG, Hann HW, et al. Viral-induced cirrhosis: grading of severity using MR imaging. AJR Am J Roentgenol. 1999;173:591–596. doi: 10.2214/ajr.173.3.10470885. [DOI] [PubMed] [Google Scholar]
- 20.Materka A, Strzelecki M. Texture analysis methods—a review. Technical University of Lodz, Institute of Electronics; Brussels: 1998. COST B11 report. [Google Scholar]
- 21.Hollingsworth KG, Lomas DJ. Proc 13th Annual Meeting ISMRM. Miami Beach; 2005. Liver texture analysis: robustness of measurement in cirrhotic patients and healthy volunteers. abstract 332. [Google Scholar]
- 22.Jirak D, Dezortova M, Taimr P, Hajek M. Texture analysis of human liver. J Magn Reson Imaging. 2002;15:68–74. doi: 10.1002/jmri.10042. [DOI] [PubMed] [Google Scholar]
- 23.Materka A. Mazda user's manual. Available at: http://www.eletel.p.lodz.pl/programy/mazda/download/mazda_manual.pdf.
- 24.Szczypinski PM, Strzelecki M, Materka A, Klepaczko A. MaZda—a software package for image texture analysis. Comput Methods Programs Biomed. 2009;94:66–76. doi: 10.1016/j.cmpb.2008.08.005. [DOI] [PubMed] [Google Scholar]
- 25.Szczypinski PM, Strzelecki M, Materka A. Proc ISITC. Republic of Korea; 2007. MaZda—a software package for texture analysis; pp. 245–249. [Google Scholar]
- 26.Aguirre DA, Behling CA, Alpert E, Sirlin CB. Liver fibrosis: noninvasive diagnosis with double contrast material-enhanced MR imaging. Radiology. 2006;239:425–437. doi: 10.1148/radiol.2392050505. [DOI] [PubMed] [Google Scholar]
- 27.Elizondo G, Weissleder R, Stark DD, et al. Hepatic cirrhosis and hepatitis: MR imaging enhanced with superparamagnetic iron oxide. Radiology. 1990;174:797–801. doi: 10.1148/radiology.174.3.2305063. [DOI] [PubMed] [Google Scholar]
- 28.Hughes-Cassidy F, Chavez AD, Schlang A, et al. Superparamagnetic iron oxides and low molecular weight gadolinium chelates are synergistic for direct visualization of advanced liver fibrosis. J Magn Reson Imaging. 2007;26:728–737. doi: 10.1002/jmri.21066. [DOI] [PubMed] [Google Scholar]
- 29.Lucidarme O, Baleston F, Cadi M, et al. Non-invasive detection of liver fibrosis: is superparamagnetic iron oxide particle-enhanced MR imaging a contributive technique? Eur Radiol. 2003;13:467–474. doi: 10.1007/s00330-002-1667-9. [DOI] [PubMed] [Google Scholar]
- 30.Semelka RC, Chung JJ, Hussain SM, Marcos HB, Woosley JT. Chronic hepatitis: correlation of early patchy and late linear enhancement patterns on gadolinium-enhanced MR images with histopathology initial experience. J Magn Reson Imaging. 2001;13:385–391. doi: 10.1002/jmri.1055. [DOI] [PubMed] [Google Scholar]
- 31.Poynard T, Bedossa P, Opolon P. Natural history of liver fibrosis progression in patients with chronic hepatitis C. The OBSVIRC, METAVIR, CLINIVIR, and DOSVIRC groups. Lancet. 1997;349:825–832. doi: 10.1016/s0140-6736(96)07642-8. [DOI] [PubMed] [Google Scholar]
- 32.Park MY, Hastie T. L1-regularization path algorithm for generalized linear models. J R Stat Soc Ser B. 2007;69:659–677. [Google Scholar]
- 33.Efron B, Hastie T, Johnstone I, Tibshirani R. Least angle regression. Ann Stat. 2004;32:407–499. [Google Scholar]
- 34.Tibshirani R. Regression shrinkage and selection via the lasso. J R Stat Soc Ser B. 1996;58:267–288. [Google Scholar]
- 35.Copas J. Prediction and shrinkage. J R Stat Soc Ser B. 1983;45:311–354. [Google Scholar]
- 36.Efron B. The estimation of prediction error. J Am Stat Assoc. 2004;99:619–632. [Google Scholar]
- 37.Colli A, Fraquelli M, Andreoletti M, Marino B, Zuccoli E, Conte D. Severe liver fibrosis or cirrhosis: accuracy of US for detection—analysis of 300 cases. Radiology. 2003;227:89–94. doi: 10.1148/radiol.2272020193. [DOI] [PubMed] [Google Scholar]
- 38.Talwalkar JA. Economic impact of hospitalization for end-stage liver disease. Am J Gastroenterol. 2002;97:1562. doi: 10.1111/j.1572-0241.2002.05745.x. author reply 1562–1563. [DOI] [PubMed] [Google Scholar]
- 39.Tanimoto A, Yuasa Y, Shinmoto H, et al. Superparamagnetic iron oxide-mediated hepatic signal intensity change in patients with and without cirrhosis: pulse sequence effects and Kupffer cell function. Radiology. 2002;222:661–666. doi: 10.1148/radiol.2223010690. [DOI] [PubMed] [Google Scholar]
- 40.Imbert-Bismut F, Ratziu V, Pieroni L, et al. Biochemical markers of liver fibrosis in patients with hepatitis C virus infection: a prospective study. Lancet. 2001;357:1069–1075. doi: 10.1016/S0140-6736(00)04258-6. [DOI] [PubMed] [Google Scholar]
- 41.Lu LG, Zeng MD, Wan MB, et al. Grading and staging of hepatic fibrosis, and its relationship with noninvasive diagnostic parameters. World J Gastroenterol. 2003;9:2574–2578. doi: 10.3748/wjg.v9.i11.2574. [DOI] [PMC free article] [PubMed] [Google Scholar]
- 42.Di Lelio A, Cestari C, Lomazzi A, Beretta L. Cirrhosis: diagnosis with sonographic study of the liver surface. Radiology. 1989;172:389–392. doi: 10.1148/radiology.172.2.2526349. [DOI] [PubMed] [Google Scholar]
- 43.Hussain HK, Syed I, Nghiem HV, et al. T2-weighted MR imaging in the assessment of cirrhotic liver. Radiology. 2004;230:637–644. doi: 10.1148/radiol.2303020921. [DOI] [PubMed] [Google Scholar]
- 44.Ito K, Mitchell DG, Gabata T, Hussain SM. Expanded gallbladder fossa: simple MR imaging sign of cirrhosis. Radiology. 1999;211:723–726. doi: 10.1148/radiology.211.3.r99ma31723. [DOI] [PubMed] [Google Scholar]
- 45.Taouli B, Tolia AJ, Losada M, et al. Diffusion-weighted MRI for quantification of liver fibrosis: preliminary experience. AJR Am J Roentgenol. 2007;189:799–806. doi: 10.2214/AJR.07.2086. [DOI] [PubMed] [Google Scholar]
- 46.Tsochatzis EA, Gurusamy KS, Ntaoula S, Cholongitas E, Davidson BR, Burroughs AK. Elastography for the diagnosis of severity of fibrosis in chronic liver disease: a meta-analysis of diagnostic accuracy. J Hepatol. 2010;54:650–659. doi: 10.1016/j.jhep.2010.07.033. [DOI] [PubMed] [Google Scholar]
- 47.Huwart L, Salameh N, ter Beek L, et al. MR elastography of liver fibrosis: preliminary results comparing spin-echo and echo-planar imaging. Eur Radiol. 2008;18:2535–2541. doi: 10.1007/s00330-008-1051-5. [DOI] [PubMed] [Google Scholar]
- 48.Rouviere O, Yin M, Dresner MA, et al. MR elastography of the liver: preliminary results. Radiology. 2006;240:440–448. doi: 10.1148/radiol.2402050606. [DOI] [PubMed] [Google Scholar]
- 49.Yin M, Talwalkar JA, Glaser KJ, et al. Assessment of hepatic fibrosis with magnetic resonance elastography. Clin Gastroenterol Hepatol. 2007;5:1207–1213. doi: 10.1016/j.cgh.2007.06.012. [DOI] [PMC free article] [PubMed] [Google Scholar]
- 50.Intraobserver and interobserver variations in liver biopsy interpretation in patients with chronic hepatitis C. The French METAVIR Cooperative Study Group. Hepatology. 1994;20:15–20. [PubMed] [Google Scholar]