Abstract
Purpose
To evaluate magnetic resonance imaging (MRI)-determined proton density fat fraction (PDFF) reproducibility across two MR scanner platforms and, using MR spectroscopy (MRS)-determined PDFF as reference standard, to confirm MRI-determined PDFF estimation accuracy.
Materials and Methods
This prospective, cross-sectional, crossover, observational pilot study was approved by an Institutional Review Board. Twenty-one subjects gave written informed consent and underwent liver MRI and MRS at both 1.5T (Siemens Symphony scanner) and 3T (GE Signa Excite HD scanner). MRI-determined PDFF was estimated using an axial 2D spoiled gradient-recalled echo sequence with low flip-angle to minimize T1 bias and six echo-times to permit correction of T2* and fat-water signal interference effects. MRS-determined PDFF was estimated using a stimulated-echo acquisition mode sequence with long repetition time to minimize T1 bias and five echo times to permit T2 correction. Interscanner reproducibility of MRI determined PDFF was assessed by correlation analysis; accuracy was assessed separately at each field strength by linear regression analysis using MRS-determined PDFF as reference standard.
Results
1.5T and 3T MRI-determined PDFF estimates were highly correlated (r = 0.992). MRI-determined PDFF estimates were accurate at both 1.5T (regression slope/intercept = 0.958/−0.48) and 3T (slope/intercept = 1.020/0.925) against the MRS-determined PDFF reference.
Conclusion
MRI-determined PDFF estimation is reproducible and, using MRS-determined PDFF as reference standard, accurate across two MR scanner platforms at 1.5T and 3T.
Keywords: MR imaging-based fat quantification, hepatic steatosis, proton density fat fraction, PDFF, MR spectroscopy, MRS, chemical shift imaging, CSI
NONALCOHOLIC FATTY LIVER DISEASE (NAFLD) is the most common chronic liver disease in the United States (1,2). NAFLD can progress to cirrhosis and contribute to the development of cardiovascular disease, diabetes, and hepatocellular carcinoma (3). The inciting pathogenic process and histological hallmark of NAFLD is steatosis, the excessive accumulation of fat within hepatocytes (3–5), mainly as triglycerides. Steatosis is reversible and with early detection and intervention, progression to irreversible liver damage and other long-term NAFLD complications may be prevented (6,7).
The current clinical gold standard for diagnosis and monitoring of steatosis is liver biopsy with histological analysis of intrahepatocellular fat accumulation (8). Due to its expense and invasiveness, however, liver biopsy is impractical for screening and repeated measurements, which has hindered progress in clinical care and research of NAFLD. An accurate noninvasive method to quantify liver fat content is needed.
To address this need, advanced magnitude-based (9) and complex-based (10) chemical shift magnetic resonance imaging (MRI) fat quantification techniques have been developed to estimate liver proton density fat fraction (PDFF, defined as the proportion of mobile proton density in liver tissue attributable to fat) as a noninvasive biomarker of liver fat content (11–18). These techniques use low flip angle (relative to repetition time) to minimize T1 bias (16,19,20), acquire multiple echoes per excitation to permit correction for T2* effects (9,19,21), and address the multifrequency interference effects of fat (9,10). They quantify liver fat more accurately than conventional two-point Dixon methods (9) and in prior single-site single-scanner studies have shown high accuracy and repeatability for PDFF estimation using colocalized MR spectroscopy (MRS) as the reference standard (9,22,23). These techniques are also rapid and can evaluate the whole liver in a single breath-hold, offering important advantages over spectroscopy, which is restricted in spatial coverage and is more time-consuming.
To validate MRI-determined PDFF as a biomarker for liver fat content, its reproducibility using these advanced MRI techniques must be demonstrated, in addition to accuracy and repeatability. For an MRI-based biomarker, reproducibility refers to the closeness in agreement between a series of measurements obtained from the same subject scanned under different conditions (eg, different scanners, different field strengths). The reproducibility of MRI-determined PDFF using the advanced MRI techniques has not been formally assessed—a gap in knowledge that needs to be filled before widespread clinical or research application of these techniques.
To this end, we performed a prospective pilot study to assess the reproducibility of MRI-determined PDFF as a biomarker for liver fat content in human subjects. Our primary aim was to evaluate reproducibility on two scanners of different field strengths from different vendors. Our secondary aim was to confirm, using MRS-determined PDFF as reference standard, the high accuracy of MRI-determined PDFF at 1.5T and at 3T as reported previously. A magnitude-based MRI technique was used to measure MRI-determined PDFF.
MATERIALS AND METHODS
Overview and Study Population
This prospective, cross-sectional, crossover, observational pilot study was compliant with the Health Insurance Portability and Accountability Act and approved by an Institutional Review Board. From March 2008 to November 2009, 21 subjects were enrolled, including children and adults. For pediatric subjects we obtained written assent from the subject and parental written consent. Adult subjects gave informed written consent. No special requirements were made by the board with respect to the examination of children. Subjects were referred by hepatologists and surgeons or were self-referred in response to informational flyers posted at our institution. Inclusion criteria were 1) children >10 years old and adults with histology-confirmed NAFLD, 2) adults with risk factors for NAFLD (overweight, obese, family history of NAFLD) (1–3), and 3) healthy adult volunteers. These criteria permitted enrollment of subjects with a wide range of steatosis. Age, biological sex, and body mass index (BMI) were recorded.
Research Design
Subjects had two liver MR exams—one on a 1.5T Siemens and one on a 3T GE scanner—on the same day without contrast agents in a crossover design. Subjects were instructed to fast. The time interval from the end of the first exam to the start of the second exam was recorded. In each examination, hepatic PDFF was measured using a magnitude-based MRI technique and MRS. MRI and MRS parameters were adjusted as appropriate for PDFF estimation at each field strength (9,22). The order of scanning on 1.5T and on 3T was based on scanner availability.
MR Scanners
The two scanners used in the study were a 1.5T Siemens scanner (Magnetom Symphony, Siemens Healthcare, Erlangen, Germany) using a 4-element torso phased array coil, and a 3T General Electric scanner (Signa Excite HD, GE Healthcare, Milwaukee, WI) using an 8-element torso phased array coil. These two scanners were selected because they are in close proximity to each other within the same medical facility. For brevity, we will refer to the 1.5T Siemens Symphony scanner as the 1.5T scanner, and to the 3T GE Excite HD scanner as the 3T scanner.
MR Exams
Subject Preparation and Positioning
Subjects were instructed to fast for at least 2 hours before MR exams. They were scanned supine with a torso phased-array coil centered over the abdomen at the level of the liver. A dielectric pad was placed between the coil and the abdominal wall for 3T exams to reduce B1-heterogeneity artifacts; the pad was not considered necessary at 1.5T and so was not used for the 1.5T examinations.
MRI Acquisition Technique
Multislice axial magnitude MR images were acquired using a 2D spoiled gradient-recalled echo (SGRE) sequence. To minimize T1 bias, a low flip angle (10°) was used with a 120–150 msec repetition time (TR) (1.5T scanner), or a 125–240 msec TR (3T scanner). TRs were set to accommodate the patient’s breath-hold capacity; over the range of TRs used, T1 bias is negligible and differences in T1 weighting are negligible (9,19). To permit correction of fat-water signal interference and T2* effects, six sequential nominally out-of-phase and in-phase echoes were obtained in a single breath-hold of ≈20 seconds with echo-times (TEs) of 2.30, 4.60, 6.90, 9.20, 11.50, and 13.80 msec (1.5T scanner), or 1.15, 2.30, 3.45, 4.60, 5.75, and 6.90 msec (3T scanner). In-plane resolution was 256 × 192 (1.5T scanner) or 192 × 192 (3T scanner). Bandwidth was set to 500 Hz/pixel (1.5T scanner) or 1490 Hz/pixel (3T scanner). Other imaging parameters were 8-mm slice thickness, 20 recorded slices, 0%-interslice gap, one signal average, and rectangular field-of-view adjusted to individual body habitus and breath-hold capacity.
MRS Acquisition Technique
Using three-plane localizing images and avoiding major vessels, bile ducts, lesions, and artifacts, a single 20 × 20 × 20 mm3 voxel was placed in Couinaud segment V or VIII of the right lobe of the liver. No attempt was made to colocalize the MRS voxels on the two scanners, as reliable colocalization of MRS voxels across scanners is difficult and was not relevant to the primary aim of the study. After automatic shimming, single-voxel proton spectroscopy was performed using a stimulated-echo acquisition mode (STEAM) sequence. To minimize T1 bias, TR was set to 3000 msec (1.5T scanner) and 3500 msec (3T scanner), with a minimum mixing time (TM) of 10 msec at 1.5T and 5 msec at 3T. Following a single preacquisition excitation pulse (to avoid T1 saturation effects for subsequent excitations), five STEAM spectra were acquired at equally spaced TEs between 20 and 60 msec (1.5T scanner), and between 10 and 30 msec (3T scanner) in a single 18-second (1.5T scanner) or 21-second (3T scanner) breath-hold. The range of echo-times for each scanner was selected to allow robust T2 correction with minimal confounding from J-coupling (9,22,24,25).
MR Data Analysis
MRI-Determined PDFF
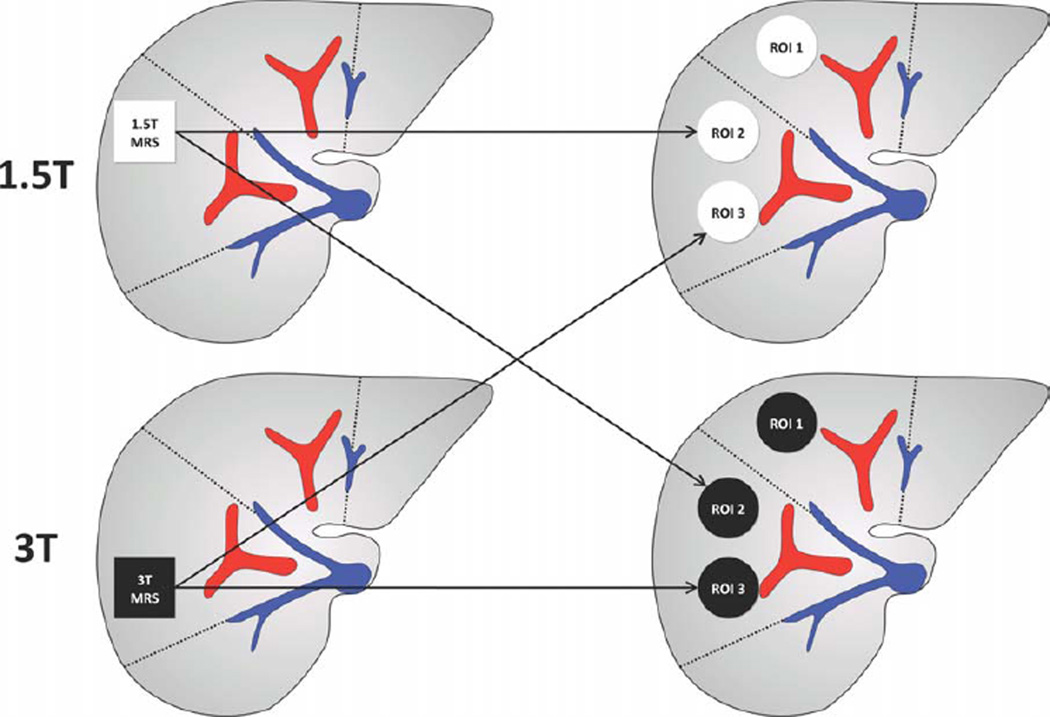
MR images were transferred to a Picture Archiving and Communication System (PACS) workstation for analysis. Blinded to MRS-determined PDFF measurements, a trained research fellow (3 years experience) manually placed three regions of interest (ROIs), of ≈300–400 mm2 area, on the MR images, avoiding vessels, bile ducts, lesions, and artifacts. One ROI was placed at the location of the 1.5T MRS voxel and one at the location of the 3T MRS voxel (Fig. 1). A third ROI was placed in the left lobe of the liver, usually in segment IV. For each subject, ROIs were placed on the source images that best depicted hepatic vascular anatomy (usually the image acquired at the fifth TE; 11.5 msec for images acquired on the 1.5T scanner, and 5.75 msec for those acquired on the 3T scanner). Then the ROIs were propagated across the multiecho images using PACS software. The mean signal intensities from each ROI at each TE were manually recorded and entered into a spreadsheet. Using a custom-developed algorithm written in MatLab (Math-Works, Natick, MA), MRI-determined PDFF was calculated at each ROI location. The algorithm modeled the mean signal intensity in each ROI as a function of TE assuming exponential decay using nonlinear least-square fitting. The multifrequency interference effects were addressed using a 5-peak fat spectral model (0.9, 1.3, 2.1, 4.2, 5.3 ppm) with normalized weights (0.05, 0.04, 0.12, 0.70, 0.09) derived from MR spectra in human subjects with known fatty liver (22,26). The algorithm computed the relative PDs of fat and water in each ROI, from which the MRI-determined PDFF was calculated (ratio of fat PD to total [fat and water] PD). T1 effects were assumed negligible at the acquired TRs and flip angles (9,22). For illustrative purposes, PDFF parametric maps were generated by applying the algorithm pixel-by-pixel to the source images.
Figure 1.
Location of MRS voxels and MRI ROIs. The research design for this pilot study is summarized. Twenty-one subjects underwent two MR exams— one on a 1.5T Siemens scanner and one on a 3T GE scanner—in a crossover design, with time interval range between exams as shown. The order of exams was based on scanner availability: six subjects had 1.5T exams first, and 15 had 3T exams first. The PDFF was estimated using MRI and MRS data acquired in each exam.
MRS-Determined PDFF
An MR physicist (8 years experience), blinded to MRI-determined PDFF estimates, analyzed the MR spectra using an advanced method for accurate, robust, and efficient spectral (AMARES) fitting included in Java-based magnetic resonance user interface (JMRUI) software (http://sermn02.uab.es/mrui) (26). Peak areas of water (4.7 ppm) and the sum of the visible fat peaks (2.2, 1.3, 0.9 ppm) were corrected for T2 decay by nonlinear least-square fitting of the multi-TE spectra. Fat peaks at 4.2 and 5.3 ppm are obscured by the water peak and are not visible at in-vivo field strengths in human liver; these peak areas were estimated from the visible fat peaks based on the known biochemical structure of human liver triglyceride (26). Since the shapes of the peaks is not perfectly described by Gaussian or Lorentzian lineshapes, each of the fat peaks, and the water peak, were fitted by multiple Gaussian fits to provide the best estimate of the peak area. The MRS-determined PDFF was calculated as the integrated sum of T2-corrected fat peaks divided by the sum of T2-corrected fat and water peaks (9,22,23). T1 effects were assumed negligible at the acquired TRs and TMs (9,22).
Statistical Analysis
Reproducibility of MRI-Determined PDFF on 1.5T and 3T Scanners
Correlation was computed between MRI-determined PDFF from 1.5T and 3T images. All three ROIs for each subject and scanner were used. A mixed-effects version of a paired Student’s t-test was used to assess systematic differences in MRI-determined PDFF values calculated from the 1.5T and the 3T scanner data while adjusting for within-subject dependence. A Bland–Altman plot was generated to illustrate the agreement between the PDFF estimates derived from the two scanners.
Accuracy of MRI-Determined PDFF Estimation, Using MRS-Determined PDFF as Reference
Linear regression analyses were used to model MRI-determined PDFF versus MRS-determined PDFF as reference, separately for 1.5T and 3T data, using the MRI-determined PDFF from the ROI colocalized to the MRS voxel on each exam.
Reproducibility of MRS-Determined PDFF on 1.5T and 3T Scanners
Linear regression analyses were used to model MRS-determined PDFF at 1.5T vs. MRS-determined PDFF at 3T.
RESULTS
Subject Characteristics
Subjects’ age ranged from 10 to 63 years with a mean of 36 years. There were five children (two male, three female; mean age 14 years; range 10–18 years) and 16 adults (eight male, eight female; mean age 44 years; range 31–63 years). BMI ranged from 22.9 to 43.9 kg/m2. Using BMI >30 kg/m2 as the criteria for obesity, 14/21 (67%) of subjects were obese.
Using the average MRS-determined PDFF from the two scanners as reference, hepatic PDFF ranged from 0.1%–38.8%, with a mean of 15.7% and standard deviation of 11.2%. The mean PDFF in children was 14.8% (range 0.1%–38.8%). The mean PDFF in adults was 16.3% (range 1.5%–32.4%). Five subjects (one child, four adults) had 0%–5% PDFF, four (two children, two adults) had 6%–10%, two (one child, one adult) had 11%–15%, two (both adults) had 16%– 20%, and eight (two children, six adults) had >21%.
Reproducibility of MRI-Determined PDFF on 1.5T and 3T Scanners
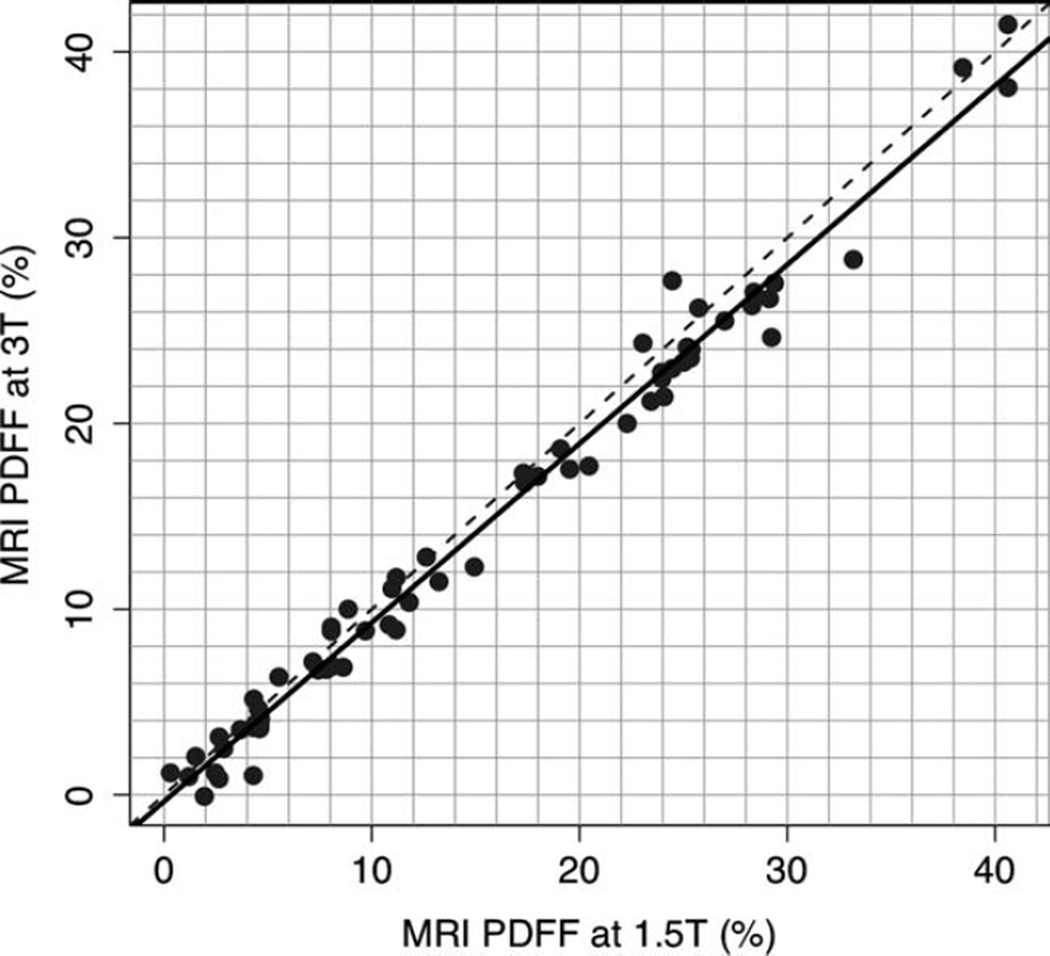
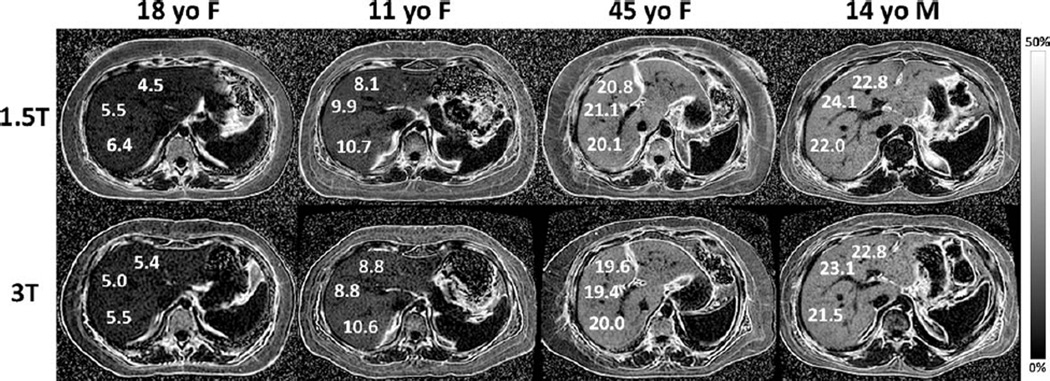
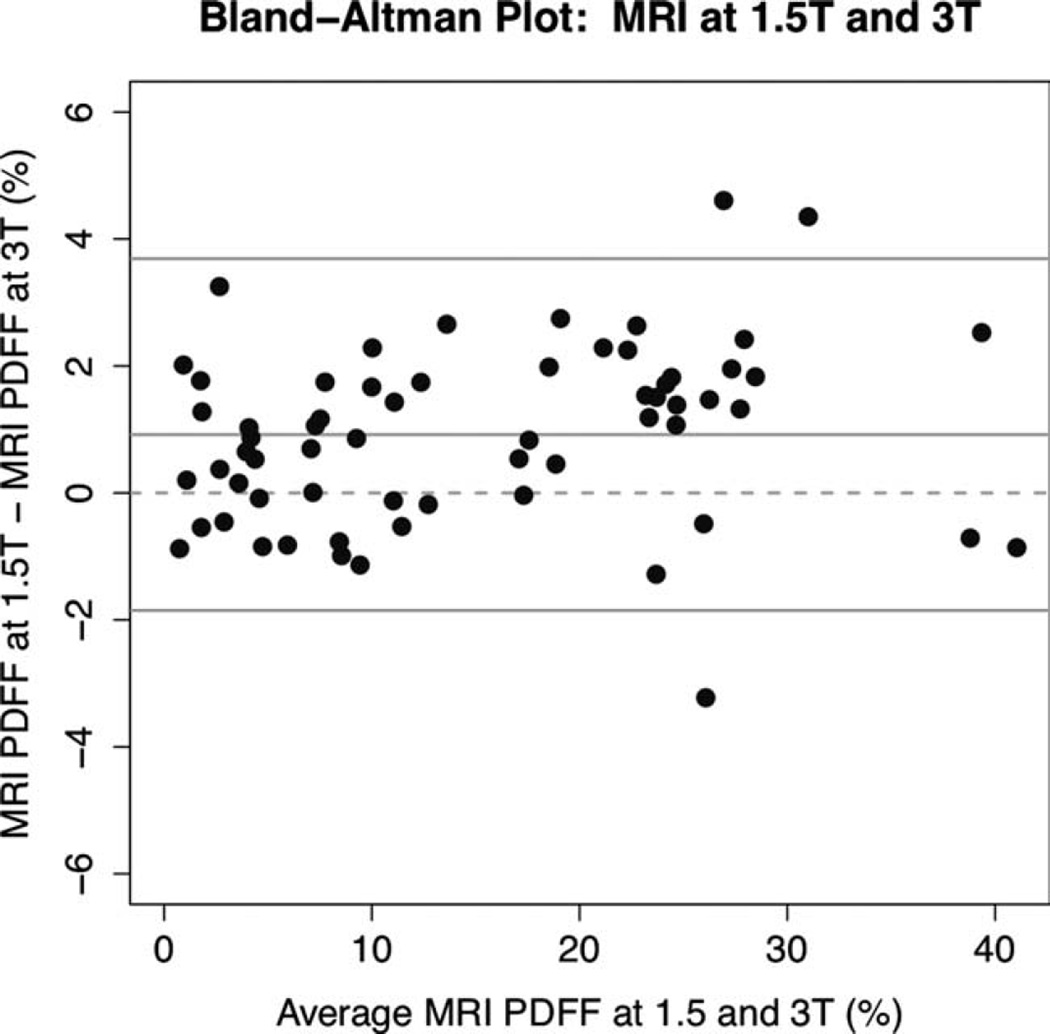
MRI-determined PDFF measurements on the 1.5T and 3T scanners were highly correlated (Pearson r = 0.992, P-value 0), as shown graphically in Fig. 2 and illustrated in four subjects in Fig. 3. In the regression of MRI-determined PDFF at 1.5T and MRI-determined PDFF at 3T, the intercept was 0.919, P < 0.001. On average, the 1.5T MRI-determined PDFF was higher than the 3T MRI-determined PDFF by 0.92% (P < 0.0001). MRI-determined PDFF differences at 1.5T compared to 3T ranged from −3.2 to +4.6%, while the limits for the interval defined by the mean difference ± 1.96 standard deviations were −1.9 and +3.7%. As illustrated in Fig. 4, the differences in MRI-determined PDFF estimates tended to be larger in subjects with greater amounts of liver fat.
Figure 2.
1.5T versus 3T MR imaging-determined PDFF reproducibility. MRI-determined PDFF estimations at 1.5T are plotted against MRI-determined PDFF estimations at 3T. Plot shows high interscanner reproducibility (r = 0.992) for PDFF measurements on the two scanners. The 1.5T Siemens scanner PDFF estimate was higher than the 3T GE scanner PDFF estimate by 0.92% on average (P < 0.0001). The dotted line is the line of equality.
Figure 3.
MRI-determined PDFF parametric maps of four subjects with NAFLD 18-year-old female, 11-year-old female, 45-year-old female, and 14-year-old male), showing direct comparison of liver fat content for three ROIs placed in each liver at both 1.5T (top row) and 3T (bottom row). The ROIs shown are for illustration purposes and are not necessarily those used in data analysis. Note the close qualitative and quantitative agreement in MRI-determined PDFF at 1.5T and at 3T across the wide range of liver fat content in the four subjects. The parametric maps were generated from source images by applying pixel-by-pixel the PDFF modeling algorithm described in the text. Maps are displayed with a PDFF range from 0%–50%. Subcutaneous adipose tissue appears dark on the parametric maps because the fat fraction in adipose tissue exceeds the 0%–50% PDFF range of magnitude-based MRI techniques.
Figure 4.
Bland–Altman plot of 1.5T and 3T MRI-determined PDFF estimates. The Bland–Altman plot shows that the 1.5T Siemens scanner PDFF estimate was higher than the 3T GE scanner PDFF estimate by 0.92% on average (P < 0.0001). Differences were smaller in subjects with lower average PDFF values.
PDFF Estimation Accuracy
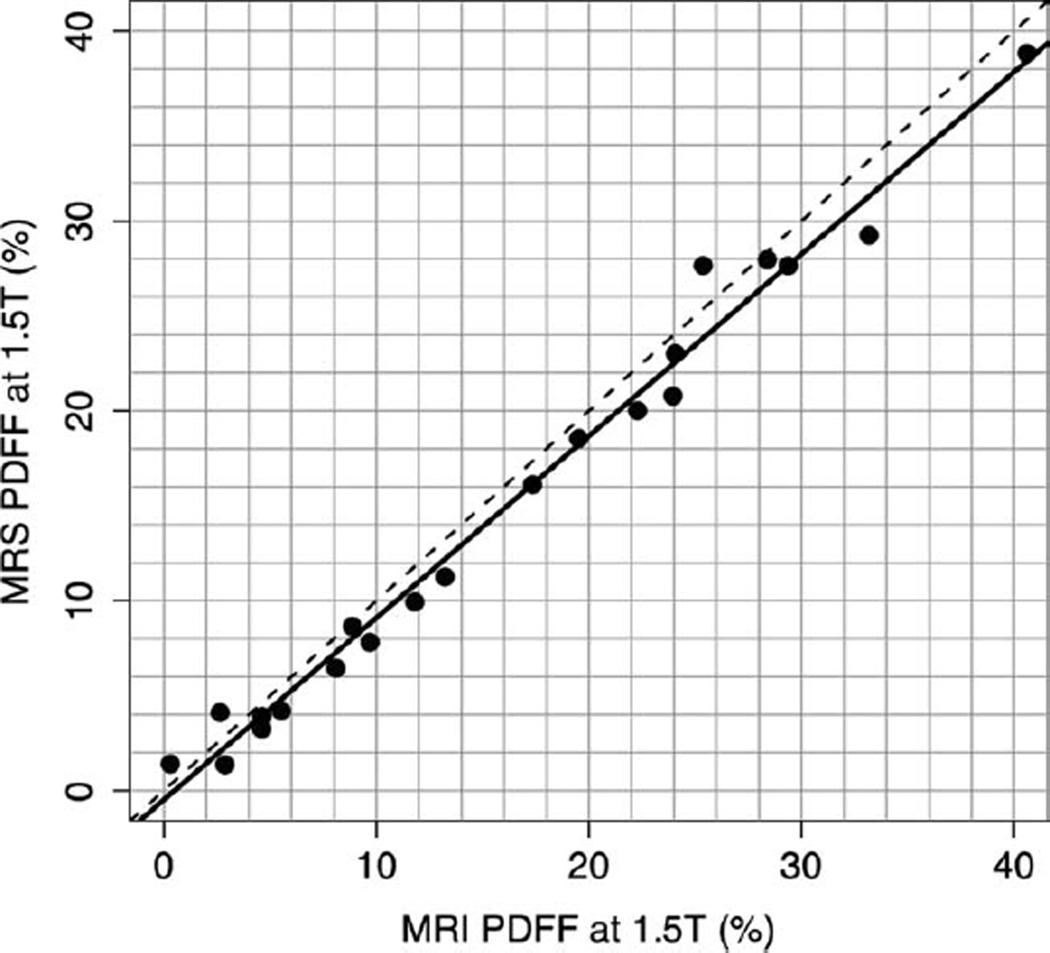
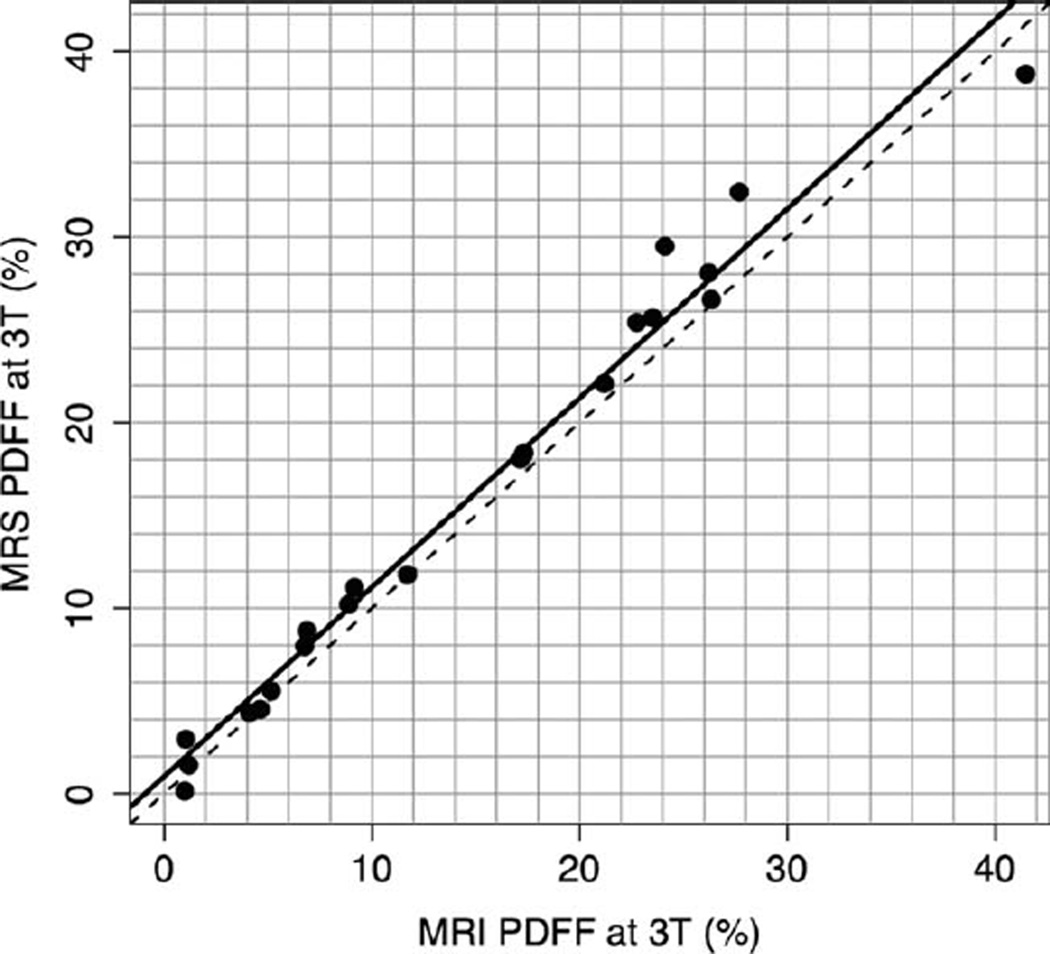
Linear regression analyses were used to model MRS-determined PDFF as a function of MRI-determined PDFF, developing an equation predicting the former from the latter. For the 1.5T scanner, the slope of the regression equation was 0.958 and the intercept was −0.48 (P = 0.374). The R2 of the regression was 0.985, corresponding to Pearson’s r = 0.993 and P = 0.0015. On average, for the 1.5T scanner, MRI-determined PDFF was higher than MRS-determined PDFF by 1.15% (P = 0.0015) (Fig. 5). For the 3T scanner, the slope of the regression equation was 1.020 and the intercept was 0.925 (P = 0.169). The R2 of the regression was 0.978, corresponding to Pearson’s r = 0.989 and P = 0.0044. On average, for the 3T scanner MRI-determined PDFF was lower than MRS-determined PDFF by 1.22% (P = 0.0044) (Fig. 6).
Figure 5.
1.5T MRI-determined PDFF versus 1.5T MRS-determined PDFF. This graph illustrates the high fat estimation accuracy of MRI-determined PDFF, using MRS-determined PDFF as the reference standard, at 1.5T (r = 0.993). The slope of the regression equation was 0.958 and the intercept was −0.48. On average, the MRI-determined PDFF estimates were higher than MRS-determined PDFF estimates by 1.15% (P = 0.0015). The dotted line is the line of equality. The solid line is the regression line.
Figure 6.
3T MRI-determined PDFF versus 3T MRS-determined PDFF. This graph illustrates the high fat estimation accuracy of MRI-determined PDFF, using MRS-determined PDFF as the reference standard, at 3T (r = 0.989). The slope of the regression equation was 1.020 and the intercept was 0.925. On average, the MRI-determined PDFF estimates were lower than MRS-determined PDFF estimates by 1.22% (P = 0.0044). The dotted line is the line of equality. The solid line is the regression line.
Reproducibility of MRS-Determined PDFF on 1.5 and 3T Scanners
Reproducibility of MRS-determined PDFF was assessed despite that no attempt was made to colocalize the MRS voxels on the two scanners. MRS-determined PDFF measurements on the 1.5T and 3T scanners were highly correlated (Pearson r = 0.992, P = 0.058). On average, the 3T MRS-determined PDFF was higher than the 1.5 MRS-determined PDFF at 1.5T by 1.03% (P < 0.0001).
DISCUSSION
In this prospective, cross-sectional, crossover, observational pilot study, liver MRI-determined PDFF was compared on two scanners of different field strengths from different vendors (1.5T Siemens, 3T GE). The primary purpose was to assess reproducibility of MRI-determined PDFF. While both complex- and magnitude-based PDFF MRI techniques have been described (9,10), we used only a magnitude-based technique because it was more easily implemented on the two scanners available for this study. To our knowledge, this is the first study to assess the reproducibility of MRI-determined PDFF estimates for scanners at different field strengths and from different vendors. While prior studies have shown accuracy against spectroscopy (9,22,23) and within-examination repeatability (28) of MRI-determined PDFF, demonstration of interscanner reproducibility is important to validate MRI-determined PDFF as a biomarker of liver fat content.
We found high correlation (r = 0.992) between MRI-determined PDFF measurements obtained on the two scanners, indicating excellent interscanner reproducibility. While the correlation between the 1.5T scanner and the 3T scanner MRI-determined PDFF estimates was high, interscanner agreement was imperfect, with the 1.5T estimates being higher by 0.92% on average. Further work is necessary to identify the cause of and to correct this discrepancy. Nevertheless, the discrepancy in PDFF estimates made with two scanners is small relative to the range of fat fractions encountered in human subjects (from 0% to more than 38%), suggesting that the two scanners may be used interchangeably to measure PDFF as endpoints in clinical trials as long as the treatment effect of interest is substantially larger than 0.92%.
A secondary purpose of our study was to assess the accuracy of MRI-determined PDFF. As in prior studies (9,22,23), we used MRS-determined PDFF rather than histology as the reference standard (29). While histology is considered the clinical gold standard for assessing liver fat, it may not be the most appropriate reference standard for evaluating the accuracy of MRI to assess liver steatosis. First, histomorphologic assessment of intracellular fat vacuoles does not directly measure fat content (8,30–32) and, depending on the size of intracellular fat vacuoles and the number of hepatocytes affected, liver fat assessment by histology may be misleading (32). Also, liver biopsy is prone to sampling error (≈1/50,000 of whole liver) and colocalization of histopathology with imaging may be difficult. As both MRI and MRS can be performed rapidly and contemporaneously, and are safe, MRS may be a more appropriate reference standard for MRI-determined PDFF.
Our linear regression analyses demonstrated high accuracy of MRI-determined PDFF on the 1.5T and the 3T scanners used in this study, using corresponding MRS-determined PDFF measurements as reference standard, with regression slopes close to 1 and intercepts close to 0.
No subject had MRS-determined PDFF in excess of 50%. Thus, while the magnitude-based technique used in this study computes PDFF only from 0%–50% (as opposed to the complex-based technique, which computes PDFF from 0%–100%), this measurement range appears to be adequate for liver fat assessment, which rarely exceeds 50% fat fraction (9,28).
An important limitation of our pilot study was that we had access to only two scanners. Due to this limitation, we could not assess whether the small differences in PDFF across scanners were due to field strength (1.5T vs. 3T), vendor (Siemens vs. GE), or both. Future more definitive studies of MRI-determined PDFF reproducibility will require the use of scanners manufactured by multiple scanner vendors (including but not limited to Siemens and GE) at both 1.5T and 3T to identify and assess possible modifying factors. Nevertheless, our pilot study showed proof-of-concept that PDFF is reproducible across Siemens 1.5T and GE 3T scanner platforms, with an interscanner estimation difference of 0.92% on average.
Another limitation of our pilot study was that we did not colocalize the MRS voxel at the same location at the 1.5T scanner and the 3T scanner. Colocalization of MRS voxels on different examinations is difficult due to unavoidable changes in patient positioning between exams. Since the MRS voxels were not necessarily placed in the same locations on the 1.5T Siemens and 3T GE exams, we did not attempt to assess the reproducibility of MRS-determined PDFF on the two scanners, nor to assess the extent to which differences in MRS-determined PDFF measurements on the two scanners may have contributed to differences in observed accuracy of MRI-determined PDFF using MRS as reference standard. While MRS is widely considered a definitive reference standard for PDFF measurement, it is conceivable that MRS-determined PDFF measurements on the two scanners may differ, and this may account in part for the observed differences in MRI-determined PDFF accuracy. Multivoxel MRS in principle may have helped to address the colocalization issue, but multivoxel MRS does not feasibly permit the collection of multiple echoes to correct for T2 effects, and so is not likely to be as accurate as single-voxel MRS.
A technical limitation of this pilot study was the use of one set of parameters for the MRI examinations on each scanner. For MRI-determined PDFF to be fully validated as a biomarker for hepatic steatosis, its robustness to the types of alterations in parameters that may be encountered clinically should be assessed. Such parameters include voxel size, slice thickness, matrix, and bandwidth. Future studies are necessary to assess the robustness of MRI-determined PDFF to alterations in these parameters.
Our pilot study included a relatively small sample size of 21 subjects. Further studies with larger numbers of subjects are required to further validate our findings. Also, subjects were scanned in a nonrandom order based on scanner availability, rather than in a random order. Since the nonrandom order was not based on imaging or spectroscopic results, however, it most likely did not bias our results.
In conclusion, this study contributes to the validation of the use of MRI-determined PDFF as a noninvasive quantitative biomarker of liver fat content, showing high reproducibility of MRI-determined PDFF across two different scanner platforms, each at a different field strength, and confirming the accuracy of MRI-determined PDFF using a spectroscopic reference as reported earlier (9,22,23). Further study is needed to confirm that MRI-determined PDFF can be estimated accurately on any clinical MR scanner equipped with a multiecho SPGR sequence, and to identify sources of, and correct the relatively small estimation disagreements between the two scanners used in our study.
Acknowledgments
Contract grant sponsors: General Electric (GE) under the auspices of the GE Grant Program (to C.B.S); National Institutes of Health, National Institute of Diabetes and Digestive and Kidney Diseases; Contract grant numbers: R01 DK075128, U01DK061734; Contract grant sponsors: National Institute of Child Health and Human Development; San Diego EXPORT Center, National Center of Minority Health and Health Disparities; Contract grant number: P60 MD00220; Contract grant sponsor: National Center for Research Resources for the General Clinical Research Center at UCSD; Contract grant number: M01 RR000827. The contents of this work are solely the responsibility of the authors and do not necessarily represent the official views of the National Institutes of Health.
REFERENCES
- 1.Lavine JE, Schwimmer JB. Nonalcoholic fatty liver disease in the pediatric population. Clin Liver Dis. 2004;8:549–558. viii–ix. doi: 10.1016/j.cld.2004.04.010. [DOI] [PubMed] [Google Scholar]
- 2.Sanyal AJ. AGA technical review on nonalcoholic fatty liver disease. Gastroenterology. 2002;123:1705–1725. doi: 10.1053/gast.2002.36572. [DOI] [PubMed] [Google Scholar]
- 3.Farrell GC, Larter CZ. Nonalcoholic fatty liver disease: from steatosis to cirrhosis. Hepatology. 2006;43(2 Suppl 1):S99–S112. doi: 10.1002/hep.20973. [DOI] [PubMed] [Google Scholar]
- 4.Negro F, Sanyal AJ. Hepatitis C virus, steatosis and lipid abnormalities: clinical and pathogenic data. Liver Int. 2009;29(Suppl 2):26–37. doi: 10.1111/j.1478-3231.2008.01950.x. [DOI] [PubMed] [Google Scholar]
- 5.Brunt EM. Alcoholic and nonalcoholic steatohepatitis. Clin Liver Dis. 2002;6:399–420. vii. doi: 10.1016/s1089-3261(02)00002-8. [DOI] [PubMed] [Google Scholar]
- 6.Brunt EM, Janney CG, Di Bisceglie AM, Neuschwander-Tetri BA, Bacon BR. Nonalcoholic steatohepatitis: a proposal for grading and stating the histological lesions. AM J Gastroenterol. 1999;94:2467–2474. doi: 10.1111/j.1572-0241.1999.01377.x. [DOI] [PubMed] [Google Scholar]
- 7.Kleiner DE, Brunt EM, Van Natta M, et al. Design and validation of a histological scoring system for nonalcoholic fatty liver disease. Hepatology. 2005;41:1313–1321. doi: 10.1002/hep.20701. [DOI] [PubMed] [Google Scholar]
- 8.Joy D, Thava VR, Scott BB. Diagnosis of fatty liver disease: is biopsy necessary? Eur J Gastroenterol Hepatol. 2003;15:539–543. doi: 10.1097/01.meg.0000059112.41030.2e. [DOI] [PubMed] [Google Scholar]
- 9.Yokoo T, Bydder M, Hamilton G, et al. Nonalcoholic fatty liver disease: diagnostic and fat-grading accuracy of low-flip-angle multiecho gradient-recalled-echo MR imaging at 1.5 T. Radiology. 2009;251:67–76. doi: 10.1148/radiol.2511080666. [DOI] [PMC free article] [PubMed] [Google Scholar]
- 10.Yu H, Shimakawa A, McKenzie CA, Brodsky E, Brittain JH, Reeder SB. Multiecho water-fat separation and simultaneous T2* estimation with multifrequency fat spectrum modeling. Magn Reson Med. 2008;60:1122–1134. doi: 10.1002/mrm.21737. [DOI] [PMC free article] [PubMed] [Google Scholar]
- 11.Kim H, Taksali SE, Dufour S, et al. Comparative MR study of hepatic fat quantification using single-voxel proton spectroscopy, two point Dixon and three-point IDEAL. Magn Reson Med. 2008;59:521–527. doi: 10.1002/mrm.21561. [DOI] [PMC free article] [PubMed] [Google Scholar]
- 12.Kawamitsu H, Kaji Y, Ohara T, Sugimura K. Feasibility of quantitative intrahepatic lipid imaging applied to the magnetic resonance dual gradient echo sequence. Magn Reson Med Sci. 2003;2:47–50. doi: 10.2463/mrms.2.47. [DOI] [PubMed] [Google Scholar]
- 13.Machann J, Thamer C, Schnoedt B, et al. Hepatic lipid accumulation in healthy subjects: a comparative study using spectral fat-selective MR IMAGING and volume-localized 1H-MR spectroscopy. Magn Reson Med. 2006;55:913–917. doi: 10.1002/mrm.20825. [DOI] [PubMed] [Google Scholar]
- 14.Bernard CP, Liney GP, Manton DJ, Turnbull LW, Langton CM. Comparison of fat quantification methods: a phantom study at 3.0T. J Magn Reson Imaging. 2008;27:192–197. doi: 10.1002/jmri.21201. [DOI] [PubMed] [Google Scholar]
- 15.Qayyum A, Goh JS, Kakar S, Yeh BM, Merriman RB, Coakley FV. Accuracy of liver fat quantification at MR imaging: comparison of out of-phase gradient-echo and fat-saturated fast spin-echo techniques—initial experience. Radiology. 2005;237:507–511. doi: 10.1148/radiol.2372040539. [DOI] [PubMed] [Google Scholar]
- 16.Hussain HK, Chenevert TL, Londy FJ, et al. Hepatic fat fraction: MR imaging for quantitative measurement and display — early experience. Radiology. 2005;237:1048–1055. doi: 10.1148/radiol.2373041639. [DOI] [PubMed] [Google Scholar]
- 17.Guiu B, Loffroy R, Cercueil JP, Krause D. Multiecho MR imaging and proton MR spectroscopy for liver fat quantification. Radiology. 2008;249:1081. doi: 10.1148/radiol.2493081034. [DOI] [PubMed] [Google Scholar]
- 18.Guiu B, Petit JM, Loffroy R, et al. Quantification of liver fat content: comparison of triple-echo chemical shift gradient-echo imaging and in vivo proton MR spectroscopy. Radiology. 2009;250:95–102. doi: 10.1148/radiol.2493080217. [DOI] [PubMed] [Google Scholar]
- 19.Bydder M, Yokoo T, Hamilton G, et al. Relaxation effects in the quantification of fat using gradient echo imaging. Magn Reson Imaging. 2008;26:347–359. doi: 10.1016/j.mri.2007.08.012. [DOI] [PMC free article] [PubMed] [Google Scholar]
- 20.Liu CY, McKenzie CA, Yu H, Brittain JH, Reeder SB. Fat quantification with IDEAL gradient echo imaging: correction of bias from T(1) and noise. Magn Reson Med. 2007;58:354–364. doi: 10.1002/mrm.21301. [DOI] [PubMed] [Google Scholar]
- 21.Yu H, McKenzie CA, Shimakawa A, et al. Multiecho reconstruction for simultaneous water-fat decomposition and T2* estimation. J Magn Reson Imaging. 2007;26:1153–1161. doi: 10.1002/jmri.21090. [DOI] [PubMed] [Google Scholar]
- 22.Yokoo T, Bydder M, Hamilton G, et al. Nonalcoholic fatty liver disease: diagnostic and fat-grading accuracy of low-flip-angle multiecho gradient-recalled-echo MR imaging at 1.5 T. Radiology. 2009;251:67–76. doi: 10.1148/radiol.2511080666. [DOI] [PMC free article] [PubMed] [Google Scholar]
- 23.Yokoo T, Shiehmorteza M, Hamilton G, et al. Estimation of hepatic proton-density fat fraction by using MR imaging at 3.0 T. Radiology. 2011;258:740–759. doi: 10.1148/radiol.10100659. [DOI] [PMC free article] [PubMed] [Google Scholar]
- 24.Vanhamme LT, Sundin, Hecke PV, Huffel SV. MR spectroscopy quantitation: a review of time-domain methods. NMR Biomed. 2001;14:233–246. doi: 10.1002/nbm.695. [DOI] [PubMed] [Google Scholar]
- 25.Hamilton G, Middleton MS, Bydder M, et al. Effect of PRESS and STEAM sequences on magnetic spectroscopic liver fat quantification. Magn Reson Imaging. 2009;30:145–152. doi: 10.1002/jmri.21809. [DOI] [PMC free article] [PubMed] [Google Scholar]
- 26.Hamilton G, Yokoo T, Bydder M, et al. In vivo characterization of liver fat (1)H MR spectrum. NMR Biomed. 2010 doi: 10.1002/nbm.1622. [Epub ahead of print] [DOI] [PMC free article] [PubMed] [Google Scholar]
- 27.Naressi A, Couturier C, Castang I, de Beer R, Graveron-Demilly D. Java-based graphical user interface for MRUI, a software package for quantitation of in vivo/medical magnetic resonance spectroscopy signals. Comput Biol Med. 2001;31:269–286. doi: 10.1016/s0010-4825(01)00006-3. [DOI] [PubMed] [Google Scholar]
- 28.Sirlin C, Shiehmorteza M, Mwangi I, et al. Radiological Society of North America Scientific Assembly and Annual Meeting Program. Oak Brook, IL: Radiological Society of North America; 2009. Accuracy, repeatability, and robustness of mr hepatic fat quantification by using a multi-echo gradient-recalled-echo (GRE) MR imaging in human subjects. (abstract SSQ07–03) [Google Scholar]
- 29.Thomsen C, Becker U, Winkler K, Christoffersen P, Jensen M, Henriksen O. Quantification of liver fat using magnetic resonance spectroscopy. Magn Reson Imaging. 1994;12:487–495. doi: 10.1016/0730-725x(94)92543-7. [DOI] [PubMed] [Google Scholar]
- 30.Szczepaniak LS, Nurenberg P, Leonard D, et al. Magnetic resonance spectroscopy to measure hepatic triglyceride content: prevalence of hepatic steatosis in the general population. Am J Physiol Endocrinol Metab. 2005;288:E462–E468. doi: 10.1152/ajpendo.00064.2004. [DOI] [PubMed] [Google Scholar]
- 31.Thampanitchawong P, Piratvisuth T. Liver biopsy: complications and risk factors. World J Gastroenterol. 1999;5:301–304. doi: 10.3748/wjg.v5.i4.301. [DOI] [PMC free article] [PubMed] [Google Scholar]
- 32.Ratziu V, Charlotte F, Heurtier A, et al. Sampling variability of liver biopsy in nonalcoholic fatty liver disease. Gastroenterology. 2005;128:1898–1906. doi: 10.1053/j.gastro.2005.03.084. [DOI] [PubMed] [Google Scholar]


