

Researchers show a correlation between per-capita social media activity and disaster damage, facilitating its rapid assessment.
Keywords: Social Media, Social Networks, Climate Change Adaptation, Disaster Management
Abstract
Could social media data aid in disaster response and damage assessment? Countries face both an increasing frequency and an increasing intensity of natural disasters resulting from climate change. During such events, citizens turn to social media platforms for disaster-related communication and information. Social media improves situational awareness, facilitates dissemination of emergency information, enables early warning systems, and helps coordinate relief efforts. In addition, the spatiotemporal distribution of disaster-related messages helps with the real-time monitoring and assessment of the disaster itself. We present a multiscale analysis of Twitter activity before, during, and after Hurricane Sandy. We examine the online response of 50 metropolitan areas of the United States and find a strong relationship between proximity to Sandy’s path and hurricane-related social media activity. We show that real and perceived threats, together with physical disaster effects, are directly observable through the intensity and composition of Twitter’s message stream. We demonstrate that per-capita Twitter activity strongly correlates with the per-capita economic damage inflicted by the hurricane. We verify our findings for a wide range of disasters and suggest that massive online social networks can be used for rapid assessment of damage caused by a large-scale disaster.
INTRODUCTION
Natural disasters are costly. They are costly in terms of property, political stability, and lives lost (1–3). Unfortunately, as a result of climate change, natural disasters, such as hurricanes, floods, and tornadoes, are also likely to become more common, more intense, and subsequently more costly in the future (4–7). Developing rapid response tools that are designed to aid in adapting to these forthcoming changes is critical (8).
As society faces this need, the use of social media on platforms like Facebook and Twitter is on the rise. Unlike traditional media, these platforms enable data collection on an unprecedented scale, documenting public reaction to events unfolding in both virtual and physical worlds. This makes social media platforms attractive large-scale laboratories for social science research (9–11). Opportunities provided by social media are used in various domains, including the economic (12), political (13–16), and social (14, 17–21) sciences, as well as in public health (22, 23).
Because of the potential of social media, the use of massive online social networks in disaster management has attracted significant public and research interest (24–26). In particular, the microblogging platform Twitter has been especially useful during emergency events (27–29). Twitter allows its users to share short 140-character messages and to follow public messages from any other registered user. Such openness leads to a network topology characterized by a large number of accounts followed by an average user, placing Twitter somewhere in between a purely social network and a purely informational network (30). The information network properties of Twitter facilitate and accelerate the global spread of information; its social network properties ease access to geographically and personally relevant information, and the message length limit encourages informative exchange. These factors combine to make Twitter especially well suited for a fast-paced emergency environment.
Existing research on the use of Twitter in an emergency context is manifold. Researchers study platform-specific features (retweets and private messages) of emergency information diffusion (31, 32), the role of the service in gathering and disseminating news (33, 34), its contribution to situational awareness (35, 36), and the adoption of social media by formal respondents to serve public demand for crisis-related information (37, 38). Another branch focuses on the practical aspects of classifying disaster messages, detecting events, and identifying messages from crisis regions (39–43). Others use Twitter’s network properties to devise sensor techniques for early awareness (44), to gauge thedynamics of societal response (45, 46), and to crowdsource relief efforts (47).
More recently, researchers have begun using social media platforms to derive information about disaster events themselves. For instance, the number of photographs uploaded to Flickr was shown to correlate strongly with physical variables that characterize natural disasters (atmospheric pressure during Hurricane Sandy) (48). Although it is unclear what causes the link (external information, network effects, or direct observer effects), the correlation suggests that digital traces of a disaster can help measure its strength or impact. On the basis of a similar concept, other studies verify the link between the spatiotemporal distribution of tweets and the physical extent of floods (49) and the link between the prevalence of disaster-related tweets and the distribution of Hurricane Sandy damage predicted from modeling (50).
Here, we present a hierarchical multiscale analysis of disaster-related Twitter activity. We start at the national level and progressively use a finer spatial resolution of counties and zip code tabulation areas (ZCTAs). First, we examine how geographical and sociocultural differences across the United States manifest through Twitter activity during a large-scale natural disaster (that is, Hurricane Sandy). We investigate the response of cities to the hurricane and identify general features of disaster-related behavior at the community level. Second, we study the distribution of geo-located messages at the state level within the two most affected states (New Jersey and New York) and, for the first time, analyze the relationship between Twitter activity and the ex-post assessment of damage inflicted by the hurricane. We verify the external validity of our findings across 12 other disaster events.
RESULTS
Context of the study
Hurricane Sandy was the largest hurricane of the 2012 season and one of the costliest disasters in the history of the United States. Sandy was a late-season hurricane that formed on 22 October 2012 southwest of Jamaica, peaked in strength as a Category 3 hurricane over Cuba, passed the Bahamas, and continued to grow in size while moving northeast along the United States coast. The hurricane made its landfall on the continental United States at 23:30 UTC on 29 October 2012 near Brigantine, NJ, with winds reaching 70 knots and with the storm surge reaching as high as 3.85 m. According to the National Hurricane Center (51), Sandy caused 147 direct fatalities and is responsible for damage in excess of $50 billion, including 650,000 destroyed or damaged buildings and more than 8.5 million people left without power—some of them for weeks.
Both broadcast and online media extensively covered Hurricane Sandy, generating a large volume of Twitter messages that became the basis for this study. Our raw data include hurricane-related messages (see table S1 for hurricane-related keywords and Materials and Methods for description of data) posted between 15 October and 12 November 2012, in a period that precedes the formation of the hurricane and extends beyond its dissipation. In total, we have 52.55 million messages from 13.75 million unique users. Because we are interested in a spatiotemporal analysis of Twitter activity, we focus exclusively on messages and users with known locations, which limits the data to 9.7 million geo-coded tweets from 2.2 million unique user accounts.
We perform the analysis at the national and state levels. At the national level, we use cities as a natural (in terms of spatial extent and population size) basis for aggregation and comparison. Cities are important because of their dominant (52, 53) and increasing (54, 55) socioeconomic role in all aspects of human life (56–58), both in the real world and online. In addition, similarities or differences in the way cities react to a major natural disaster, like Sandy, are of interest to social scientists and climate adaptation policy-makers alike (8, 59). Our analysis covers the 50 most populous urban areas according to the 2010 U.S. Census. At the state level, we progressively use a finer spatial resolution of counties and ZCTAs to analyze the local distributions of Twitter activity and hurricane damage. At every level of spatial resolution, we aggregate messages that have latitude and longitude falling within the boundaries of a respective region of interest (metropolitan area, county, or ZCTA). We use boundaries and population estimates of all administrative areas as determined by the 2010 U.S. Census.
After aggregating the tweets by location, we use time stamps for temporal analysis. We allocate messages into nonoverlapping bins of 24-hour duration aligned with the time of minimum activity. Comparison metrics include the total number of active users, number of messages posted, classification of these messages into original and retweeted messages (including identification of the source as local or external to a particular community), and sentiment. Because the number of tweets originating from different urban or zip code areas varies greatly, we compare characteristics as normalized by the total count of distinct users for each area who are active during the data collection period. For consistency, each keyword is considered separately, and normalization uses the count of users engaged in the activity on a particular topic to avoid the bias that may arise because of the different sets of prevalent topics in different cities.
Dynamics of Twitter activity across regions and hurricane-related topics
The messages studied here cover a range of keywords with varying relevance to Hurricane Sandy. Because of this, we deal with three dimensions in our analysis: spatial, temporal, and topical.
Figure 1 illustrates some of the characteristic features of Twitter activity. The pattern demonstrated by keywords strongly related to the hurricane (“sandy,” “storm,” “hurricane,” “frankenstorm,” etc.) is shown in Fig. 1A: the number of messages slowly increases with a strong peak on the day of hurricane landfall, followed by a gradual decline in the tweet activity level. Geographically, the trend is similar almost everywhere, but the magnitude of the normalized response changes depending on the proximity to the hurricane, determined through the shortest distance to the path of the hurricane (60).
Fig. 1. Example of the spatiotemporal evolution of Twitter activity across keywords.

(A) Geographical and topical variation of normalized activity (the number of daily messages divided by the number of local users active on the topic during the observation period). The horizontal axis is an offset (in hours) with respect to the time of hurricane landfall (00:00 UTC on 30 October 2012). Activity on hurricane-related words like “sandy” increases and reaches its peak on the day of landfall and then gradually falls off. Qualitatively similar trends are observed everywhere, with distance to the path of the hurricane affecting the strength of the response (compare magnitudes of activity peaks between New York, Chicago, and Miami). Different temporal patterns are exhibited by different keywords: “gas”-related discussion peaks with delay corresponding to posthurricane fuel shortages, and activity on “storm” has a secondary spike attributable to November “Nor’easter” storm. (B) Summary of activities by topic and location. Color corresponds to the level of normalized activity (blue, low; red, high). In columns, places are ranked according to their proximity to the path of the hurricane (closest on the left; farthest on the right). In rows, words are ranked according to the average activity on the topic. Evolution of the event brings disaster-related words to the top of the agenda, with the northeast showing the highest level of activity.
An alternative way to summarize the activity is shown in Fig. 1B, where the normalized activity is presented as a two-dimensional heatmap. We rank cities by their proximity to the hurricane, and we rank words by the average normalized activity. At the peak of the disaster, event-related keywords rank higher and activity increases with proximity. Consequently, we see that the upper-left corner of our city/topic matrix shows a high level of activity. In summary, as the disaster approaches and peaks in intensity, so does the normalized local Twitter response. In addition, the content of the message stream changes, and keywords most associated with the event dominate the agenda.
When we aggregate our data over the period between 20 October and 12 November 2012, we find that tweet activity declines with increasing distance from the hurricane path up to 1500 km and is nearly constant for all places farther away. These features are summarized in Fig. 2A and fig. S1 (for all keywords). This relationship between proximity and activity level is a dominant feature, accompanied by two other relationships. The first one is an inverse relationship between activity on the topic and originality of the content expressed through the fraction of retweets, which reflects the balance between content creation and consumption. The areas directly hit by, or close to, the disaster show a lower ratio of retweets (more original content) in the stream of messages generated, as can be seen in Fig. 2B and fig. S2. The second relationship is between the activity and the global popularity of local messages (defined as the count of messages that get retweeted, normalized by the local user count), with content from affected areas attracting higher attention elsewhere, as shown in Fig. 2C and fig. S3. The activity-popularity relationship (and, to a lesser degree, activity-originality relationship) is very strong for the event-related keywords but virtually absent for neutral or more general keywords. We illustrate this in Fig. 2 inset plots for the keyword “weather”—a general word that is used frequently and is not necessarily associated with extreme weather events, even when such events take place.
Fig. 2. Characteristic features of Twitter activity across locations (labeled by color according to hurricane proximity; blue, farther from the disaster; red, closer to the disaster).

In all panels, the primary plot shows results for messages with keyword “sandy” and an inset for keyword “weather” to contrast behaviors between event-related and neutral words. (A) A primary feature is the sharp decline in normalized activity as the distance between a location and the path of the hurricane increases. After the distance exceeds 1200 to 1500 km, its effect on the strength of response disappears. This trend may be caused by a combination of factors, with direct observation of disaster effects and perception of risk both increasing the tweet activity of the East Coast cities. Anxiety, anticipation, and risk perception evidently contribute to the magnitude of response because many of the communities falling into the decreasing trend were not directly hit or were affected only marginally, whereas New Orleans, for example, shows a significant tweeting level that reflects its historical experience with damaging hurricanes like Katrina. (B) The retweet rate is inversely related to activity, with affected areas producing more original content. (C) The popularity of the content created in the disaster area is also higher and therefore increases with activity as well. None of the features discussed above are present for neutral words (see the insets in all panels).
The direct relationship between online activity and proximity to the hurricane naturally raises the question of factors that stimulate such an activity. Is it extensive media coverage, perception of risk, or witnessing the hurricane’s meteorological effects (winds, precipitation, and storm surge) and damage (power and fuel shortages, flooding, loss of personal property, and casualties)? The latter, especially the extent to which quantifiable properties of online activity (recorded during and shortly after the disaster) reflect the severity of disaster-related damage, is especially interesting from the point of view of disaster management. Real-time analysis of online activity as a predictor of damage would be a valuable tool for optimizing the allocation of limited emergency and recovery resources, and may complement other predictive models used in the joint assessment and recovery of damaged infrastructures (61). Therefore, we investigate whether damage to property across the most severely hurricane-affected regions correlates with the recorded Twitter activity.
Damage assessment: Hurricane Sandy
Because the hurricane damage was mostly confined to several states, we perform damage analysis at finer spatial granularity by looking at counties and ZCTAs. We examine both aggregation levels to determine the limits of spatial resolution achievable with such a technique.
Two primary data sources contribute to our estimate of damage. The first data source are Federal Emergency Management Agency (FEMA) household assistance grants to homeowners and renters (62). These grants are provided to relieve the hardship of households exposed to disasters and to enable bringing the original property back to a habitable condition. The second data source are insurance claims associated with Hurricane Sandy (63, 64), including National Flood Insurance, residential, commercial, vehicle, and marine insurance claims. We use these indicators because both are expressed in monetary terms and are reported by individuals, rather than by administrative entities like municipalities. A more holistic index of community hardship [like the one by Halpin (65)] could be developed, taking into account other metrics: the number of people served in shelters, effects of power loss (using as proxy the number of days schools were closed), gas shortages (the number of calls to the State Emergency Hotline from gas stations), and FEMA public assistance grants to help with municipal infrastructure. Although such methodology gives a broader picture of the hardship on the ground, the metrics involved do not have a standard way of measurement and do not share a common unit to be integrated together. To avoid this ambiguity, we only include the data reported by individuals and measured directly as monetary loss.
We analyze the damage estimates, aggregated within either counties or ZCTAs, against Twitter activity in the same boundaries. The available data on damage allow us to look at several aspects, including the total damage claimed, the total damage covered by FEMA and insurance, the number of applications and successful applications, and severity categories based on the cost. We look at the relationship between normalized quantities (per-capita Twitter message count and per-capita damage) to avoid correlations artificially induced by population counts (more populous areas produce higher message counts and experience greater damage). To determine whether activity quantitatively reflects the severity of the disaster, we test the independence of two distributions: activity versus damage. We consider activity on the core set of messages strongly associated with the hurricane (see table S2 for the rankings and table S3 for the results across all keywords).
The estimate of damage is a snapshot from November 2014, whereas activity varies significantly over the data collection period. In the interest of capturing predictive capacity, and in a practical attempt to determine the best analysis window to get the strongest predictive effect, we calculate the correlations on a daily basis between 22 October and 12 November. In addition to examining the activity-damage correlation, we also check the sentiment-damage correlation. Previous studies (44) suggested that a drop in the average sentiment in an area may indicate an emergency, and we aim to verify whether the sentiment also serves as a quantitative predictor of damage.
Correlation coefficient dynamics is presented in Fig. 3. Because we discard inactive areas (ZCTAs with no messages posted during an analysis period), the length of vectors subject to an independence test varies over time, and we chose to discard correlation coefficients earlier than 22 October and later than 11 November. Within this period, we have, on average, hundreds of active ZCTAs (see Fig. 3A). Figure 3B shows that the rank correlation coefficients are moderately positive, indicating a weak correlation.
Fig. 3. Predictive capacity of Hurricane Sandy’s digital traces.
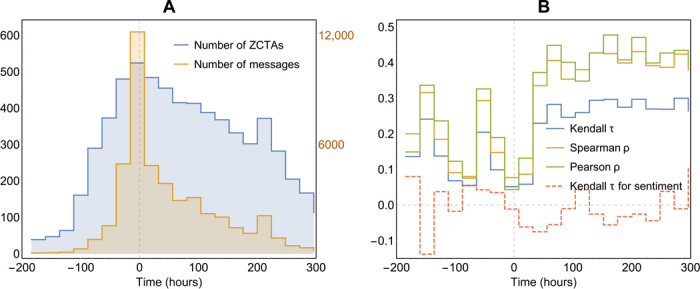
The horizontal axis is an offset (in hours) with respect to the time of hurricane landfall (00:00 UTC on 30 October 2012). (A) The number of messages as a function of time (labeled on the secondary y axis on the right) and the number of “active” (with at least one message posted) ZCTAs (labeled on the primary y axis on the left). (B) Evolution of the rank correlation coefficients between the normalized per-capita activity (number of original messages divided by the population of a corresponding ZCTA) and per-capita damage (composed of FEMA individual assistance grants and Sandy-related insurance claims). In addition, the dashed trend shows Kendall rank correlations between average sentiment and per-capita damage. The correlation increases from the prelandfall stage to the postlandfall stage of the hurricane, with a drop on the day of hurricane landfall. We conclude that the postdisaster stage, or persistent activity on the topic in the immediate aftermath of an event, is a good predictor of damage inflicted locally. The strength of the average sentiment of tweets does not seem to be a good predictor, at least at this level of spatial granularity (ZCTA resolution).
The correlation is present for several days before the landfall, which might reflect a priori knowledge of local hurricane vulnerability based on historical experience within particular areas and obvious risk factors such as proximity to the shoreline. This positive correlation decreases on the day of landfall across all correlation measures. Despite the highest total count of messages, the peak of the disaster has the weakest damage-predictive power. However, in the following 2 days, the activity-damage correlation steadily increases. From the third day onward, it fluctuates around a moderate level (Kendall τ = 0.25 to 0.3; Spearman ρ = 0.35 to 0.45). We examined these trends by combining all data, as well as by examining different keywords separately, without much of a difference in the pattern or magnitude of coefficients.
Arguably, this trend (a drop on the day of the hurricane, followed by a steady increase in the relationship between activity and damage) could be explained by the universally high tweet activity on the day of hurricane landfall, fueled not only by the severity of the storm but also by the widespread coverage of the hurricane in all forms of media. In places that were spared significant consequences of the hurricane, the interest of the public quickly diminishes. However, in affected areas, the topic persistently remains at the top of the agenda, making postevent activity an indicator of the damage caused by the hurricane.
Focusing on the period in which the relationship between activity and damage is strongest (between 31 October and 12 November), we measure rank correlation coefficients for all ZCTAs in New Jersey and for selected counties in New Jersey and New York. Results are summarized in Fig. 4 and fig. S4. ZCTA-based distributions of per-capita activity and per-capita damage are approximately log-normal, with histograms shown in Fig. 4A. The Kendall rank correlation reaches 0.39, the Spearman rank correlation reaches 0.55, and the Pearson correlation coefficient approaches 0.6. Analysis by county (Fig. 4B) reveals similar results: Kendall τ = 0.34, Spearman ρ = 0.49, and Pearson ρ = 0.49 for 34 counties across New Jersey and New York. All measures are statistically significant with P < 0.05, indicating a moderate positive correlation between damage and tweet activity. Spatial distributions confirm the relationship, with a pronounced concentration of both damage and normalized activity along the coastline of New Jersey. Alternative normalization (by Twitter user count instead of actual population) does not alter the strength of the correlation (see table S4). Using geo-enriched data instead of natively geo-coded data produces similar results, with ZCTA-level analysis giving a slightly weaker correlation but with county-based analysis unaffected (see fig. S5).
Fig. 4. Spatial distributions and mutual correlations between Hurricane Sandy damage, Twitter activity, and average sentiment of tweets.

Correlations between per-capita Twitter activity and damage are illustrated at the ZCTA level for New Jersey (A) and at the county level for New Jersey and New York (B). The difference in geographic coverage is dictated by the quality of data: no insurance data are available for New York at the ZCTA level. Spatial distributions show that both variables reach their highest levels along the coast and in densely populated metropolitan areas around New York City. Normalized activity and damage both follow a quasi log-normal distribution [see the histograms along the axes of the scatter plot in (A)]. A moderately strong positive correlation between postlandfall activity and damage is observed, especially for fine-resolution analysis [see inset tables in the scatter plots in (A) and (B) for exact statistics and P values]. Sentiment-versus-damage (S-D) analysis is underpowered at the ZCTA level (τ = −0.031, P = 0.29), but county-level analysis shows that negative sentiment correlates with damage (τ = −0.28, P = 0.018).
Following Guan and Chen (50), we also analyze the relationship between Twitter activity and damage estimates produced by the FEMA Modeling Task Force (based on the Hazus-MH model of hurricane wind and storm surge damage to housing and infrastructure). This approach results in somewhat weaker correlations (Kendall τ = 0.28, Spearman ρ = 0.44, and Pearson ρ = 0.33), suggesting that online response better reflects the actual damage (ex-post assessment instead of modeling predictions). Comparison of alternative damage estimates and their effects on the strength of the observed activity-damage correlation is summarized in tables S5 and S6.
Our previous study (44) suggested that the negative average sentiment may indicate an emergency situation based on the fact that the sentiment experiences a drop for a sustained period of time before and after the landfall of Hurricane Sandy. Here, we reexamine the sentiment-damage relationship and find that daily ranking correlation coefficients oscillate around zero for the entire observation period (see Fig. 3B). Within the most favorable prediction window (31 October to 12 November), Kendall τ = −0.031 (P = 0.294), suggesting independence of the underlying distributions or that analysis at ZCTA resolution is underpowered. Change in spatial resolution from ZCTAs to counties results in a more definitive relationship (τ = −0.28, P = 0.018), and normalization by Twitter user count yields more significant results (τ = −0.34, P = 0.005), confirming our previous findings and making sentiment weakly predictive of damage (see table S7 for the summary of results).
Verification for other disaster events
To establish that the correlation between damage and social media activity is sufficiently general, we test it for other events. We look at all major disasters declared by FEMA in 2013 and 2014, for which individual assistance data are publicly available. In total, 12 separate events of different nature were noted: five large-scale floods, five storms with tornadoes, a mudslide, and an earthquake.
We present the analysis based on damage estimates that include only FEMA individual assistance grants, without insurance data. Most of the states’ financial regulatory departments declined our requests for insurance information on the grounds that data were not available at the ZCTA level, whereas Arkansas provided county-based estimates (see table S8 for details). We conclude that the quality of data collected by the New Jersey State Department of Banking and Insurance is an exception to the standard practice likely because of the severity and magnitude of damage brought about by Hurricane Sandy.
We follow the same method of tracking the correlations between daily activity and damage, using the period in which they are strongest (usually onward from the second or third day after the peak in activity). Results of the correlation between Twitter activity and damage are summarized in Table 1.
Table 1. Activity-damage correlation (Kendall τ, Spearman ρ, and Pearson ρ) for additional events.
Disasters are sorted in order of increasing strength of the Pearson correlation coefficient. All disasters demonstrate moderate to strong levels of statistically significant correlations (P < 0.05) [with the exception of Alaska floods (DR-4122)].
| Event ID | Type | Kendall τ | P | Spearman ρ | P | Pearson ρ | P |
| DR4116 | Floods | 0.15 | 9.04 × 10⁻⁵ | 0.21 | 1.87 × 10⁻⁴ | 0.18 | 9.71 × 10⁻⁴ |
| DR4117 | Tornadoes | 0.17 | 0.05 | 0.26 | 0.05 | 0.24 | 0.06 |
| DR4176 | Tornadoes | 0.18 | 8.92 × 10⁻³ | 0.28 | 6.68 × 10⁻³ | 0.27 | 9.60 × 10⁻³ |
| Sandy | Hurricane | 0.16 | 3.30 × 10⁻¹³ | 0.24 | 5.04 × 10⁻¹³ | 0.30 | 5.99 × 10⁻²⁰ |
| DR4145 | Floods | 0.33 | 3.54 × 10⁻⁸ | 0.47 | 2.42 × 10⁻⁸ | 0.45 | 1.08 × 10⁻⁷ |
| DR4177 | Floods | 0.36 | 4.44 × 10⁻⁴ | 0.52 | 2.33 × 10⁻⁴ | 0.45 | 1.53 × 10⁻³ |
| DR4175 | Tornadoes | 0.34 | 0.02 | 0.46 | 0.03 | 0.46 | 0.03 |
| DR4195 | Floods | 0.32 | 1.28 × 10⁻⁸ | 0.47 | 3.35 × 10⁻⁹ | 0.46 | 6.32 × 10⁻⁹ |
| DR4174 | Tornadoes | 0.56 | 5.24 × 10⁻³ | 0.69 | 6.07 × 10⁻³ | 0.68 | 6.93 × 10⁻³ |
| DR4157 | Tornadoes | 0.51 | 9.70 × 10⁻⁴ | 0.71 | 2.38 × 10⁻⁴ | 0.72 | 1.71 × 10⁻⁴ |
| DR4168 | Mudslide | 0.44 | 0.04 | 0.59 | 0.03 | 0.86 | 1.84 × 10⁻⁴ |
| DR4193 | Earthquake | 0.74 | 3.80 × 10⁻⁵ | 0.90 | 7.50 × 10⁻⁷ | 0.88 | 3.92 × 10⁻⁶ |
| DR4122 | Floods | 1.00 | — | 1.00 | — | 1.00 | — |
All disasters exhibit moderate to strong correlations between activity and damage. Correlations are stronger for low-cost events (as shown in Fig. 5); with increasing scale and cost of damage, coefficients drop to an approximately constant level regardless of event type. Several events have an exceptionally strong relationship: the South Napa earthquake and the Oso mudslide. Both of these events are epicentric in nature: a landslide, which affected a single community, and an earthquake, which had a strength that quickly falls with distance. Our main findings for Hurricane Sandy (when FEMA data alone are used as estimates of damage) are comparable in strength with similar events [large-scale storms and floods (DR-4116)].
Fig. 5. Distribution of activity-damage correlations (Pearson correlation coefficients) across all disasters considered in the study.
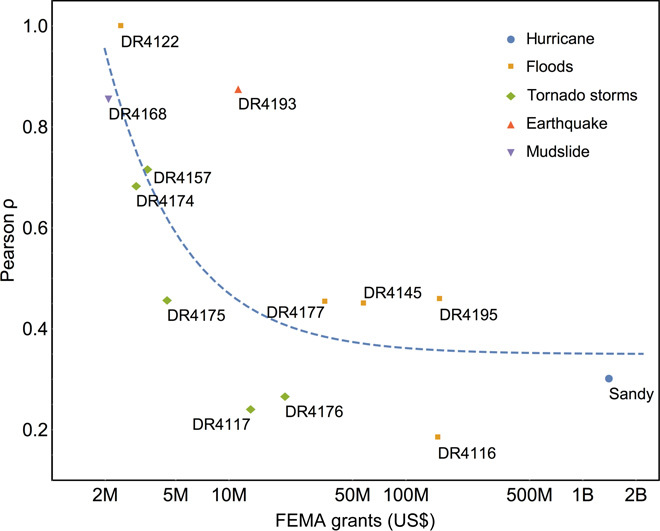
In terms of damage, disasters appear to group according to their type, with cost increasing from tornado storms, to floods, and eventually to hurricanes. The correlation between activity and damage is very strong for small-scale (low-cost) disasters, then it weakens and remains, on average, at the same level across moderate-cost to high-cost events.
One event where the correlation could not be reliably assessed is Alaska floods (DR-4122). It lacks data: Twitter activity in the region is very sparse, and we only detected 22 topical tweets across the disaster region. Those messages are in two ZCTAs, and the one with higher activity does suffer greater damage—still in agreement with our observations.
Our results for Hurricane Sandy indicate that when components of damage (FEMA grants and insurance payouts) are considered separately, insurance data appear more important. The total amount of payouts is higher ($5.3 billion in insurance claims against $0.4 billion in FEMA grants for New Jersey; $3.7 billion in insurance claims against $1 billion in FEMA grants for the State of New York), and the correlation with social media activity is stronger. It is likely because FEMA individual grants are designed just to provide urgent help to restore properties to basic livable conditions, and they may not reflect the full scale of damage. The fact that we see comparable (with Sandy) or stronger correlations in all additional events, despite the lack of insurance data, means that one may expect even stronger results with complete data (Kendall τ > 0.4 and Pearson ρ > 0.6).
DISCUSSION
We found that Twitter activity during a large-scale natural disaster—in this instance Hurricane Sandy—is related to the proximity of the region to the path of the hurricane. Activity drops as the distance from the hurricane increases; after a distance of approximately 1200 to 1500 km, the influence of proximity disappears. High-level analysis of the composition of the message stream reveals additional findings. Geo-enriched data (with location of tweets inferred from users’ profiles) show that the areas close to the disaster generate more original content, characterized by a lower fraction of retweets. This extends the previous understanding of retweeting behavior in crisis (31, 32) and confirms other studies (41). Finally, we find that messages from disaster regions generate more interest globally, with a higher normalized count of retweet sources.
In the first study of its kind, based on the actual ex-post damage assessments, we demonstrated that the per-capita number of Twitter messages corresponds directly to disaster-inflicted monetary damage. The correlation is especially pronounced for persistent postdisaster activity and is weakest at the peak of the disaster. We established that per-capita activity and per-capita damage both have an approximately log-normal distribution and that the Pearson correlation coefficient between the two can reach 0.6 for a carefully selected observation period in the aftermath of the landfall. This makes social media a viable platform for preliminary rapid damage assessment in the chaotic time immediately after a disaster. Our results suggest that, during a disaster, officials should pay attention to normalized activity levels, rates of original content creation, and rates of content rebroadcast to identify the hardest hit areas in real time. Immediately after a disaster, they should focus on persistence in activity levels to assess which areas are likely to need the most assistance.
We tested the sensitivity of our technique to variations in normalization strategies (Census population estimates versus Twitter user count), the volume and quality of underlying geo-coded data (natively geo-coded versus geo-enriched), and the methodology of damage assessment (multihazard modeling versus ex-post assessment). We also minimized potential intervening effects of media coverage by excluding tweets from media accounts, together with the associated retweets, and by filtering all messages using several activity thresholds (see table S9). Our results qualitatively hold in every case, noting the strongest relationship when we use native Twitter data, reliable Census population estimates, and comprehensive ex-post damage estimates.
The role of proximity as the primary factor explaining activity suggests that individuals realistically assess danger based on personal experiences (66) and that their level of interest is moderated accordingly. The cutoff in the activity-distance relationship is on the same order of magnitude as the footprint of a large atmospheric system, indicating that once people feel safe where they are, the level of engagement is uniform and most likely depends on the intensity of media coverage. Activity within the zone of the disaster sharply rises with proximity to its epicenter, possibly attributable to a combination of factors, including heightened anxiety, sense of direct relevance, and observation of the associated effects (wind, precipitation, and physical damage). Our findings echo other studies, such as the study on the correlation of the number of Flickr photos tagged “#sandy” with atmospheric pressure over New Jersey, emphasizing that online activity increases with the intensity of the event (48). However, what is striking with all of the different factors that motivate people to tweet is that a simple normalized measure of this activity—per-capita number of messages—serves as an efficient assessment tool for measuring the physical damage caused by the disaster.
The method for the assessment of the damage distribution proposed here offers a range of advantages to complement traditional alternatives (modeling, postdisaster surveying, and collection of data from multiple institutions): the advantages of fine spatial resolution, speed, low cost, and simplicity. For instance, damage forecasts issued by the FEMA Modeling Task Force rely on the sophisticated multihazard modeling. Although these forecasts are timely (generated before or immediately after a disaster), their verification with aerial imagery and physical site inspections is resource- and time-consuming. Social media damage assessment provides an additional low-cost tool in the arsenal of authorities to expedite the allocation of relief funds. Fine spatial resolution and speed of preliminary assessment can also be used to inform stochastic optimization algorithms for the joint assessment and repair of complex infrastructures, like power systems (61). In the long term, the technique can be used to check the integrity of the damage assessment process itself, especially in light of protracted settlement time frames and allegations of irregularities that recently prompted a blanket review of all insurance claims by FEMA (67). In addition, for disasters that affect multiple jurisdictions (states), the method mitigates the issue of local differences in assessment practices.
The correlation that we observed is not uniformly definitive in its strength for all events, and care should be taken in the attempt to devise practical applications. Moreover, an indirect and potentially nonstationary relationship between social media signals and real-world phenomena, compounded by changing social norms in the use of particular online platforms, calls for caution in developing predictive tools based on Big Data analysis (68). However, we believe that the method can be fine-tuned and strengthened by combination with traditional approaches like multihazard modeling. More robust estimates of damage through other data sources—for instance, the inclusion of municipal losses and nonmonetary indicators such as statistics on power losses and emergency shelters (65)—may reinforce the relationship. Composite metrics that combine per-capita activity with other properties of Twitter’s message stream [for example, fraction of disaster-related tweets (50) and sentiment (provided that activity is high and the volume of data is sufficient for sentiment to be predictive)] may prove to be even more sensitive to damage. Moreover, data from other social media, such as Facebook, Instagram, and Flickr, may be included to complement Twitter activity.
Finally, with continued monitoring of social media over time, we can potentially devise disaster-specific predictive models once a sufficient number of events of similar nature are available for the analysis against social media data. More broadly, our study suggests that the distribution of per-capita online activity on a specific topic has the potential to describe and quantify other natural, economic, or cultural phenomena.
MATERIALS AND METHODS
Raw Twitter data
The raw data for Hurricane Sandy comprise two distinct sets of messages. We obtained the data sets through the analytics company Topsy Labs. The first set consists of messages with the hashtag “#sandy” posted between 15 October and 12 November 2012. The data include the text of the messages and a range of additional information, such as message identifiers, user identifiers, follower counts, retweet statuses, self-reported or automatically detected location, time stamps, and sentiment scores. The second data set has a similar structure and was collected within the same time frame; however, instead of a hashtag, it includes all messages that contain one or more instances of specific keywords that are considered to be relevant to the event and its consequences (“sandy,” “hurricane,” “storm,” “superstorm,” “flooding,” “blackout,” “gas,” “power,” “weather,” “climate,” etc.; see table S1 for the full list). In total, for Hurricane Sandy, we have 52.55 million messages from 13.75 million unique users.
Data for the additional disasters were obtained in two ways. For the disasters that occurred during 2013, the data were purchased from Gnip, a Twitter subsidiary data reseller. For each disaster, we used the geographic boundary of the affected region and collected all messages that contained a preselected set of keywords (“storm,” “rain,” “flood,” “wind,” “tornado,” “mudslide,” “landslide,” “quake,” “fema”). Data for the events from 2014 are extracted from continuously collected geo-tagged tweets from the United States via Twitter’s Streaming Application Programing Interface (API).
Data sets obtained from data providers (Topsy and Gnip) are the subsets of full historical data (“high fidelity”). Streaming API offers almost complete coverage because only about 1 to 1.5% of all messages are geo-enabled and more than 90% of natively geo-coded messages are captured when geographic boundary is used in a request (69).
Tweets location data
Spatial analysis relies on the location information embedded in a message or otherwise inferred. Only a small fraction of messages [in our Hurricane Sandy data, about 1.2% for the hashtag data set and 1.5% for the keywords data set (775,000 messages in total)] are geo-tagged by Twitter. Moreover, if the message is a retweet, it carries no geographic information of its own but rather contains details of the source. For this reason, retweet studies usually rely on historic geo-enabled messages by a user to infer the location of other messages from the same user (32).
To expand the data available for spatial analysis and to enable analysis of the stream composition (fraction of retweets), we performed geo-enrichment of raw data. We parsed location strings from user profiles and assigned coordinates when a profile-listed location returned a match against the U.S. Census Bureau Topologically Integrated Geographic Encoding and Referencing (TIGER) database. In Hurricane Sandy data, this results in the geo-enriched set of 9.7 million tweets from 2.2 million unique accounts.
National-scale analysis used geo-enriched data and would otherwise be impossible for many keywords because of the lack of data in some places. For damage analysis at the state level, we used both natively geo-coded messages (as a geographically more reliable set) and geo-enriched data to test the effects of enrichment on the strength of correlation.
Filtering
Two potential issues may arise when collecting and analyzing geo-coded messages.
The first issue is an artificial clustering of messages at arbitrary virtual locations, which may happen with external applications like Foursquare. Foursquare check-in “@Frankenstorm Apocalypse” created several clusters of messages in Lower Manhattan, East River, and Bayside areas of New York City. Three of these clusters significantly skewed the local message count of corresponding ZCTAs.
The second issue is also associated with stationary clusters of messages—those produced by institutional accounts that issue or distribute weather forecasts and emergency warnings. Such accounts often operate automatically and publish frequent updates at regular intervals. In the course of the data collection period, they may produce tens or hundreds of messages, similarly inflating the local count of messages.
We rectified both issues by implementing filtering that detects clusters of colocated messages. We checked each cluster individually to ensure that it fell into one of the two categories mentioned above and discarded all corresponding messages if that was the case.
Sentiment
The objective of sentiment analysis is to assign a measure of emotion or mood expressed in the text and to classify the text accordingly as positive, negative, or neutral. Sentiment in Twitter has been studied and demonstrated to reflect temporal (19, 70) and geographical (71) mood variations. In the context of natural disasters, we previously observed (44) that sentiment is sensitive to large-scale disasters. Here, we aimed to investigate further whether the signal carried by sentiment was indicative of damage.
Sentiment analysis usually relies on a lexicon of words that are classified as positive or negative and analyzes the text for the frequency of the occurrence of such words. An output could be the rate of positive/negative terms or (if the lexicon assigns the strength to each word on a certain scale) an absolute total or word-count normalized score.
Our raw data obtained from the data provider Topsy have sentiment scores assigned to every message. The algorithm of classification is proprietary, and the lexicon is unavailable for open access. Three versions of the score are provided: total absolute score, word-count normalized score (relative score), and trinary classification (+1, −1, and 0). From the distribution of scores in the data set, we concluded that the method was lexicon-based, with the weights of dictionary words falling within the range from −5 to +5. Because Topsy’s algorithm is proprietary, we verified it with two alternative methods: Linguistic Inquiry and Word Count (LIWC), which is a frequency-based tool with unweighted lexicon that is widely used in psychological research (72), and SentiStrength (73), which uses a weighted lexicon and takes into account certain features that are prevalent in short messages (emoticons, standard abbreviations, slang, “booster,” and negation lexical constructs).
We find that, at the level of individual messages, all metrics are correlated: strongly correlated for Topsy versus LIWC, moderately correlated for LIWC versus SentiStrength, and somewhat weakly correlated for Topsy versus SentiStrength (see table S10 for correlation coefficients). The temporal trends in the average sentiment of messages aggregated hourly for all three metrics closely follow each other (see fig. S6), suggesting that all classification techniques are comparable and robust, especially in aggregate analysis. We also separately analyzed the frequencies of the words that were most prevalent among positive and negative messages (see table S11). Our selection keywords, such as “hurricane,” “power,” and “storm,” are featured equally in both groups. However, apart from these terms, the rest of the top-ranking positive words are clearly positive emotion terms; for the negative group, they are negative emotions, profanities, and event-related words (“emergency”).
Given that all metrics perform adequately, we use native Topsy sentiment because it returns the highest statistically significant sentiment-damage correlation (see table S12). We used the relative score, which reflects both the polarity and the strength of emotions in a principled manner, taking into account the length of a message. The mean sentiment score was calculated for all messages within a particular area of interest (ZCTA or county), and the distribution of sentiment was analyzed against the distribution of damage.
Supplementary Material
Acknowledgments
We thank C. O’Dea (NJ Spotlight; www.njspotlight.com) for helpful suggestions and advice on obtaining the data for Hurricane Sandy damage, as well as FEMA, the New Jersey State Department of Banking and Insurance, and the New York State Department of Financial Services for providing the data. We thank the anonymous reviewers for their valuable suggestions. Funding: Y.K., H.C., P.V.H., and M.C. were supported by the Australian Government as represented by the Department of Broadband, Communications, and Digital Economy and the Australian Research Council through the ICT Centre of Excellence program. E.M. received support from the Spanish Ministry of Science and Technology (grant FIS2013-47532-C3-3-P). N.O. was supported by the National Science Foundation (grants DGE0707423 and 1424091). M.C. received support from the Army Research Laboratory (cooperative agreement numbers W911NF-09-2-0053 and W911NF-11-1-0363), National Science Foundation (grant 0905645), and DARPA/Lockheed Martin Guard Dog Programme (grant PO 4100149822). Author contributions: The authors contributed equally to the design of the study, collection and analysis of the data, and preparation of the manuscript. Competing interests: The authors declare that they have no competing interests. Data and materials availability: All data needed to evaluate the conclusions in the paper are present in the paper and/or the Supplementary Materials. Additional data related to this paper may be requested from the authors. The data for this study are publicly available from the DRYAD repository via http://dx.doi.org/10.5061/dryad.15fv2.
SUPPLEMENTARY MATERIALS
Supplementary material for this article is available at http://advances.sciencemag.org/cgi/content/full/2/3/e1500779/DC1
Table S1. List of keywords included in the analysis, with their corresponding message counts.
Table S2. Ranking of the keywords included in the analysis according to the strength of the correlation between distance and activity for East Coast cities.
Table S3. Activity-damage correlations across keywords in order of decreasing strength.
Table S4. Effect of normalization variable choice on the strength of activity-damage relationship (ZCTA resolution).
Table S5. County-level estimates of damage: Modeling (Hazus-MH) and ex-post data on insurance and FEMA individual assistance grants.
Table S6. Strength of activity-damage correlations for different damage estimates.
Table S7. Predictive power of sentiment, analyzed at different spatial resolutions and normalized by either area Census population or local Twitter user count (“Twitter population”).
Table S8. List of the disasters considered in the study, with a description of the damage data available for analysis.
Table S9. Effect of the activity threshold filter on the strength of the relationship between Twitter activity and damage.
Table S10. Mutual correlations between sentiment metrics at the level of individual messages.
Table S11. Top-ranking words by frequency of occurrence in positive and negative messages.
Table S12. Sentiment as a predictor of damage: Comparison between metrics.
Fig. S1. Normalized local activity on the topic as a function of distance to the hurricane path.
Fig. S2. Originality of content, expressed through the fraction of retweets in the stream of messages.
Fig. S3. Global popularity of local content.
Fig. S4. Comparison of predictive capacity of activity and sentiment.
Fig. S5. Comparison of activity-damage correlation strength for different precision levels of geo-location.
Fig. S6. Average sentiment trends over time: Comparison between sentiment metrics.
REFERENCES AND NOTES
- 1.Klomp J., Valckx K., Natural disasters and economic growth: A meta-analysis. Global Environ. Change 26, 183–195 (2014). [Google Scholar]
- 2.Cole S., Healy A., Werker E., Do voters demand responsive governments? Evidence from Indian disaster relief. J. Dev. Econ. 97, 167–181 (2012). [Google Scholar]
- 3.Patz J. A., Frumkin H., Holloway T., Vimont D. J., Haines A., Climate change: Challenges and opportunities for global health. JAMA 312, 1565–1580 (2014). [DOI] [PMC free article] [PubMed] [Google Scholar]
- 4.Knutson T. R., McBride J. L., Chan J., Emanuel K., Holland G., Landsea C., Held I., Kossin J. P., Srivastava A. K., Sugi M., Tropical cyclones and climate change. Nat. Geosci. 3, 157–163 (2010). [Google Scholar]
- 5.Webster P. J., Holland G. J., Curry J. A., Chang H.-R., Changes in tropical cyclone number, duration, and intensity in a warming environment. Science 309, 1844–1846 (2005). [DOI] [PubMed] [Google Scholar]
- 6.Elsner J. B., Elsner S. C., Jagger T. H., The increasing efficiency of tornado days in the United States. Clim. Dyn. 45, 651–659 (2014). [Google Scholar]
- 7.Mendelsohn R., Emanuel K., Chonabayashi S., Bakkensen L., The impact of climate change on global tropical cyclone damage. Nat. Clim. Change 2, 205–209 (2012). [Google Scholar]
- 8.Morss R. E., Wilhelmi O. V., Meehl G. A., Dilling L., Improving societal outcomes of extreme weather in a changing climate: An integrated perspective. Annu. Rev. Environ. Resour. 36, 1–25 (2011). [Google Scholar]
- 9.Watts D. J., A twenty-first century science. Nature 445, 489 (2007). [DOI] [PubMed] [Google Scholar]
- 10.Lazer D., Pentland A., Adamic L., Aral S., Barabasi A. L., Brewer D., Christakis N., Contractor N., Fowler J., Gutmann M., Jebara T., King G., Macy M., Roy D., Van Alstyne M., Life in the network: The coming age of computational social science. Science 323, 721–723 (2009). [DOI] [PMC free article] [PubMed] [Google Scholar]
- 11.D. J. Watts, The virtual lab, in Proceedings of the Sixth ACM International Conference on Web Search and Data Mining, Rome, Italy, 4 to 8 February 2013. [Google Scholar]
- 12.Llorente A., Garcia-Herranz M., Cebrian M., Moro E., Social media fingerprints of unemployment. PLoS One 10, e0128692 (2015). [DOI] [PMC free article] [PubMed] [Google Scholar]
- 13.Bond R. M., Fariss C. J., Jones J. J., Kramer A. D. I., Marlow C., Settle J. E., Fowler J. H., A 61-million-person experiment in social influence and political mobilization. Nature 489, 295–298 (2012). [DOI] [PMC free article] [PubMed] [Google Scholar]
- 14.Conover M. D., Davis C., Ferrara E., McKelvey K., Menczer F., Flammini A., The geospatial characteristics of a social movement communication network. PLoS One 8, e55957 (2013). [DOI] [PMC free article] [PubMed] [Google Scholar]
- 15.Conover M. D., Ferrara E., Menczer F., Flammini A., The digital evolution of Occupy Wall Street. PLoS One 8, e64679 (2013). [DOI] [PMC free article] [PubMed] [Google Scholar]
- 16.B. O’Connor, R. Balasubramanyan, B. R. Routledge, N. A. Smith, From tweets to polls: Linking text sentiment to public opinion time series, in Proceedings of the Fourth International AAAI Conference on Weblogs and Social Media (ICWSM’10 ), Washington, DC, 23 to 26 May 2010. [Google Scholar]
- 17.Hodas N. O., Lerman K., The simple rules of social contagion. Sci. Rep. 4, 4343 (2014). [DOI] [PMC free article] [PubMed] [Google Scholar]
- 18.Toole J. L., Cha M., González M. C., Modeling the adoption of innovations in the presence of geographic and media influences. PLoS One 7, e29528 (2012). [DOI] [PMC free article] [PubMed] [Google Scholar]
- 19.Golder S. A., Macy M. W., Diurnal and seasonal mood vary with work, sleep, and daylength across diverse cultures. Science 333, 1878–1881 (2011). [DOI] [PubMed] [Google Scholar]
- 20.N. O. Hodas, F. Kooti, K. Lerman, Friendship paradox redux: Your friends are more interesting than you, in Proceedings of the Seventh International AAAI Conference on Weblogs and Social Media (ICWSM’13), Cambridge, MA, 8 to 10 July 2013. [Google Scholar]
- 21.Garcia-Herranz M., Moro E., Cebrian M., Christakis N. A., Fowler J. H., Using friends as sensors to detect global-scale contagious outbreaks. PLoS One 9, e92413 (2014). [DOI] [PMC free article] [PubMed] [Google Scholar]
- 22.Chew C., Eysenbach G., Pandemics in the age of Twitter: Content analysis of Tweets during the 2009 H1N1 outbreak. PLoS One 5, e14118 (2010). [DOI] [PMC free article] [PubMed] [Google Scholar]
- 23.Chunara R., Andrews J. R., Brownstein J. S., Social and news media enable estimation of epidemiological patterns early in the 2010 Haitian cholera outbreak. Am. J. Trop. Med. Hyg. 86, 39–45 (2012). [DOI] [PMC free article] [PubMed] [Google Scholar]
- 24.D. Wang, Y.-R. Lin, J. P. Bagrow, Social networks in emergency response, in Encyclopedia of Social Network Analysis and Mining (Springer-Verlag, New York, 2014). [Google Scholar]
- 25.D. Watts, M. Cebrian, M. Elliot, Dynamics of social media, in Public Response to Alerts and Warnings Using Social Media: Report of a Workshop on Current Knowledge and Research Gaps (The National Academies Press, Washington, DC, 2013), pp. 22–33. [Google Scholar]
- 26.P. Van Hentenryck, Computational disaster management, in Proceedings of the Twenty-Third International Joint Conference on Artificial Intelligence (IJCAI’13), Beijing, China, 3 to 9 August 2013. [Google Scholar]
- 27.Hughes A. L., Palen L., Twitter adoption and use in mass convergence and emergency events. Int. J. Emerg. Manage. 6, 248–260 (2009). [Google Scholar]
- 28.Freeman M., Fire, wind and water: Social networks in natural disasters. J. Cases Inf. Technol. 13, 69–79 (2011). [Google Scholar]
- 29.Skinner J., Natural disasters and Twitter: Thinking from both sides of the tweet. First Monday 18, Number 9 (2013). [Google Scholar]
- 30.S. A. Myers, A. Sharma, P. Gupta, J. Lin, Information network or social network? The structure of the Twitter follow graph, in Proceedings of the Companion Publication of the Twenty-Third International Conference on World Wide Web Companion (WWW’14), New York, NY, 2014. [Google Scholar]
- 31.K. Starbird, L. Palen, Pass it on?: Retweeting in mass emergency, in Proceedings of the Seventh International Conference on Information Systems for Crisis Response and Management (ISCRAM’10), Seattle, WA, 2 to 5 May 2010. [Google Scholar]
- 32.M. Kogan, L. Palen, K. M. Anderson, Think local, retweet global: Retweeting by the geographically-vulnerable during Hurricane Sandy, in Proceedings of the Eighteenth ACM Conference on Computer Supported Cooperative Work & Social Computing (CSCW’15), Vancouver, BC, 14 to 18 March 2015. [Google Scholar]
- 33.M. Guy, P. Earle, C. Ostrum, K. Gruchalla, S. Horvath, Integration and dissemination of citizen reported and seismically derived earthquake information via social network technologies, in Advances in Intelligent Data Analysis IX (Springer, Berlin, 2010), pp. 42–53. [Google Scholar]
- 34.Li J., Rao H. R., Twitter as a rapid response news service: An exploration in the context of the 2008 China earthquake. Electron. J. Inf. Syst. Dev. Countries 42, 1–22 (2010). [Google Scholar]
- 35.S. Vieweg, A. L. Hughes, K. Starbird, L. Palen, Microblogging during two natural hazards events: What Twitter may contribute to situational awareness, in Proceedings of the SIGCHI Conference on Human Factors in Computing Systems (CHI’10), Atlanta, GA, 10 to 15 April 2010. [Google Scholar]
- 36.R. Power, B. Robinson, J. Colton, M. Cameron, Emergency situation awareness: Twitter case studies, in Information Systems for Crisis Response and Management in Mediterranean Countries, C. Hanachi, F. Bénaben, F. Charoy, Eds. (Springer International Publishing, Gewerbestrasse, Cham, 2014), pp. 218–231. [Google Scholar]
- 37.A. L. Hughes, L. A. S. Denis, L. Palen, K. M. Anderson, Online public communications by police & fire services during the 2012 Hurricane Sandy, in Proceedings of the SIGCHI Conference on Human Factors in Computing Systems (CHI’14), Toronto, ON, 26 April to 1 May 2014. [Google Scholar]
- 38.L. A. St Denis, L. Palen, K. M. Anderson, Mastering social media: An analysis of Jefferson county’s communications during the 2013 Colorado floods, in Proceedings of the Information Systems for Crisis Response and Management Conference (ISCRAM’14), University Park, PA, May 2014. [Google Scholar]
- 39.Earle P. S., Bowden D. C., Guy M., Twitter earthquake detection: Earthquake monitoring in a social world. Ann. Geophys. 54, 708–715 (2011). [Google Scholar]
- 40.T. Sakaki, M. Okazaki, Y. Matsuo, Earthquake shakes Twitter users: Real-time event detection by social sensors, in Proceedings of the Nineteenth International Conference on World Wide Web (WWW’10), Raleigh, NC, 26 to 30 April 2010. [Google Scholar]
- 41.S. Kumar, X. Hu, H. Liu, A behavior analytics approach to identifying tweets from crisis regions, in Proceedings of the 25th ACM Conference on Hypertext and Social Media (HT’14), Santiago, Chile, 1 to 4 September 2014. [Google Scholar]
- 42.M. Imran, S. M. Elbassuoni, C. Castillo, F. Diaz, P. Meier, Extracting information nuggets from disaster-related messages in social media, in Proceedings of the Tenth International Conference on Information Systems for Crisis Response and Management (ISCRAM’13), Baden-Baden, DE, 12 to 15 May 2013. [Google Scholar]
- 43.C. Caragea, N. McNeese, A. Jaiswal, G. Traylor, H.-W. Kim, P. Mitra, D. Wu, A. H. Tapia, L. Giles, B. J. Jansen, Classifying text messages for the Haiti earthquake, in Proceedings of the Eighth International Conference on Information Systems for Crisis Response and Management (ISCRAM’11), Lisbon, Portugal, 8 to 11 May 2011. [Google Scholar]
- 44.Kryvasheyeu Y., Chen H., Moro E., Van Hentenryck P., Cebrian M., Performance of social network sensors during Hurricane Sandy. PLoS One 10, e0117288 (2015). [DOI] [PMC free article] [PubMed] [Google Scholar]
- 45.Wang Q., Taylor J. E., Quantifying human mobility perturbation and resilience in Hurricane Sandy. PLoS One 9, e112608 (2014). [DOI] [PMC free article] [PubMed] [Google Scholar]
- 46.Wang Q., Taylor J. E., Resilience of human mobility under the influence of typhoons. Proc. Eng. 118, 942–949 (2015). [Google Scholar]
- 47.Gao H., Barbier G., Goolsby R., Harnessing the crowdsourcing power of social media for disaster relief. IEEE Intell. Syst. 26, 10–14 (2011). [Google Scholar]
- 48.Preis T., Moat H. S., Bishop S. R., Treleaven P., Stanley H. E., Quantifying the digital traces of Hurricane Sandy on Flickr. Sci. Rep. 3, 3141 (2013). [DOI] [PMC free article] [PubMed] [Google Scholar]
- 49.B. Herfort, J. P. de Albuquerque, S.-J. Schelhorn, A. Zipf, Does the spatiotemporal distribution of tweets match the spatiotemporal distribution of flood phenomena? A study about the River Elbe flood in June 2013, in Proceedings of the 11th International Conference on Information Systems for Crisis Response and Management (ISCRAM’14), University Park, PA, 18 to 21 May 2014. [Google Scholar]
- 50.Guan X., Chen C., Using social media data to understand and assess disasters. Nat. Haz. 74, 837–850 (2014). [Google Scholar]
- 51.E. S. Blake, T. B. Kimberlain, R. J. Berg, J. P. Cangialosi, J. L. Beven II, Tropical Cyclone Report. Hurricane Sandy (AL182012), 22 to 29 October 2012 (National Hurricane Center, Miami, FL, 2013), 157 pp. [Google Scholar]
- 52.Bettencourt L., West G., A unified theory of urban living. Nature 467, 912–913 (2010). [DOI] [PubMed] [Google Scholar]
- 53.Bettencourt L. M. A., Lobo J., Helbing D., Kühnert C., West G. B., Growth, innovation, scaling, and the pace of life in cities. Proc. Natl. Acad. Sci. U.S.A. 104, 7301–7306 (2007). [DOI] [PMC free article] [PubMed] [Google Scholar]
- 54.Becker G. S., Glaeser E. L., Murphy K. M., Population and economic growth. Am. Econ. Rev. 89, 145–149 (1999). [Google Scholar]
- 55.Crane P., Kinzig A., Nature in the metropolis. Science 308, 1225 (2005). [DOI] [PubMed] [Google Scholar]
- 56.J. Jacobs, The Economy of Cities (Random House, New York, 1969), 288 pp. [Google Scholar]
- 57.F. S. Chapin, Human Activity Patterns in the City: Things People Do in Time and in Space (Wiley-Interscience, New York, 1974), 272 pp. [Google Scholar]
- 58.Scott A. J., The cultural economy of cities. Int. J. Urban Reg. Res. 21, 323–339 (1997). [Google Scholar]
- 59.Harrington J. R., Gelfand M. J., Tightness–looseness across the 50 united states. Proc. Natl. Acad. Sci. U.S.A. 111, 7990–7995 (2014). [DOI] [PMC free article] [PubMed] [Google Scholar]
- 60.National Hurricane Center, “NHC GIS archive—tropical cyclone best track” (AL182012) (2013); www.nhc.noaa.gov/gis/archive_besttrack_results.php?id=al18&year=2012&name=Hurricane SANDY
- 61.Van Hentenryck P., Gillani N., Coffrin C., Joint assessment and restoration of power systems. Front. Artif. Intell. Appl. 242, 792–797 (2012). [Google Scholar]
- 62.Federal Emergency Management Agency, “Archived housing assistance program data” (2014); www.fema.gov/media-library/assets/documents/30714?id=6963
- 63.Department of Banking and Insurance, State of New Jersey, Open Public Records Act data request #c91085 (2014).
- 64.Department of Financial Services, New York State, Freedom of Information Law request #2014-001128-NYC (2014).
- 65.S. Halpin, The Impact of Superstorm Sandy on New Jersey Towns and Households (Rutgers-Newark School of Public Affairs, New Jersey, 2013), 111 pp. [Google Scholar]
- 66.Howe P. D., Boudet H., Leiserowitz A., Maibach E. W., Mapping the shadow of experience of extreme weather events. Clim. Change 127, 381–389 (2014). [Google Scholar]
- 67.D. W. Chen, “FEMA to review all flood damage claims from Hurricane Sandy,” New York Times, 12 March 2015.
- 68.Lazer D., Kennedy R., King G., Vespignani A., The parable of Google Flu: Traps in Big Data analysis. Science 343, 1203–1205 (2014). [DOI] [PubMed] [Google Scholar]
- 69.F. Morstatter, J. Pfeffer, H. Liu, K. M. Carley, Is the sample good enough? Comparing data from Twitter’s streaming API with Twitter’s Firehose, in Proceedings of Seventh International AAAI Conference on Weblogs and Social Media (ICWSM’13), Boston, MA, 2013. [Google Scholar]
- 70.Dodds P. S., Harris K. D., Kloumann I. M., Bliss C. A., Danforth C. M., Temporal patterns of happiness and information in a global social network: Hedonometrics and Twitter. PLoS One 6, e26752 (2011). [DOI] [PMC free article] [PubMed] [Google Scholar]
- 71.Mitchell L., Frank M. R., Harris K. D., Dodds P. S., Danforth C. M., The geography of happiness: Connecting Twitter sentiment and expression, demographics, and objective characteristics of place. PLoS One 8, e64417 (2013). [DOI] [PMC free article] [PubMed] [Google Scholar]
- 72.J. Pennebaker, M. Francis, R. Booth, Linguistic Inquiry and Word Count (LIWC’01) (Erlbaum Publishers, Mahwah, NJ, 2001).
- 73.Thelwall M., Buckley K., Paltoglou G., Cai D., Kappas A., Sentiment strength detection in short informal text. J. Am. Soc. Inf. Sci. Technol. 61, 2544–2558 (2010). [Google Scholar]
Associated Data
This section collects any data citations, data availability statements, or supplementary materials included in this article.
Supplementary Materials
Supplementary material for this article is available at http://advances.sciencemag.org/cgi/content/full/2/3/e1500779/DC1
Table S1. List of keywords included in the analysis, with their corresponding message counts.
Table S2. Ranking of the keywords included in the analysis according to the strength of the correlation between distance and activity for East Coast cities.
Table S3. Activity-damage correlations across keywords in order of decreasing strength.
Table S4. Effect of normalization variable choice on the strength of activity-damage relationship (ZCTA resolution).
Table S5. County-level estimates of damage: Modeling (Hazus-MH) and ex-post data on insurance and FEMA individual assistance grants.
Table S6. Strength of activity-damage correlations for different damage estimates.
Table S7. Predictive power of sentiment, analyzed at different spatial resolutions and normalized by either area Census population or local Twitter user count (“Twitter population”).
Table S8. List of the disasters considered in the study, with a description of the damage data available for analysis.
Table S9. Effect of the activity threshold filter on the strength of the relationship between Twitter activity and damage.
Table S10. Mutual correlations between sentiment metrics at the level of individual messages.
Table S11. Top-ranking words by frequency of occurrence in positive and negative messages.
Table S12. Sentiment as a predictor of damage: Comparison between metrics.
Fig. S1. Normalized local activity on the topic as a function of distance to the hurricane path.
Fig. S2. Originality of content, expressed through the fraction of retweets in the stream of messages.
Fig. S3. Global popularity of local content.
Fig. S4. Comparison of predictive capacity of activity and sentiment.
Fig. S5. Comparison of activity-damage correlation strength for different precision levels of geo-location.
Fig. S6. Average sentiment trends over time: Comparison between sentiment metrics.