

A universal correlation is established between HOR/HER activity and hydrogen binding energy on platinum-group metals.
Keywords: Hydrogen oxidation and evolution reaction, electrocatalysis, Pt-group metals, hydrogen binding energy
Abstract
Understanding how pH affects the activity of hydrogen oxidation reaction (HOR) and hydrogen evolution reaction (HER) is key to developing active, stable, and affordable HOR/HER catalysts for hydroxide exchange membrane fuel cells and electrolyzers. A common linear correlation between hydrogen binding energy (HBE) and pH is observed for four supported platinum-group metal catalysts (Pt/C, Ir/C, Pd/C, and Rh/C) over a broad pH range (0 to 13), suggesting that the pH dependence of HBE is metal-independent. A universal correlation between exchange current density and HBE is also observed on the four metals, indicating that they may share the same elementary steps and rate-determining steps and that the HBE is the dominant descriptor for HOR/HER activities. The onset potential of CO stripping on the four metals decreases with pH, indicating a stronger OH adsorption, which provides evidence against the promoting effect of adsorbed OH on HOR/HER.
INTRODUCTION
The alkaline environment of hydroxide exchange membrane fuel cells and electrolyzers (HEMFCs and HEMELs, respectively) opens up the possibility of using nonprecious metals as catalysts; HEMFCs and HEMELs, in turn, become an affordable alternative to the precious metal-reliant proton exchange membrane fuel cells and electrolyzers (PEMFCs and PEMELs, respectively) (1–8). Only a negligible fraction of precious metal, as well as cost, is on the negative electrode in PEMFCs and PEMELs, owing to the extremely fast hydrogen oxidation reaction (HOR)/hydrogen evolution reaction (HER) kinetics in the acidic environment. However, the sluggish kinetics of HOR/HER in alkaline media—two orders of magnitude slower than that in acid on Pt (9–11), Ir (11), and Pd (11)—necessitates higher precious metal loadings on the negative electrode at equivalent overpotential and could offset, to a large extent, the lowered cost from the use of nonprecious metal–based catalysts on the positive electrode.
Despite recent discussion in the literature on the potential role of adsorbed OH for HOR in base (12, 13), hydrogen binding energy (HBE) has been shown to be the dominant descriptor for HER/HOR activity (11, 14–16). Volcano-shaped curves have been obtained when plotting HER activity versus HBE on various monometallic metals in base (14) as well as in acid (17–19), suggesting that an optimal HBE exists (Sabatier’s principle). Recent studies on the HOR/HER activity of Pt at different pH values suggest that the pH of electrolytes affects HOR activity by modifying the HBE of catalysts. For example, slower HOR/HER kinetics in base coincides with higher HBE calculated from cyclic voltammograms (CVs) (15). More recently, Wang et al. (16) have shown that PtRu alloy is twice as active as Pt for HOR in alkaline media in spite of the lower onset potential for adsorbed OH on the latter, indicating that the oxophilicity of catalysts does not play a major role in facilitating HOR. Despite growing evidence on specific systems, the general correlation between HOR activity and HBE and between HBE and pH among different metals remains to be elucidated. Establishing such correlations on precious metals, which are stable over a broad pH range and hence ideal model systems, will set the stage for the rational search for nonprecious metal–based HOR catalysts.
Here, we demonstrate the generality of the effect of pH (0 to 13) on HBE and, in turn, of HBE on HOR/HER activities, in terms of exchange current densities (i0), on supported platinum-group metal (Pt, Ir, Pd, and Rh) nanoparticles (Ru was not studied because it is susceptible to oxidation in the hydrogen adsorption/desorption potential region). We show that the HBE of each metal increases linearly with pH with a similar slope, indicating that the effect of pH on HBE is independent of metal. We also show that the log(i0) of each metal decreases linearly with HBE with a similar slope, which indicates a universal correlation of i0 with HBE and provides strong evidence that HBE is the dominant descriptor for HOR/HER activities. Furthermore, the onset potential for adsorbed OH, as indicated by CO stripping experiments, decreases monotonically with pH, indicating that the facilitating role of adsorbed OH in HOR is minimal.
RESULTS
pH-dependent HBEs of Pt/C, Ir/C, Pd/C, and Rh/C
Desorption peaks for underpotential deposited hydrogen (Hupd) on carbon-supported Pt, Ir, Pd, and Rh nanoparticles (Pt/C, Ir/C, Pd/C, and Rh/C) all shift to more positive potentials as the pH of the electrolyte increases, indicating that the increase of HBE with pH is a general trend (Fig. 1). The desorption peak potentials (Epeak) were obtained from the respective CVs recorded in buffered electrolytes with pH ranging from 0 to 13 (fig. S1). Two distinctive Hupd adsorption/desorption peaks corresponding to Pt(110) (located at a lower overpotential) and Pt(100) (located at a higher overpotential) are clearly visible in CVs of Pt/C (fig. S1A) over the entire pH range tested. Both peaks rise almost linearly with pH (0 to 13) (0.12 to 0.27 and 0.22 to 0.37 V for the 110 and 100 facets, respectively), with a slope of 13 mV/pH for Pt(110) and 12 mV/pH for Pt(100) (Fig. 1A), which corresponds reasonably well with reported values for polycrystalline Pt [10 mV/pH for Pt(110) and 8 mV/pH for Pt(100) (15) or ~11 mV/pH for both facets (20)] and high-index single-crystalline Pt [10 mV/pH for Pt(553) and Pt(533)] (21). Similar correlations between Epeak and pH were observed on Ir/C, Pd/C, and Rh/C (Fig. 1, B to D), with slopes of 9, 11, and 10 mV/pH for Ir/C, Pd/C, and Rh/C, respectively. The similar linear correlation and slope observed for all four metals suggest the generality of the effect of pH on Epeak. The positive shift of Epeak represents an increase in HBE from acid to base. Given the prominent role that HBE plays in determining the HOR/HER activities on monometallic Pt-group metal catalysts (15), it is likely that pH affects the HOR/HER activity mainly through the tuning of HBE, as shown for Pt/C, Ir/C, Pd/C, and Rh/C in the following section.
Fig. 1. Underpotential deposited hydrogen (Hupd) desorption peak potential as a function of pH.
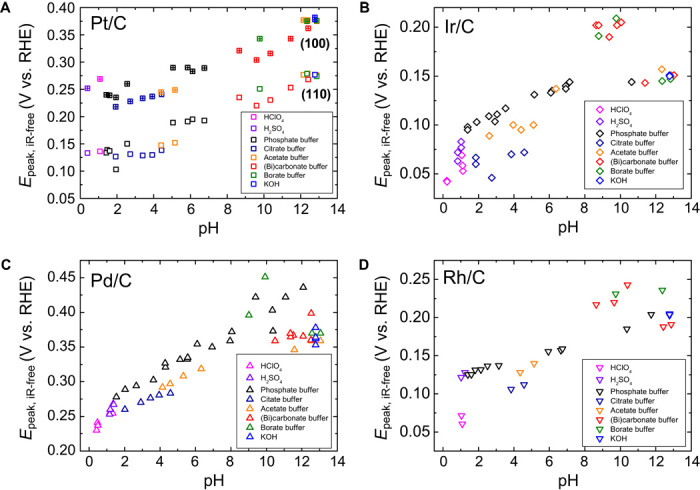
(A to D) Hupd desorption peak potentials from CVs of (A) Pt/C, (B) Ir/C, (C) Pd/C, and (D) Rh/C as a function of pH.
pH-dependent HOR/HER activities on Pt/C, Ir/C, Pd/C, and Rh/C
The HOR/HER activities on Pt/C, Ir/C, Pd/C, and Rh/C, determined using the rotating disk electrode (RDE) method, decrease monotonically with rising pH (Fig. 2), consistent with the theory that higher HBE suppresses catalytic performance. We used buffer solutions to avoid the deviation of pH at the electrode surface from the bulk (22) so that reliable kinetic data could be obtained (15). We used multiple buffer solutions, that is, phosphoric acid/phosphate, citric acid/citrate, acetic acid/acetate, carbonate/bicarbonate, and boric acid/borate, and their effectiveness in eliminating local concentration was confirmed by the lack of a plateau in the HER portion of the HOR/HER polarization curves (figs. S2 to S5). Exchange current densities (i0), which represent the intrinsic HOR/HER activities, were obtained by normalizing to the electrochemical surface area of the catalysts (figs. S2 to S6) in the same electrolyte used for activity measurements. The log(i0) of all four catalysts decreases monotonically with pH (Fig. 2). Because the HBE of the four metals increases with pH, our results confirm that higher HBE leads to lower HOR/HER activities, thus providing strong evidence supporting HBE as the dominant performance descriptor for HOR/HER catalysts. In addition, only small variations were observed for both Epeak and HOR/HER activities measured in different buffer solutions with similar pH values (Figs. 1 and 2), indicating that the nature and adsorption of anions do not have any significant effect on the results. This finding is reasonable because anion adsorption typically occurs above the potential of zero charge (PZC), ~0.57 V versus reversible hydrogen electrode (RHE) for Pt (23), whereas HOR/HER proceeds below the PZC. Our i0 values of Pt/C, Ir/C, Pd/C, and Rh/C at 293 K at low pH are in agreement with those measured in an H2-pump with a PEMFC configuration, wherein pH is presumed to be zero and reactions are, in principle, free of H2 transport limitation (gray stars in Fig. 2) (24). This agreement confirms the reliability of our activity measurements, especially for those in the acidic environment.
Fig. 2. Exchange current density of HOR/HER as a function of pH.
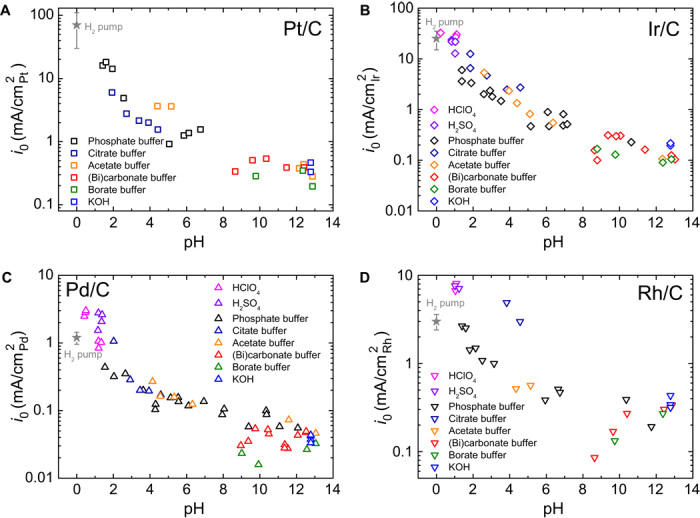
(A to D) Exchange current densities (i0) of HOR/HER on (A) Pt/C, (B) Ir/C, (C) Pd/C, and (D) Rh/C as a function of the pH of electrolytes. HOR/HER polarization curves were measured using the RDE method in H2-saturated electrolytes at a scanning rate of 1 mV/s and a rotation speed of 1600 rpm at 293 K. Gray stars represent HOR/HER exchange current densities at 293 K estimated from the Arrhenius plot of Durst et al. (24), in which all activities were measured using an H2-pump configuration.
Universal correlation between HOR/HER activity and HBE
A universal linear correlation between log(i0) and Epeak (that is, HBE) is obtained for Pt/C, Ir/C, Pd/C, and Rh/C (Fig. 3). The x axis in Fig. 3 (Epeak) can be converted to HBE according to the formula (25). From the Arrhenius equation and the Brønsted-Evans-Polanyi (BEP) relation, we can derive the following equation (see the Supplementary Materials)
| (1) |
where A is the preexponential coefficient, β characterizes the position of transition state along the reaction coordinate (0 < β < 1), F is the Faraday constant (96,485 C/mol), R is the gas constant [8.314 J/(mol K)], and T is the temperature in kelvin. This equation is used to fit the log(i0) versus Epeak data (fig. S7) to obtain A and β (Table 1). Similar β values (0.5 to 0.8) support the fact that a similar HOR/HER mechanism is at play on all four metals. The preexponential coefficients (A) of Pt/C, Ir/C, Pd/C, and Rh/C are also on the same order of magnitude (36 to 59) (Table 1). Note that the Epeak for Pd/C in Fig. 1 is derived from the second peak because the first peak is not well defined from CVs in most of the electrolytes. Our previous work showed that the sites with weakest HBE were the most active sites for HOR/HER (25); therefore, the lowest Epeak is the best descriptor to correlate with activity and should be used for the correlation. On the basis of the observation that the peak potential difference between the first and second Hupd desorption peaks on Pd/C in certain electrolytes is around 0.08 V (fig. S4) and the assumption that the peak potential difference remains roughly the same in all pH values, as demonstrated in the case of Pt(110) and Pt(100), the potential of the first Epeak of Pd/C (Fig. 3) is estimated as follows: Epeak, first ≈ Epeak, second − 0.08 V.
Fig. 3. Correlation between the exchange current density of HOR/HER and Hupd desorption peak potential.

Exchange current densities of HOR/HER on Pt/C, Ir/C, Pd/C, and Rh/C as a function of the lowest underpotential-deposited hydrogen (Hupd) desorption peak potential (Epeak) from CVs. The gray dashed line represents linear fitting of all data points.
Table 1. Summary of β and A.
β and A from fitting i0 to Epeak using the expression , activation energy (Ea) measured using the RDE method in 0.1 M KOH from this work and an H2-pump configuration from the study of Durst et al. (24), difference in Hupd desorption peak potentials (ΔEpeak) in 0.1 M KOH and acid with pH 0, and βEa calculated as [Ea (0.1 M KOH) − Ea (H2 pump)]/FΔEpeak.
| Ea (kJ/mol) | ΔEpeak (V) | βEa | ||||
| β | A | 0.1 M KOH | H2 pump (pH 0) (24) | |||
| Pt/C | 0.5 | 59 | 29.6 ± 0.4 | 16 ± 2 | 0.17 | 0.8 |
| Ir/C | 0.8 | 68 | 32.8 ± 0.4 | 19 ± 3 | 0.20 | 0.7 |
| Pd/C | 0.6 | 37 | 38.9 ± 3.0 | 31 ± 2 | 0.14 | 0.6 |
| Rh/C | 0.6 | 36 | 26.6 ± 0.7 | 28 ± 1 | — | — |
Activation energies (Ea) of HOR/HER on Pt/C, Ir/C, and Pd/C in 0.1 M KOH were determined using the RDE method in this work (fig. S8), and they are greater than those measured in H2 pumps presumed to be at pH 0 (24) (Table 1). Rh/C does not follow this trend, with similar Ea observed in 0.1 M KOH and H2 pumps. Our activation value of 29.6 ± 0.4 kJ/mol on Pt/C in base is in agreement with reported values on polycrystalline Pt (28.9 ± 4.3 kJ/mol) and Pt/C (29.5 ± 4.0 kJ/mol) (10). An alternative independent method to obtain β for each metal could be derived from the definition of the BEP relation (eq. S1.2), from which Eq. 2 can be derived (see the Supplementary Materials)
| (2) |
where ΔEa is the activation energy difference between base and acid [Ea (0.1 M KOH) − Ea (H2 pump)] and ΔEpeak is the difference in Epeak between base and acid [Epeak (0.1 M KOH) − Epeak (0.1 M HClO4)]. The β values calculated by Eq. 2, denoted βEa (Table 1), correspond well with those obtained from log(i0) versus Epeak fitting, which validates the activity-Epeak correlation. Moreover, this correlation is consistent with the previous report that Pt(100) has higher HBE and activation energy for HOR/HER than does Pt(110) (26). Hence, it is reasonable to conclude that the higher activation barrier originates from its stronger HBE and is responsible for the slow HOR/HER kinetics in base.
pH-dependent CO stripping onset potentials
The onset potential of CO stripping on all four metals (Pt/C, Ir/C, Pd/C, and Rh/C) decreases monotonically with pH (Fig. 4), suggesting that coadsorbed OH is unlikely to play a major role in promoting HOR. There is an extensive debate on whether adsorbed OH enhances HOR/HER activity (10–13, 15, 16). The onset potential of CO stripping provides a sensitive measure of the lowest potential at which OHad is present on the surface and, thus, the binding energy of OHad, because OHad facilitates the removal of COad (16, 27). The onset potential of CO stripping on the four metals decreases with pH (Fig. 4 and figs. S9 to S12), indicating that OH tends to adsorb at a lower potential when the pH is higher. Therefore, if the presence of OHad promotes HOR, higher HOR activity would have been observed at higher pH. However, the opposite trend is observed in Fig. 2. Note that our CO stripping data agree with the results obtained by Gisbert et al. (28), with CO stripping on poly-oriented and single-crystal Pt over a wide range of pH (from 2 to 13) in phosphoric acid/phosphate buffer solution. Both the HOR/HER activities and oxophilicity of low-index single-crystal Pt facets have been observed to follow the same sequence of Pt(111) < Pt(100) < Pt(110) (29), which suggests that a more oxophilic surface processes higher activity (29). However, an alternative explanation is that Pt(110) is more active than Pt(100) because it has lower HBE (Fig. 1A). Similarly, the enhanced HOR/HER activity on PtRu as compared to Pt, which has been attributed to the higher oxophilicity of Ru (13), is likely induced by the weakened Pt-H bonding in the presence of neighboring Ru (16). The contradictory trend of HOR/HER activity versus oxophilicity discussed above points to the possibility of no inherent correlation between these two variables.
Fig. 4. CO onset potential as a function of pH.
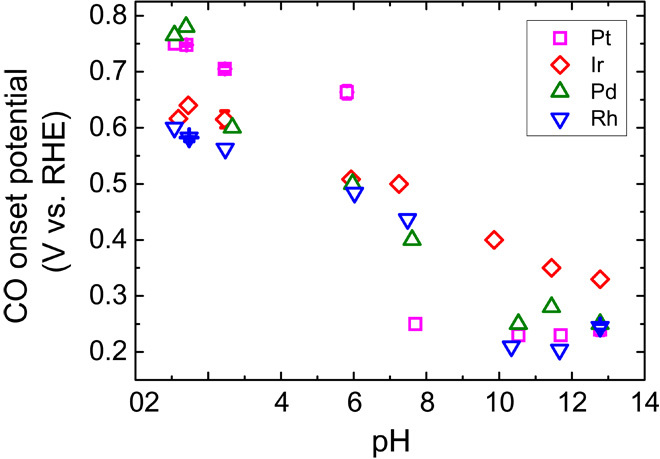
CO stripping onset potentials as a function of pH on Pt/C (magenta squares), Ir/C (red diamonds), Pd/C (olive up triangles), and Rh/C (blue down triangles).
DISCUSSION
HOR/HER (H2 ↔ 2H+ + 2e in acid and H2 + 2OH− ↔ 2H2O + 2e in base) is generally believed to proceed through either a Tafel-Volmer (Eqs. 3, 6, and 7) or a Heyrovskey-Volmer (Eqs. 4 to 7) pathway (30):
Tafel
| (3) |
Heyrovsky
In acid,
| (4) |
In base,
| (5) |
Volmer
In acid,
| (6) |
In base,
| (7) |
The universal correlation between i0 and HBE on the four metals indicates that HOR/HER on those metals may share the same reaction mechanism, that is, the same elementary steps and rate-determining step (RDS). The good fit of the data into the Butler-Volmer equation with αa + αc = 1 (figs. S2 to S5) suggests that the likely reaction mechanism is the Tafel-Volmer pathway, with the Volmer reaction being the RDS, because a Heyrovsky-Volmer mechanism would have resulted in αa + αc = 2 (31). Additional evidence for the Volmer reaction being the RDS includes (i) the excellent correlation between HOR/HER activity and HBE derived from the Hupd peak potential (11, 15) and (ii) the identical activities determined from HOR/HER measurements and Hupd charge transfer resistance (11).
A number of theories have been proposed to explain the slower kinetics of HOR/HER in alkaline than in acidic electrolytes. In early studies, Osetrova and Bagotsky (32) suggested that HOR/HER followed a different path in alkaline solutions, that is,through the formation of an H2+ intermediate rather than through the dissociative adsorption of H2. An alternative theory suggested that the formation of Had is more difficult from H2O than from H+, which leads to the sluggish kinetics for the reverse reaction of Eq. 7, as compared to that of Eq. 6 (33, 34). However, this hypothesis cannot be applied to HOR because H is abstracted from H2 instead of H+ or H2O. The potential effects of OHad on HOR in the potential region where OHad is present (above 0.4 V versus RHE based on CO stripping) are (i) site blocking, (ii) modification of HBE through Hupd/OHad interaction (29), and (iii) modification of HBE through Hupd/OH− interaction (15). Considering the higher activity in acid than in base (by two orders of magnitude), it is unlikely that the site blocking effect of OHad plays any major role in affecting HOR/HER activity with less than a twofold decrease in ECSA from acid to base. The tuning of HBE is more plausible, as a ~150-mV difference in Hupd desorption peak potentials has been observed between acid and base electrolytes. Sheng et al. (15) proposed that HBE was tuned by OH− in the solution phase instead of OHad on the basis of the bare existence of OHad at reversible HOR/HER potential.
Specific adsorption of anions was also found to affect H adsorption; for example, addition of Cl− affects the CV of Pt in sulfuric acid by inhibiting the strongly bonded H and shifting the overall curve to cathodic potentials (35). Similarly, Kinoshita et al. (36) attributed the stronger H adsorption on Pt in alkaline than in acidic electrolytes to the less extensive specific adsorption of OH− than HSO4−. However, this hypothesis cannot explain the difference in the HBE of Pt in HClO4 and KOH. ClO4− adsorption is weaker than that of OH−; however, the HBE of Pt in HClO4 is still weaker than that in KOH. Addition of KCl, K2SO4, and NaClO4 (adsorption strength in the order of Cl− > SO42− > ClO4−) (29) to 0.1 M KOH while keeping the pH constant leads to only minor changes in the Epeak (or HBE) (fig. S13, A, C, and E, and table S2) and exchange current densities (fig. S13, B, D, and F), which is consistent with the hypothesis that HBE is the dominant descriptor for HOR/HER activity. The similar dependence of HBE on pH for all four metals indicates that the mechanism through which pH affects HBE is likely to be metal-independent. In this regard, the presence of cations in the immediate vicinity of the electrode surface and their potential interaction with adsorbed H in alkaline electrolytes could be a possible mechanism (29, 37, 38).
Water, the most abundant species in the electrolyte, is ubiquitously adsorbed on the electrode interface (39), which could potentially affect the HOR/HER kinetics or metal-HBE. The presence of water was considered to have little impact on the Pt-H binding energy on the basis of the similar HBE determined electrochemically from temperature-dependent CVs in acid and measured from gas phase in ultrahigh vacuum (UHV) (39–41). However, stronger HBE is obtained in alkaline than in acidic electrolytes, which suggests that the connection between the HBE measured electrochemically and that obtained through UHV techniques may not hold across the whole pH range. Thus, the influence of water may not be excluded. Different orientations of adsorbed water, which is electrode potential– or surface charge–dependent, were mentioned by Trasatti (17), with the oxygen atom in the water molecule pointing toward the metal on a positively charged surface and in an opposite orientation on a negatively charged surface. In electrolytes with different pH values, the electrode surface potential differs in the SHE scale, which might lead to different extents in water dipole orientation or water dipole moments and consequently influence water adsorption/desorption energy. If we consider that the hydrogen adsorption/desorption process in electrolytes is accompanied by displacement/readsorption of water molecules, then the apparent HBE might be altered by the adsorption/desorption of water in electrolytes with different pH values. However, further research efforts are needed to evaluate this hypothesis.
The pH dependence of HBE and HOR/HER activities on Pt/C, Ir/C, Pd/C, and Rh/C has been mapped out with cyclic voltammetry and RDE methods in multiple buffer solutions with pH ranging from 0 to 13. Linear correlations between pH and HBE with a similar slope on all four catalysts suggest that the pH dependence of HBE is likely metal-independent. Log(i0) decreases linearly with pH and thus HBE, which is consistent with the hypothesis that HBE is the dominant descriptor for HOR/HER catalysts. Low onset potentials of adsorbed OH, characterized by CO stripping experiments, correlate with low HOR/HER activities, indicating that the oxophilicity of metals does not play a significant role in determining HOR/HER activities.
MATERIALS AND METHODS
Materials and characterization
Pt/C [5 weight percent (wt %) Pt supported on Vulcan XC-72, Premetek Co.], Ir/C (20 wt % Ir supported on Vulcan XC-72, Premetek Co.), Pd/C (20 wt % Pd supported on Vulcan XC-72, Premetek Co.), and Rh/C (20 wt % Rh supported on Vulcan XC-72, Premetek Co.) were obtained commercially and used as received. Their particle sizes and distributions were examined under a transmission electron microscope (TEM, JEOL 2010F, 200 kV). To prepare TEM samples, Pt/C, Ir/C, Pd/C, and Rh/C were first added into water and then ultrasonicated for 30 min to form uniform suspensions; a drop of each of the suspensions was then added onto Cu grids (lacy carbon–coated copper grids, Electron Microscopy Sciences) to obtain TEM samples. The diameters of more than 300 Pt, Ir, Pd, and Rh nanoparticles were measured, and their number-averaged sizes and distributions were calculated (fig. S14).
Preparation of electrolytes
Perchloric acid (HClO4; 0.1 and 1 M), sulfuric acid (H2SO4; 0.1 and 0.2 M), phosphoric acid (H3PO4; 0.2 M), and acetic acid (CH3COOH; 0.2 M) were prepared by diluting 70 wt % HClO4 (EMD), 95 wt % H2SO4 (EMD), 80 wt % H3PO4 (Sigma-Aldrich), and 99.9% CH3COOH (Sigma-Aldrich) with deionized water (18.2 megohms-cm). Potassium hydroxide (KOH; 0.1 and 4 M), citric acid (C6H8O7; 0.2 M), potassium bicarbonate (KHCO3; 0.2 M), and boric acid (H3BO3; 0.2 M) were prepared from KOH tablets (85 wt %, 99.99% metal trace, Sigma-Aldrich), C6H8O7 powder (99 wt %, Sigma-Aldrich), KHCO3 powder (99.7 wt %, Sigma-Aldrich), and H3BO3 powder (99 wt %, Sigma-Aldrich). Buffer solutions were prepared by adding different amounts (1 to 14 ml) of 4 M KOH into 100 ml of 0.2 M solution of C6H8O7, CH3COOH, H3PO4, KHCO3, and H3BO3.
Electrochemical measurements
Electrochemical measurements were performed in a three-electrode cell with a saturated calomel electrode (SCE; Princeton Applied Research) immersed in a Luggin capillary (Princeton Applied Research) filled with 2 M potassium nitrate (KNO3; Sigma-Aldrich) as the reference electrode, a Pt wire (PINE Instrument) as the counter electrode, and a glassy carbon (5-mm diameter, PINE Instrument) as the working electrode. Ink solutions of Pt/C (4 mgPt/ml), Ir/C (1 mgIr/ml), Pd/C (2 mgPd/ml), and Rh/C (1 mgRh/ml) were prepared by dispersing Pt/C, Ir/C, Pd/C, and Rh/C in 0.05 wt % Nafion isopropanol solution followed by ultrasonication for 1 hour. The thin-film electrodes were made by pipetting 2 μl of the ink solutions one, two, or four times onto prepolished glassy carbon electrodes with final metal loadings of 2 to 20 μgmetal/cm2disk. All reported potentials were converted to an RHE scale.
Cyclic voltammetry measurements for all samples were carried out in Ar-saturated 0.1 M KOH solution, followed by measurements in electrolytes with different pH values at a scanning rate of 50 mV/s. The surface areas of the Pt/C, Ir/C, Pd/C, and Rh/C electrodes were obtained from CVs. The surface areas of Pt, Ir, and Rh were determined from the hydrogen adsorption/desorption peaks with the subtraction of the double layer corresponding to charge densities of 210 μC/cm2Pt (35, 42), 218 μC/cm2Ir (35, 43), and 221 μC/cm2Rh (35, 44), respectively, whereas the surface area of Pd was determined from the PdO reduction peak at about 0.7 V, versus RHE from CVs recorded in the range of 0.07 to 1.25 V, versus RHE corresponding to a charge density of 424 μC/cm2Pd (see the Supplementary Materials and fig. S6) (35, 44).
HOR/HER activity measurements of all samples were performed in H2-saturated electrolytes with different pH values at a rotation speed of 1600 rpm. The scanning rate was initially set at 50 mV/s for about five cycles to achieve a stable polarization curve and then changed to 1 mV/s to minimize the influence of capacitance charge. The polarization curves at 1 mV/s were reported and used for calculation of exchange current densities (i0). The internal resistance (Rs) was measured by electrochemical impedance spectroscopy from 200 kHz to 100 mHz at open-circuit voltage, which was used to obtain the iR-free potential (EiR-free) according to the following equation
| (8) |
where E is the measured potential and I is the corresponding current.
The pH values of the electrolytes were calculated from the HOR/HER equilibrium potential (potential at current is equal to zero, ) as follows, based on the Nernst equation
| (9) |
where ESCE is the standard potential for SCE (0.241 V), R is the universal gas constant [8.314 J/(mol K)], T is the temperature in kelvin, and F is the Faraday constant (96,485 C/mol). The reliability of pH determination from the HOR/HER equilibrium potential is verified by its agreement with the corresponding theoretical calculated value (see the Supplementary Materials for detailed calculations and fig. S15).
The HOR/HER activity is represented using exchange current density (i0), which is obtained by fitting kinetic current (Ik) with the Butler-Volmer equation
| (10) |
where αa and αc are the transfer coefficients for HOR and HER, respectively, with αa + αc = 1; η is the overpotential; and As is the surface area of the samples.
Ik is calculated using Eqs. 11 and 12 (45)
| (11) |
| (12) |
where I is the measured current (in milliamperes); Id is the diffusion-limited current, defined in Eq. 12; and Il is the maximum current from polarization curves (in milliamperes).
CO stripping was performed by holding the electrode potential at 0.1 V versus RHE for 10 min in the flowing CO to reach a full monolayer of adsorbed CO on the metal surface and then switching to flow Ar for another 10 min to remove dissolved CO in the electrolyte, followed by cycling in the potential region similar to a normal CV scan at a scan rate of 20 mV/s; the first forward scan represents the stripping of a monolayer of CO. The CO stripping peak can also be used to determine the surface area corresponding to a charge density of 420 μC/cm2 (46).
Supplementary Material
Funding
The work was supported in part by the U.S. Department of Energy ARPA-E Program (DE-AR0000009). Author contributions: J.Z., B.X., and Y.Y. conceived the concept. J.Z. performed the experiments and data analysis. J.Z., B.X., and Y.Y. cowrote the paper. W.S. and Z.Z. participated in the discussion. Competing interests: The authors declare that they have no competing interests. Data and materials availability: All data needed to evaluate the conclusions in the paper are present in the paper and/or the Supplementary Materials. Additional data are available from the authors upon request.
SUPPLEMENTARY MATERIALS
Supplementary material for this article is available at http://advances.sciencemag.org/cgi/content/full/2/3/e1501602/DC1
Derivation of relationship between i0 and Epeak
Cyclic voltammograms of Pt/C, Ir/C, Pd/C, and Rh/C at different pH values
CVs and HOR/HER polarization curves at different pH values
Cyclic voltammograms (CVs)
Correlation of exchange current densities with Epeak
Arrhenius plot
CO stripping in electrolytes with different pH values
Effect of anions on HOR/HER activities
TEM images of supported metal electrocatalysts
Procedure for calculating pH for buffer solutions and comparison between calculated and experimental values
HOR/HER polarization curves on Vulcan XC-72 in electrolytes with different pH values
Fig. S1. CVs of Pt/C, Ir/C, Pd/C, and Rh/C at different pH values.
Fig. S2. CVs and HOR/HER polarization curves at different pH values on Pt/C.
Fig. S3. CVs and HOR/HER polarization curves at different pH values on Ir/C.
Fig. S4. CVs and HOR/HER polarization curves at different pH values on Pd/C.
Fig. S5. CVs and HOR/HER polarization curves at different pH values on Rh/C.
Fig. S6. CVs of Pt/C, Ir/C, Pd/C, and Rh/C in 0.1 M KOH.
Fig. S7. Correlation of exchange current densities with Epeak.
Fig. S8. Arrhenius plots of HOR/HER activities.
Fig. S9. CO stripping profiles on Pt/C at different pH values.
Fig. S10. CO stripping profiles on Ir/C at different pH values.
Fig. S11. CO stripping profiles on Pd/C at different pH values.
Fig. S12. CO stripping profiles on Rh/C at different pH values.
Fig. S13. Effect of anions on HOR/HER activities.
Fig. S14. TEM images and histograms of Pt, Ir, Pd, and Rh/C.
Fig. S15. Comparison of calculated and electrochemically measured pH of the electrolytes.
Fig. S16. HOR/HER polarization curves on Vulcan XC-72.
Table S1. Particle size and surface area of Pt/C, Ir/C, Pd/C, and Rh/C.
Table S2. Effect of anions on Hupd peak potentials and HOR/HER exchange current densities.
REFERENCES AND NOTES
- 1.Jaramillo T. F., Jørgensen K. P., Bonde J., Nielsen J. H., Horch S., Chorkendorff I., Identification of active edge sites for electrochemical H2 evolution from MoS2 nanocatalysts. Science 317, 100–102 (2007). [DOI] [PubMed] [Google Scholar]
- 2.Popczun E. J., McKone J. R., Read C. G., Biacchi A. J., Wiltrout A. M., Lewis N. S., Schaak R. E., Nanostructured nickel phosphide as an electrocatalyst for the hydrogen evolution reaction. J. Am. Chem. Soc. 135, 9267–9270 (2013). [DOI] [PubMed] [Google Scholar]
- 3.Kibsgaard J., Jaramillo T. F., Molybdenum phosphosulfide: An active, acid-stable, earth-abundant catalyst for the hydrogen evolution reaction. Angew. Chem. Int. Ed. 53, 14433–14437 (2014). [DOI] [PubMed] [Google Scholar]
- 4.Kong D., Wang H., Lu Z., Cui Y., CoSe2 nanoparticles grown on carbon fiber paper: An efficient and stable electrocatalyst for hydrogen evolution reaction. J. Am. Chem. Soc. 136, 4897–4900 (2014). [DOI] [PubMed] [Google Scholar]
- 5.Liao L., Wang S., Xiao J., Bian X., Zhang Y., Scanlon M. D., Hu X., Tang Y., Liua B., Giraultb H. H., A nanoporous molybdenum carbide nanowire as an electrocatalyst for hydrogen evolution reaction. Energy Environ. Sci. 7, 387–392 (2014). [Google Scholar]
- 6.Popczun E. J., Read C. G., Roske C. W., Lewis N. S., Schaak R. E., Highly active electrocatalysis of the hydrogen evolution reaction by cobalt phosphide nanoparticles. Angew. Chem. Int. Ed. 53, 5427–5430 (2014). [DOI] [PubMed] [Google Scholar]
- 7.Sheng W., Bivens A. P., Myint M., Zhuang Z., Forest R. V., Fang Q., Chen J. G., Yan Y., Non-precious metal electrocatalysts with high activity for hydrogen oxidation reaction in alkaline electrolytes. Energy Environ. Sci. 7, 1719–1724 (2014). [Google Scholar]
- 8.Zheng Y., Jiao Y., Zhu Y., Li L. H., Han Y., Chen Y., Du A., Jaroniec M., Qiao S. Z., Hydrogen evolution by a metal-free electrocatalyst. Nat. Commun. 5, 3783 (2014). [DOI] [PubMed] [Google Scholar]
- 9.Neyerlin K. C., Gu W., Jorne J., Gasteiger H. A., Study of the exchange current density for the hydrogen oxidation and evolution reactions. J. Electrochem. Soc. 154, B631–B635 (2007). [Google Scholar]
- 10.Sheng W., Gasteiger H. A., Shao-Horn Y., Hydrogen oxidation and evolution reaction kinetics on platinum: Acid vs alkaline electrolytes. J. Electrochem. Soc. 157, B1529–B1536 (2010). [Google Scholar]
- 11.Durst J., Siebel A., Simon C., Hasché F., Herranz J., Gasteiger H. A., New insights into the electrochemical hydrogen oxidation and evolution reaction mechanism. Energy Environ. Sci. 7, 2255–2260 (2014). [Google Scholar]
- 12.Koper M. T. M., Hydrogen electrocatalysis: A basic solution. Nat. Chem. 5, 255–256 (2013). [DOI] [PubMed] [Google Scholar]
- 13.Strmcnik D., Uchimura M., Wang C., Subbaraman R., Danilovic N., van der Vliet D., Paulikas A. P., Stamenkovic V. R., Markovic N. M., Improving the hydrogen oxidation reaction rate by promotion of hydroxyl adsorption. Nat. Chem. 5, 300–306 (2013). [DOI] [PubMed] [Google Scholar]
- 14.Sheng W., Myint M., Chen J. G., Yan Y., Correlating the hydrogen evolution reaction activity in alkaline electrolytes with the hydrogen binding energy on monometallic surfaces. Energy Environ. Sci. 6, 1509–1512 (2013). [Google Scholar]
- 15.Sheng W., Zhuang Z., Gao M., Zheng J., Chen J. G., Yan Y., Correlating hydrogen oxidation and evolution activity on platinum at different pH with measured hydrogen binding energy. Nat. Commun. 6, 5848 (2015). [DOI] [PubMed] [Google Scholar]
- 16.Wang Y., Wang G., Li G., Huang B., Pan J., Liu Q., Han J., Xiao L., Lua J., Zhuanga L., Pt–Ru catalyzed hydrogen oxidation in alkaline media: Oxophilic effect or electronic effect? Energy Environ. Sci. 8, 177–181 (2015). [Google Scholar]
- 17.Trasatti S., Work function, electronegativity, and electrochemical behaviour of metals: III. Electrolytic hydrogen evolution in acid solutions. J. Electroanal. Chem. 39, 163–184 (1972). [Google Scholar]
- 18.Nørskov J. K., Bligaard T., Logadottir A., Kitchin J. R., Chen J. G., Pandelov S., Stimming U., Trends in the exchange current for hydrogen evolution. J. Electrochem. Soc. 152, J23–J26 (2005). [Google Scholar]
- 19.Durst J., Simon C., Siebel A., Rheinländer P. J., Schuler T., Hanzlik M., Herranz J., Hasché F., Gasteiger H. A., (Invited) hydrogen oxidation and evolution reaction (HOR/HER) on Pt electrodes in acid vs. alkaline electrolytes: Mechanism, activity and particle size effects. ECS Transactions 64, 1069–1080 (2014). [Google Scholar]
- 20.Gisbert R., García G., Koper M. T. M., Adsorption of phosphate species on poly-oriented Pt and Pt(111) electrodes over a wide range of pH. Electrochim. Acta 55, 7961–7968 (2010). [Google Scholar]
- 21.van der Niet M. J. T. C., Garcia-Araez N., Hernández J., Feliu J. M., Koper M. T. M., Water dissociation on well-defined platinum surfaces: The electrochemical perspective. Catal. Today 202, 105–113 (2013). [Google Scholar]
- 22.Auinger M., Katsounaros I., Meier J. C., Klemm S. O., Biedermann P. U., Topalov A. A., Rohwerdera M., Mayrhofer K. J. J., Near-surface ion distribution and buffer effects during electrochemical reactions. Phys. Chem. Chem. Phys. 13, 16384–16394 (2011). [DOI] [PubMed] [Google Scholar]
- 23.Gileadi E., Argade S. D., Bockris J. O’M., The potential of zero charge of platinum and its pH dependence. J. Phys. Chem. 70, 2044–2046 (1966). [Google Scholar]
- 24.Durst J., Simon C., Hasché F., Gasteiger H. A., Hydrogen oxidation and evolution reaction kinetics on carbon supported Pt, Ir, Rh, and Pd electrocatalysts in acidic media. J. Electrochem. Soc. 162, F190–F203 (2015). [Google Scholar]
- 25.Zheng J., Zhuang Z., Xu B., Yan Y., Correlating hydrogen oxidation/evolution reaction activity with the minority weak hydrogen-binding sites on Ir/C catalysts. ACS Catal. 5, 4449–4455 (2015). [Google Scholar]
- 26.Markovic N. M., Grgur B. N., Ross P. N., Temperature-dependent hydrogen electrochemistry on platinum low-index single-crystal surfaces in acid solutions. J. Phys. Chem. B 101, 5405–5413 (1997). [Google Scholar]
- 27.Zhuang L., Jin J., Abruña H. D., Direct observation of electrocatalytic synergy. J. Am. Chem. Soc. 129, 11033–11035 (2007). [DOI] [PubMed] [Google Scholar]
- 28.Gisbert R., García G., Koper M. T. M., Oxidation of carbon monoxide on poly-oriented and single-crystalline platinum electrodes over a wide range of pH. Electrochim. Acta 56, 2443–2449 (2011). [Google Scholar]
- 29.N. M. Marković, in Handbook of Fuel Cells (Wiley, New York, 2010). [Google Scholar]
- 30.M. W. Breiter, in Handbook of Fuel Cells (Wiley, New York, 2010), vol. 2, chap. 25, pp. 361–367. [Google Scholar]
- 31.Rheinländer P. J., Herranz J., Durst J., Gasteiger H. A., Kinetics of the hydrogen oxidation/evolution reaction on polycrystalline platinum in alkaline electrolyte reaction order with respect to hydrogen pressure. J. Electrochem. Soc. 161, F1448–F1457 (2014). [Google Scholar]
- 32.Osetrova N. V., Bagotzky V. S., Electrokhimiya 9, 1527 (1973). [Google Scholar]
- 33.Barber J. H., Conway B. E., Structural specificity of the kinetics of the hydrogen evolution reaction on the low-index surfaces of Pt single-crystal electrodes in 0.5 M dm−3 NaOH1. J. Electroanal. Chem. 461, 80–89 (1999). [Google Scholar]
- 34.Schouten K. J. P., van der Niet M. J. T. C., Koper M. T. M., Impedance spectroscopy of H and OH adsorption on stepped single-crystal platinum electrodes in alkaline and acidic media. Phys. Chem. Chem. Phys. 12, 15217–15224 (2010). [DOI] [PubMed] [Google Scholar]
- 35.R. Woods, in Electroanalytical Chemistry: A Series of Advances (Dekker, New York, 1976), vol. 9, pp. 1–162. [Google Scholar]
- 36.Kinoshita K., Ferrier D. R., Stonehart P., Effect of electrolyte environment and Pt crystallite size on hydrogen adsorption—V. Electrochim. Acta 23, 45–54 (1978). [Google Scholar]
- 37.Slygin A., Frumkin A. N., Acta Physicochim. URSS 3, 791 (1935). [Google Scholar]
- 38.A. N. Frumkin, in Advances in Electrochemistry and Electrochemical Engineering, D. P., Ed. (Wiley-Interscience, New York, 1963), vol. 3, chap. 5. [Google Scholar]
- 39.Conway B. E., Jerkiewicz G., Relation of energies and coverages of underpotential and overpotential deposited H at Pt and other metals to the ‘volcano curve’ for cathodic H2 evolution kinetics. Electrochim. Acta 45, 4075–4083 (2000). [Google Scholar]
- 40.Jerkiewicz G., Zolfaghari A., Comparison of hydrogen electroadsorption from the electrolyte with hydrogen adsorption from the gas phase. J. Electrochem. Soc. 143, 1240–1248 (1996). [Google Scholar]
- 41.Zolfaghari A., Jerkiewicz G., Temperature-dependent research on Pt(111) and Pt(100) electrodes in aqueous H2SO4. J. Electroanal. Chem. 467, 177–185 (1999). [Google Scholar]
- 42.Biegler T., Rand D. A. J., Woods R., Limiting oxygen coverage on platinized platinum; Relevance to determination of real platinum area by hydrogen adsorption. J. Electroanal. Chem. 29, 269–277 (1971). [Google Scholar]
- 43.Woods R., Hydrogen adsorption on platinum, iridium and rhodium electrodes at reduced temperatures and the determination of real surface area. J. Electroanal. Chem. 49, 217–226 (1974). [Google Scholar]
- 44.Rand D. A. J., Woods R., The nature of adsorbed oxygen on rhodium, palladium and gold electrodes. J. Electroanal. Chem. 31, 29–38 (1971). [Google Scholar]
- 45.Zheng J., Yan Y., Xu B., Correcting the hydrogen diffusion limitation in rotating disk electrode measurements of hydrogen evolution reaction kinetics. J. Electrochem. Soc. 162, F1470–F1481 (2015). [Google Scholar]
- 46.L. S. Sarma, F. Taufany, B.-J. Hwang, in Electrocatalysis of Direct Methanol Fuel Cells (Wiley-VCH Verlag GmbH & Co. KGaA, Weinheim, 2009), pp. 115–163. [Google Scholar]
Associated Data
This section collects any data citations, data availability statements, or supplementary materials included in this article.
Supplementary Materials
Supplementary material for this article is available at http://advances.sciencemag.org/cgi/content/full/2/3/e1501602/DC1
Derivation of relationship between i0 and Epeak
Cyclic voltammograms of Pt/C, Ir/C, Pd/C, and Rh/C at different pH values
CVs and HOR/HER polarization curves at different pH values
Cyclic voltammograms (CVs)
Correlation of exchange current densities with Epeak
Arrhenius plot
CO stripping in electrolytes with different pH values
Effect of anions on HOR/HER activities
TEM images of supported metal electrocatalysts
Procedure for calculating pH for buffer solutions and comparison between calculated and experimental values
HOR/HER polarization curves on Vulcan XC-72 in electrolytes with different pH values
Fig. S1. CVs of Pt/C, Ir/C, Pd/C, and Rh/C at different pH values.
Fig. S2. CVs and HOR/HER polarization curves at different pH values on Pt/C.
Fig. S3. CVs and HOR/HER polarization curves at different pH values on Ir/C.
Fig. S4. CVs and HOR/HER polarization curves at different pH values on Pd/C.
Fig. S5. CVs and HOR/HER polarization curves at different pH values on Rh/C.
Fig. S6. CVs of Pt/C, Ir/C, Pd/C, and Rh/C in 0.1 M KOH.
Fig. S7. Correlation of exchange current densities with Epeak.
Fig. S8. Arrhenius plots of HOR/HER activities.
Fig. S9. CO stripping profiles on Pt/C at different pH values.
Fig. S10. CO stripping profiles on Ir/C at different pH values.
Fig. S11. CO stripping profiles on Pd/C at different pH values.
Fig. S12. CO stripping profiles on Rh/C at different pH values.
Fig. S13. Effect of anions on HOR/HER activities.
Fig. S14. TEM images and histograms of Pt, Ir, Pd, and Rh/C.
Fig. S15. Comparison of calculated and electrochemically measured pH of the electrolytes.
Fig. S16. HOR/HER polarization curves on Vulcan XC-72.
Table S1. Particle size and surface area of Pt/C, Ir/C, Pd/C, and Rh/C.
Table S2. Effect of anions on Hupd peak potentials and HOR/HER exchange current densities.