

The San Andreas and San Jacinto faults likely slipped together in a single earthquake in 1812 and are capable of doing so again.
Keywords: San Andreas Fault, San Jacinto Fault, fault interactions, California earthquakes, earthquake physics, earthquake modeling, interpretation of paleoseismic data, southern California earthquake hazard, historic earthquakes, multi-fault rupture
Abstract
The San Andreas fault is considered to be the primary plate boundary fault in southern California and the most likely fault to produce a major earthquake. I use dynamic rupture modeling to show that the San Jacinto fault is capable of rupturing along with the San Andreas in a single earthquake, and interpret these results along with existing paleoseismic data and historic damage reports to suggest that this has likely occurred in the historic past. In particular, I find that paleoseismic data and historic observations for the ~M7.5 earthquake of 8 December 1812 are best explained by a rupture that begins on the San Jacinto fault and propagates onto the San Andreas fault. This precedent carries the implications that similar joint ruptures are possible in the future and that the San Jacinto fault plays a more significant role in seismic hazard in southern California than previously considered. My work also shows how physics-based modeling can be used for interpreting paleoseismic data sets and understanding prehistoric fault behavior.
INTRODUCTION
The ~M7.5 earthquake of 8 December 1812 is one of the earliest large earthquakes described in the history of California. It caused the fatal collapse of a part of Mission San Juan Capistrano, major structural damage at Mission San Gabriel, and minor damage at Missions San Fernando Rey and San Buenaventura to the north (Fig. 1). To the south, Missions San Luis Rey and San Diego experienced shaking without notable damage (1, 2). Because of this intensity pattern, the 1812 earthquake was initially attributed to the Newport-Inglewood fault (3), but a study of growth rings in trees whose roots cross the San Andreas fault (SAF) reattributed the 1812 event to the San Andreas (4).
Fig. 1. Records of the 1812 earthquake.
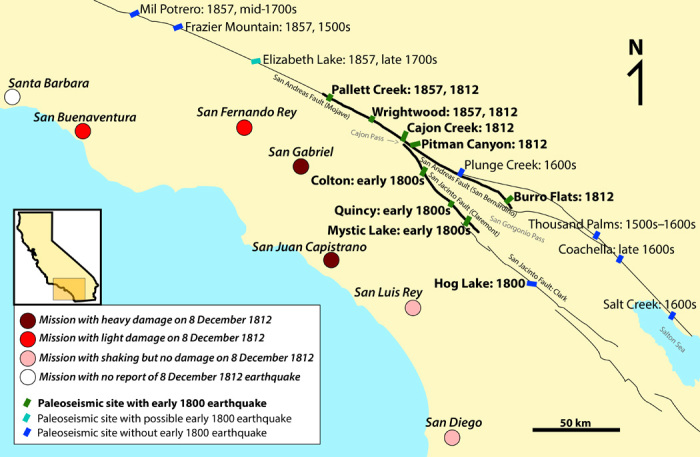
The SAF and SJF are shown in black; bold lines represent the fault sections modeled here. Paleoseismic sites are listed with their most recent ruptures. On the SAF, Pallett Creek (5), Wrightwood (6, 7), Cajon Creek (8), Pitman Canyon (9, 10), and Burro Flats (14) record the 1812 earthquake. To the north, Elizabeth Lake (11) may possibly record 1812, but Frazier Mountain (12) and Mil Potrero (13) do not. The 1812 rupture did not extend south of San Gorgonio Pass; there is no evidence for slip in this time period at Thousand Palms (15), Coachella (16), and Salt Creek (17). Plunge Creek (18) has no record of this earthquake. On the SJF, Colton (19), Quincy (20), Mystic Lake (21), and Hog Lake (22, 23) show early 1800 ruptures. Missions are marked with dots shaded to indicate reported damage (1–3).
Many paleoseismic trenching studies have corroborated the attribution of the 1812 earthquake to the SAF north of Cajon Pass (Fig. 1) (5–11). The northern extent of the surface rupture is well documented at Pallett Creek (4, 5) and may possibly extend to Elizabeth Lake (11), but does not reach as far north as Gorman (12, 13). The southern endpoint is not as well constrained. There is evidence for minor slip on secondary fault structures in the early 19th century at Burro Flats (14), the timing of which does not match records from any sites to the south of San Gorgonio Pass (15–17). However, the most recent earthquake recorded at the Plunge Creek site in the San Bernardino Valley, between Wrightwood and Burro Flats, dates to the mid-1600s (18).
Several recent paleoseismic studies on the San Jacinto fault (SJF), which ends within 1.5 km of the SAF at Cajon Pass, provide an additional interpretation for the southern extent of the 1812 rupture. The northernmost section of the SJF, the Claremont strand, had a large paleoseismic event in the early 19th century (Fig. 1) (19–21). The central SJF—the Clark strand, which is separated from the Claremont by a 25-km-long extensional stepover ranging between 2 and 5 km separation—also had a rupture in the early 1800s (22). This has been attributed to an earthquake on 22 November 1800, which damaged Missions San Juan Capistrano and San Diego, but is not described in the records of Missions further to the north (23). Thus, there are three discontinuous fault strands (Claremont SJF, Clark SJF, and Mojave/San Bernardino SAF) with similar paleoseismic dates, but only two large historic earthquakes in that time window. This implies that one of these ruptures propagated through a fault discontinuity.
I think it is unlikely that the 1800 earthquake ruptured both the Claremont and Clark strands of the SJF for several reasons. First, I have previously conducted dynamic rupture models on several different interpretations of the Claremont-Clark stepover geometry and have been unable to achieve model ruptures that propagate through the stepover while also producing slip values that are consistent with paleoseismic observations (24–26). The stepover is a persistent barrier. Second, these models indicate that rupture toward the stepover raises the chance of toppling a cluster of precariously balanced rocks (PBRs) near the stepover (26). A full-SJF 1800 rupture would propagate toward the stepover regardless of whether it nucleated in the north or in the south. Last, Mission San Gabriel has no record of the 1800 earthquake (1, 3), though it is closer to the Claremont SJF than Missions San Juan Capistrano and San Diego are to the Clark SJF.
The implausibility of the 1800 earthquake involving both the Claremont and Clark strands of the SJF leaves the implication that the 1812 earthquake may have ruptured across the 1.5-km-wide extensional stepover between the SJF and the SAF. This interpretation has been suggested in the past based entirely on geological data (20–22, 27), but physics-based modeling can provide a mechanism to explain those observations. Dynamic rupture modeling requires no assumptions about final slip distributions and rupture lengths, and instead calculates them physically, incorporating effects of realistic complexity in the fault and its surrounding geology. Dynamic models also produce time histories of stress change and ground motion that incorporate the full physics of rupture and wave propagation. Here, I use dynamic rupture modeling to investigate which stress conditions and rupture behaviors best reproduce and explain the historic and paleoseismic evidence for the 8 December 1812 earthquake.
FAULT MODEL
For both the SAF and SJF, I used a vertical fault geometry based on the U.S. Geological Survey (USGS) Quaternary Faults Database surface traces (28), but simplified to represent a smoother fault surface at depth. The northern edge of my model space corresponded with Pallett Creek, the northernmost paleoseismic site containing strong evidence for the 1812 rupture (5). The southern edge corresponded with the end of the San Bernardino strand of the SAF and the Claremont strand of the SJF. My mesh of this geometry is shown in Fig. 2.
Fig. 2. Finite element mesh for dynamic earthquake rupture models.
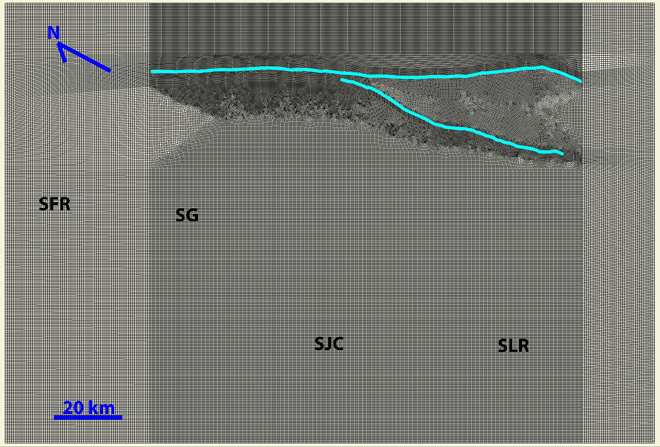
Map view of model geometry for the junction of the SAF and SJF, simplified from the USGS Quaternary Faults Database (37). Surface traces for both faults are marked in blue; this geometry extends vertically to depth. Locations of Missions that reported effects of the 8 December 1812 earthquake are marked with letters: SFR, San Fernando Rey; SG, San Gabriel; SJC, San Juan Capistrano; SLR, San Luis Rey.
I based my initial stresses on the seismicity-based regional stress field of Yang and Hauksson (29). Their inversion shows a sharp change in stress orientation on the SAF at Cajon Pass, with stresses south of the pass oriented 15° to 25° further to the west than sections north of the pass. Stresses on the SJF are more closely aligned with the average stress orientation for southern California than those on the SAF are. Although this is a current stress field, these stress heterogeneities are consistent with large-scale tectonic features [for example, the Big Bend in the SAF and the collision between the San Jacinto and San Bernardino mountains in San Gorgonio Pass (30)] and with long-term geologic observations of shifts in slip rate (31). Additionally, stress rotations from large earthquakes are short-lived (32), so the stress field before the large earthquakes of the early 1800s could arguably have been similar to the current interseismic stress field in southern California. Here, I used Yang and Hauksson’s (29) median stress orientation for the SAF north of Cajon Pass (N5E), SAF south of the pass (N15W), and the Claremont SJF (N12E). I tuned amplitudes of the principal stresses such that the resulting ruptures—whether or not they involve both the SAF and the SJF—have slip values consistent with observations at the paleoseismic sites listed in Table 1. The resulting on-fault initial stresses are shown in Fig. 3.
Table 1. Early 1800 slip at paleoseismic sites.
| Site | Slip |
| Pallett Creek (SAF) | 2–6 m (5) |
| Wrightwood (SAF) | 2.5–4.5 m (6, 7) |
| Cajon Creek (SAF) | ~4 m (8) |
| Pitman Canyon (SAF) | 3–4 m (9, 10) |
| Plunge Creek (SAF) | No evidence for early 1800 surface rupture (18) |
| Burro Flats (SAF) | Several centimeters of normal slip on a fault perpendicular to SAF (14) |
| Colton (SJF) | Large liquefaction features; slip not determined (19) |
| Quincy (SJF) | 1.8–3 m (20) |
| Mystic Lake (SJF) | 1.8–3 m (20, 21) |
Fig. 3. Initial on-fault stress conditions.
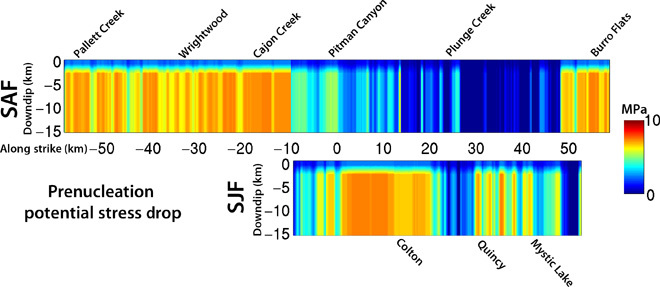
Warmer colors indicate regions of higher potential stress drop, which promotes more energetic rupture. The sharp contrast at −10 km along strike on the SAF represents a change in regional stress orientation (30). The other along-strike changes correspond to changes in fault strike. Potential stress drop tapers to zero over the top 3 km of the faults to account for reduced normal stress toward the free surface.
I nucleated my model ruptures at four different locations: on the SAF at the Pallett Creek paleoseismic site, on the SAF at the junction point with the SJF, on the SJF at the junction point, and on the SJF at the Mystic Lake paleoseismic site, all at a depth of 13 km.
RESULTS AND DISCUSSION
Most of my models produced multifault rupture of the SAF north of the junction and the SJF, regardless of where I placed the initial nucleation point. Dynamic unclamping of the SAF by rupture on the SJF, and vice versa, facilitates renucleation of rupture on the second fault (33, 34). The sharp reduction in potential stress drop on the SAF south of Cajon Pass, induced by the change in stress orientation, prevents rupture from propagating very far into this section of the fault (24, 35). This result holds true for a wide range of principal stress amplitudes. Some of my model ruptures did remain confined to one fault or the other, but in all of these cases, the amount of slip on either fault was not large enough to be consistent with the paleoseismic records for that fault alone.
Figure 4 shows plots of slip for the models that best matched the paleoseismic slip data, as listed in Table 1. All four nucleation points produce a good match to the data overall; each one fits better at some sites than at others. In all cases, slip at Pallett Creek skews low, but this is an effect of this site being close to the edge of the model. Slip at Pitman Canyon is most variable between models; scenarios in which the SJF ruptures first have lower slip at this site because dynamic stress reduction from the SJF rupture further reduces the potential stress drop on this portion of the SAF. Additionally, slip in all models may skew low at Pitman Canyon because of my implementation of the change in stress orientation as abrupt; a more gradual rotation would result in larger potential stress drop over a larger area. This would allow a rupture to take longer to come to a stop south of Cajon Pass, which may produce more slip at this site (35). Note that, for all four nucleation points, there is no rupture at Plunge Creek, but several centimeters of triggered slip at Burro Flats.
Fig. 4. Model slip distributions.
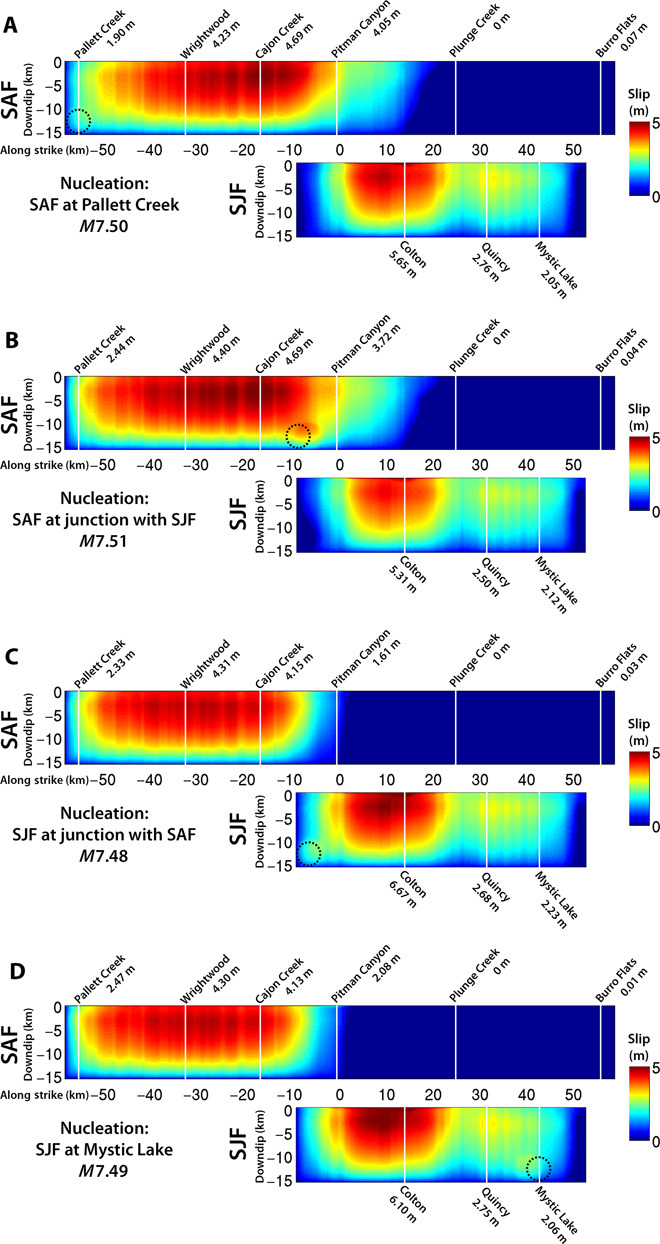
(A to D) Plots of total slip on the SAF and SJF for model ruptures with nucleation on the SAF at Pallett Creek (A), the SAF in Cajon Pass (B), the SJF in Cajon Pass (C), and the SJF at Mystic Lake (D). Paleoseismic sites are marked with white lines and listed with their surface slip value. The location of initial forced nucleation is indicated with the dashed black circle.
The fact that a model setup with a regional stress field on a realistic fault geometry produces multifault ruptures with realistic amounts of slip supports the general idea of joint SAF-SJF rupture in 1812. But because all four nucleation scenarios match the observations equally well in terms of slip, I cannot use that alone to determine where the rupture may have started. However, the pattern of damage to Spanish Missions provides some qualitative constraint on ground motion distribution (if not amplitude), as does the distribution of near-fault PBRs that were not toppled in 1812 (26, 27, 36).
Figure 5 shows Missions and PBRs plotted on top of low-frequency ground motion distributions corresponding to the ruptures in Fig. 4. Strong shaking from southward-directed rupture with nucleation on the SAF at Pallett Creek (Fig. 5A) misses many of the Missions and targets many of the PBRs, whereas the northward-directed case with nucleation on the SJF at Mystic Lake (Fig. 4D) best matches strong motion at Missions to the north and weaker motion at PBRs to the south. Bilateral ruptures with nucleation in Cajon Pass (Fig. 5, B and C) produce ground motion patterns that are consistent with the Mission records but inconsistent with PBRs near the southern end of the Claremont SJF that are sensitive to southward-directed rupture (26).
Fig. 5. Model ground motions.

(A to D) Plots of low-frequency (≤1 Hz) ground motions from model ruptures with nucleation on the SAF at Pallett Creek (A), the SAF in Cajon Pass (B), the SJF in Cajon Pass (C), and the SJF at Mystic Lake (D). The faults included in the model are marked by heavy black lines; the finer black lines represent the continuations of the SAF and SJF. The initial nucleation location is marked with a white star. Spanish Missions affected by the 8 December 1812 earthquake are marked with labeled circles, with darker red shading corresponding to more significant damage. Small white circles indicate the location of PBRs near the SAF (44) and SJF (26, 44).
Northward-directioned rupture propagation in the 8 December 1812 earthquake is also supported by modeled coseismic stress changes (37). On 21 December 1812, another large earthquake caused heavy damage at Missions Santa Barbara and Santa Inés and vicinity. This rupture is generally attributed to the left-reverse faults in the Transverse Ranges (3, 38, 39), which previous static stress change modeling suggests were brought closer to failure by the 8 December earthquake (39). Figure 6 shows snapshots of Coulomb stress changes from the dynamic model with nucleation on the SJF at Mystic Lake as resolved onto 80° NE-striking left-reverse faults. The end of model stress distribution (Fig. 6D) is consistent with the previous static models. Additionally, a large stress increase propagates ahead of the rupture front to the northwest (Fig. 6, B and C) into the Transverse Ranges. Although this propagating feature is not evident in the final static stress change distribution, it would still advance the state of shear stress on left-reverse faults that it passes, possibly influencing the 21 December rupture to happen when it did, as opposed to later. This northward-propagating dynamic stress increase does occur in my bilateral rupture models with nucleation in Cajon Pass (figs. S1 and S2), but it is absent in the purely southward-directed model with nucleation on the SAF at Pallett Creek (fig. S3). A second interpretation of the 21 December event is that it also occurred on the SAF itself, from Pallett Creek to Frazier Mountain (40). Paleoseismic evidence for this interpretation is not strong, but also cannot entirely be ruled out (11–13). My model results do allow for this interpretation of the 21 December event because all four of my 8 December scenarios cast a Coulomb stress increase on this portion of the SAF (fig. S4).
Fig. 6. Coulomb stress changes from a model rupture with nucleation on the SJF at Mystic Lake.

Snapshots of Coulomb stress changes, as resolved onto 80° NE-striking left-reverse faults. The faults included in the model are marked by heavy black lines; the finer black lines represent the continuations of the SAF and SJF. The left-reverse faults of the Transverse Ranges are indicated by orange lines. (A) Rupture has reached the northern end of the SJF and has jumped onto the SAF. (B) Rupture has reached the northern end of the modeled portion of the SAF, and a large stress increase propagates into the Transverse Ranges. (C and D) This stress increase continues to propagate in (C), but is no longer evident in (D), which represents the end-of-rupture state and would be a closest match to a static Coulomb stress change calculation.
This consideration of dynamic stress changes from the 8 December 1812 rupture on the region of the 21 December 1812 rupture still allows three equally plausible scenarios. However, considering the stress changes from the 22 November 1800 earthquake adds weight to the scenario with nucleation on the SJF at Mystic Lake. Regardless of directivity, a rupture of the full Clark SJF in 1800 would have placed the southern end of the Claremont SJF—which includes the Mystic Lake site—in a region of static stress increase, possibly advancing its clock for nucleation of another rupture. Considering all of these stress changes, a northward-propagating cluster of large events arises: 1800 on the Clark SJF, priming the southern Claremont SJF as a nucleation point for a joint SJF-SAF rupture on 8 December 1812, which in turn triggers the 21 December 1812 earthquake in the Transverse Ranges. The great San Andreas earthquake of 1857 also fits into this picture, as the southern end of its rupture extent overlaps the northern end of the 8 December 1812 rupture.
Thus, an 8 December 1812 rupture that begins on the SJF at Mystic Lake and propagates northward onto the SAF emerges as the most plausible scenario. The amount of slip in this model is consistent with paleoseismic observations; the ground motions are consistent with damage to Missions and preservation of PBRs; and pre-, co-, and post-seismic stress changes fit into a northward-directed sequence of large earthquakes in southern California in the early to mid-19th century.
IMPLICATIONS AND CONCLUSIONS
I have used dynamic rupture modeling to show that paleoseismic and historic observations associated with the earthquake of 8 December 1812 can be explained by joint rupture of the SAF and SJF. However, despite the good match between my results and the observational data, these are still merely models, and these conclusions are still only one possible interpretation. Because there are no instrumental recordings of the 8 December 1812 rupture, there is no way to know with absolute certainty where the rupture began and which way it propagated. That said, joint SAF-SJF rupture is already allowed in probabilistic models such as the Unified California Earthquake Rupture Forecast (31), and it arises in synthetic earthquake catalogs (41). However, this study presents a case that such a rupture has occurred in the historic past, and provides a physical mechanism for this fault behavior. This interpretation is also corroborated by recent comparison of longer-term paleoseismic records for the SAF and SJF—records for Claremont SJF and the SAF north of Cajon Pass match better over multiple events than the SAF matches itself on either side of the pass (42). The fact that this interpretation does both fit and explain the available data has several important implications.
First, primary plate boundary faults can participate in multifault ruptures. This must be considered when assessing maximum event sizes, probable locations for those events, and the resulting ground motions. The possibility of multifault rupture paths also affects how stress may be transferred through a region of complex faulting; a multifault rupture may affect different receiver faults than a single fault rupture would. Hence, close attention, in the form of analysis of observations and detailed modeling of fault behavior and stress transfer should be given to major fault junctions within the San Andreas system and around the world.
Second, the simplest interpretation of a paleoseismic record may not be the best interpretation. Particularly in regions with many active faults, reconstructions of paleoseismic rupture histories should consider all of the faults in a given region, rather than each individually. In California specifically, considering the possibility of large-scale multifault ruptures may also be a way to help reconcile the apparent discrepancy between a large number of paleoseismic surface ruptures and a small number of historic ones (31).
Last, physics-based modeling can be used to make sense of geological and historical observations and to check the plausibility of other interpretations of that data. Understanding which complex fault behaviors may have occurred in the past is important for assessing the hazard from future ruptures, regardless of how many faults are involved.
METHODS
I conducted my models using the three-dimensional finite element code FaultMod (43), which has performed well in comparisons with other dynamic rupture codes (44). My models implemented slip-weakening friction (45, 46) in an elastic medium. I meshed the SAF-SJF junction and surrounding region using the commercial finite element meshing software Trelis (see Fig. 2). The material properties of the mesh surrounding the faults were from the Southern California Earthquake Center Community Velocity Model (CVM-S) (47).
I resolved principal stress orientations from Yang and Hauksson (29) onto the mesh, which produced a heterogeneous pattern of on-fault stresses that varied along strike with changes in both fault and regional stress orientation. Down-dip, initial stresses were constant from the base of the fault at 16-km depth to 3 km below the surface, and were tapered to 0 MPa over the top 3 km of the fault to represent decreased confining stresses toward the surface (see Fig. 3). The principal stress values that produced the best fit to paleoseismic data are listed in Table 2, along with other physical and computational parameters.
Table 2. Physical and computational model input parameters.
SCEC, Southern California Earthquake Center.
| Parameter | Value |
| P-wave velocity | From SCEC CVM-S |
| S-wave velocity | From SCEC CVM-S |
| Density | From SCEC CVM-S |
| Static coefficient of friction | 0.6 |
| Dynamic coefficient of friction | 0.2 |
| Slip-weakening distance | 0.4 m |
| Vertical principal compressive stress | 30 MPa |
| North-south principal compressive stress | 36 MPa |
| East-west principal compressive stress | 12 MPa |
| SAF regional stress orientation | N5E (N of Cajon Pass); N15W (S of Cajon Pass) |
| SJF regional stress orientation | N12E |
| Element size | ~200 m (near field); ~400 m (far field) |
| Forced nucleation radius | 3 km |
I initiated my model ruptures by raising the shear stress at the nucleation site to 10% above the yield stress, then forcing propagation for a distance larger than the patch size required for self-sustaining rupture (48).
Supplementary Material
Acknowledgments
I would like to thank L. G. Ludwig, D. Yule, R. Harris, D. Oglesby, N. Onderdonk, T. Rockwell, and G. Beroza for discussions and feedback on this work, and M. Barall and K. Ryan for their help with FaultMod and Trelis. I would also like to thank K. Fischer, S. Hough, and two anonymous reviewers for their comments and suggestions on this manuscript. Funding: This research is supported by a National Science Foundation Earth Science Postdoctoral Fellowship under award EAR-PF-1250143. Author contributions: This is a single-author study. J.C.L. did all of the modeling, its interpretation, and the write-up thereof. Competing interests: The author declares that he has no competing interests. Data and materials availability: All data needed to evaluate the conclusions in the paper are present in the paper and/or the Supplementary Materials. Additional data related to this paper may be requested from the authors. No external data, aside from published paleoseismic and seismicity studies that are cited and referenced accordingly, were used in this study.
SUPPLEMENTARY MATERIALS
Supplementary material for this article is available at http://advances.sciencemag.org/cgi/content/full/2/3/e1500621/DC1
Fig. S1. Coulomb stress changes from a model rupture with nucleation on the SJF at Cajon Pass.
Fig. S2. Coulomb stress changes from a model rupture with nucleation on the SAF at Cajon Pass.
Fig. S3. Coulomb stress changes from a model rupture with nucleation on the SAF at Pallett Creek.
Fig. S4. Coulomb stress changes on the SAF.
REFERENCES AND NOTES
- 1.Townley S. D., Allen M. W., Descriptive catalog of earthquakes of the Pacific Coast of the United States 1769 to 1928. Bull. Seismol. Soc. Am. 29, 1–297 (1939). [Google Scholar]
- 2.C. W. Stover, J. L. Coffman, Seismicity of the United States, 1568-1989 (Revised) U.S. Geological Survey Professional Paper 1527 (U.S. Government Printing Office, Washington, DC, 1993). [Google Scholar]
- 3.T. R. Toppozada, C. R. Real, D. L. Parke, Preparation of Isoseismal Maps and Summaries of Reported Effects for Pre-1900 California Earthquakes: Annual Technical Report Fiscal Year 1980-1981 Covering the Period 1 August 1980 to 31 July 1981 (California Division of Mines and Geology, Sacramento, CA, 1981). [Google Scholar]
- 4.Jacoby G. C. Jr, Sheppard P. R., Sieh K. E., Irregular recurrence of large earthquakes along the San Andreas fault: Evidence from trees. Science 241, 196–199 (1988). [DOI] [PubMed] [Google Scholar]
- 5.Biasi G. P., Weldon R. J. II, Fumal T. E., Seitz G. G., Paleoseismic event dating and the conditional probability of large earthquakes on the southern San Andreas fault, California. Bull. Seismol. Soc. Am. 92, 2761–2781 (2002). [Google Scholar]
- 6.Weldon R. J. II, Fumal T. E., Powers T. J., Pezzopane S. K., Scharer K. M., Hamilton J. C., Structure and earthquake offsets on the San Andreas fault at the Wrightwood, California, paleoseismic site. Bull. Seismol. Soc. Am. 92, 2704–2725 (2002). [Google Scholar]
- 7.Fumal T. E., Weldon R. J. II, Biasi G. P., Dawson T. E., Seitz G. G., Frost W. T., Schwartz D. P., Evidence for large earthquakes on the San Andreas fault at the Wrightwood, California paleoseismic site: A.D. 500 to present. Bull. Seismol. Soc. Am. 92, 2726–2760 (2002). [Google Scholar]
- 8.Weldon R. J. II, Sieh K. E., Holocene rate of slip and tentative recurrence interval for large earthquakes on the San Andreas fault, Cajon Pass, southern California. Geol. Soc. Am. Bull. 96, 793–812 (1985). [Google Scholar]
- 9.G. G. Seitz, The paleoseismology of the San Andreas fault at Pitman Canyon: Implication for fault behavior and paleoseismic methodology, thesis, University of Oregon, Eugene (1999). [Google Scholar]
- 10.Seitz G., Weldon R. II, Biasi G. P., The Pitman Canyon paleoseismic record: A re-evaluation of southern San Andreas Fault segmentation. J. Geodyn. 24, 129–138 (1997). [Google Scholar]
- 11.S. P. Bemis, K. Scharer, J. F. Dolan, E. Rhodes, A. Hatem, C. Wespestad, Paleoearthquake evidence from Elizabeth Lake and constraints on rupture patterns for the Mojave section of the south-central San Andreas Fault, poster presented at the Southern California Earthquake Center annual meeting, Palm Springs, CA, 12 to 16 September 2015. [Google Scholar]
- 12.Lindvall S. C., Rockwell T. K., Dawson T. E., Helms J. G., Bowman K. W., Evidence for two surface ruptures in the past 500 years on the San Andreas fault at Frazier Mountain, California. Bull. Seismol. Soc. Am. 92, 2689–2703 (2002). [Google Scholar]
- 13.T. L. Davis, Late Cenozoic structure and tectonic history of the western “Big Bend” of the San Andreas fault and adjacent San Emigdio Mountains, thesis, University of California, Santa Barbara (1983). [Google Scholar]
- 14.J. D. Yule, C. Howland, A revised chronology of earthquakes produced by the San Andreas fault at Burro Flats, near Banning, California, paper presented at the 11th Annual Meeting of the Southern California Earthquake Center, Oxnard, CA, 23 to 26 September 2001. [Google Scholar]
- 15.Fumal T. E., Rymer M. J., Seitz G. G., Timing of large earthquakes since A.D. 800 on the Mission Creek strand of the San Andreas fault zone at Thousand Palms Oasis, near Palm Springs, California. Bull. Seismol. Soc. Am. 92, 2841–2860 (2002). [Google Scholar]
- 16.Philibosian B., Fumal T., Weldon R., San Andreas fault earthquake chronology and Lake Cahuilla history at Coachella, California. Bull. Seismol. Soc. Am. 101, 13–38 (2011). [Google Scholar]
- 17.Williams P., Seitz G., New insights to earthquake behavior of the southernmost San Andreas fault. Seismol. Res. Lett. 77, 270 (2006). [Google Scholar]
- 18.McGill S., Dergham S., Barton K., Berney-Ficklin T., Grant D., Hartling C., Hobart K., Minnich R., Rodriguez M., Runnerstrom E., Russell J., Schmoker K., Stumfall M., Townsend J., Williams J., Paleoseismology of the San Andreas fault at Plunge Creek, near San Bernardino, southern California. Bull. Seismol. Soc. Am. 92, 2803–2840 (2002). [Google Scholar]
- 19.Kendrick K. J., Fumal T. E., Paleoseismicity of the northern San Jacinto fault, Colton and San Bernardino, southern California; preliminary results. Geol. Soc. Am. Abstr. Prog. 37, 559 (2005). [Google Scholar]
- 20.Onderdonk N. W., McGill S. F., Rockwell T. K., Short-term variations in slip rate and size of prehistoric earthquakes during the past 2000 years on the northern San Jacinto fault zone, a major plate-boundary structure in southern California. Lithosphere 7, 211–234 (2015). [Google Scholar]
- 21.Onderdonk N. W., Rockwell T. K., McGill S. F., Marliyani G. I., Evidence for seven surface ruptures in the past 1600 years on the Claremont fault at Mystic Lake, northern San Jacinto fault zone, California. Bull. Seismol. Soc. Am. 103, 519–541 (2013). [Google Scholar]
- 22.Rockwell T. K., Dawson T. E., Ben-Horin J. Y., Seitz G. G., A 21-event, 4,000-year history of surface ruptures in the Anza seismic gap, San Jacinto fault: Implications for long-term earthquake production on a major plate boundary fault. Pure Appl. Geophys. 172, 1143–1165 (2015). [Google Scholar]
- 23.Salisbury J. B., Rockwell T. K., Middleton T. J., Hudnut K. W., LiDAR and field observations of slip distribution for the most recent surface ruptures along the central San Jacinto fault. Bull. Seismol. Soc. Am. 102, 598–619 (2012). [Google Scholar]
- 24.Lozos J. C., Oglesby D. D., Brune J. N., Olsen K. B., Rupture and ground-motion models on the northern San Jacinto fault, incorporating realistic complexity. Bull. Seismol. Soc. Am. 105, 1931–1946 (2015). [Google Scholar]
- 25.J. C. Lozos, T. K. Rockwell, N. W. Onderdonk, Dynamic rupture models of historic and recent paleoseismic ruptures on the northern and central San Jacinto fault, paper presented at the Annual Meeting of the Seismological Society of America, Pasadena, CA, 21 to 23 April 2015. [Google Scholar]
- 26.Lozos J. C., Olsen K. B., Brune J. N., Takedatsu R., Brune R. J., Oglebsy D. D., Broadband ground motions from dynamic models of rupture on the northern San Jacinto fault, and comparison with precariously balanced rocks. Bull. Seismol. Soc. Am. 105, 1947–1960 (2015). [Google Scholar]
- 27.L. Grant Ludwig, J. N. Brune, Precariously balanced rocks in the western San Bernardino Mountains and the 1812 earthquake on the San Andreas–San Jacinto fault, paper presented at the 20th Annual Meeting of the Southern California Earthquake Center, Palm Springs, CA, 11 to 15 September 2010. [Google Scholar]
- 28.U. S. Geological Survey and California Geological Survey, Quaternary Fault and Fold Database of the United States (2010).
- 29.Yang W., Hauksson E., The tectonic crustal stress field and style of faulting long the Pacific North America plate boundary in southern California. Geophys. J. Int. 194, 100–117 (2013). [Google Scholar]
- 30.Yule D., The enigmatic San Gorgonio Pass. Geology 37, 191–192 (2009). [Google Scholar]
- 31.Field E. H., Arrowsmith R. J., Biasi G. P., Bird P., Dawson T. E., Felzer K. R., Jackson D. D., Johnson K. M., Jordan T. H., Madden C., Michael A. J., Milner K. R., Page M. T., Parsons T., Powers P. M., Shaw B. E., Thatcher W. R., Weldon R. J. II, Zeng Y., Uniform California Earthquake Rupture Forecast, Version 3 (UCERF3)—The time-independent model. Bull. Seismol. Soc. Am. 104, 1122–1180 (2014). [Google Scholar]
- 32.Hardebeck J. L., Stress orientations in subduction zones and the strength of subduction megathrust faults. Science 349, 1213–1216 (2015). [DOI] [PubMed] [Google Scholar]
- 33.Harris R. A., Archuleta R. J., Day S. M., Fault steps and the dynamic rupture process: 2-D numerical simulations of a spontaneously propagating shear fracture, Geophys. Res. Lett. 18, 893–896 (1991). [Google Scholar]
- 34.Oglesby D., Rupture termination and jump on parallel offset faults. Bull. Seismol. Soc. Am. 98, 440–447 (2008). [Google Scholar]
- 35.Lozos J. C., Harris R. A., Murray J. R., Lienkaemper J. J., Dynamic rupture models of earthquakes on the Bartlett Springs Fault, northern California. Geophys. Res. Lett. 42, 4343–4349 (2015). [Google Scholar]
- 36.Grant Ludwig L., Brune J. N., Anooshehpoor A., Purvance M. D., Brune R. J., Lozos J. C., Reconciling precariously balanced rocks (PBRs) with large earthquakes on the San Andreas fault system. Seismol. Res. Lett. 86, 1345–1353 (2015). [Google Scholar]
- 37.Rybicki K., Kato T., Kasahara K., Mechanical interaction between neighboring active faults—Static and dynamic stress field induced by faulting. Bull. Earthquake Res. Inst. Univ. Tokyo 60, 1–21 (1985). [Google Scholar]
- 38.Dolan J. F., Rockwell T. K., Paleoseismologic evidence for a very large (Mw >7), post-A.D. 1660 surface rupture on the eastern San Cayetano fault, Ventura County, California: Was this the elusive source of the damaging 21 December 1812 earthquake? Bull. Seismol. Soc. Am. 91, 1417–1432 (2001). [Google Scholar]
- 39.Deng J., Sykes L. R., Triggering of the 1812 Santa Barbara earthquake by a great San Andreas shock: Implications for future seismic hazard in southern California. Geophys. Res. Lett. 23, 1155–1158 (1996). [Google Scholar]
- 40.Toppozada T. R., Branum D. M., Reichle M. S., Hallstrom C. L., San Andreas fault zone, California: M ≥ 5.5 earthquake history. Bull. Seismol. Soc. Am. 92, 2555–2601 (2002). [Google Scholar]
- 41.Dieterich J. H., Richards-Dinger K. B., Earthquake recurrence in simulated fault systems. Pure Appl. Geophys. 167, 1087–1104 (2010). [Google Scholar]
- 42.N. W. Onderdonk, Variations in slip rate and size of pre-historic earthquakes during the past 2000 years on the northern San Jacinto fault and implications for the lack of major historic earthquakes on the fault, paper presented at the Annual Meeting of the Seismological Society of America, Pasadena, CA, 21 to 23 April 2015. [Google Scholar]
- 43.Barall M., A grid-doubling finite-element technique for calculating dynamic three-dimensional spontaneous rupture on an earthquake fault. Geophys. J. Int. 178, 845–859 (2009). [Google Scholar]
- 44.Harris R. A., Barall M., Archuleta R., Dunham E., Aagaard B., Ampuero J. P., Bhat H., Cruz-Atienza V., Dalguer L., Dawson P., Day S., Duan B., Ely G., Kaneko Y., Kase Y., Lapusta N., Liu Y., Ma S., Oglesby D., Olsen K., Pitarka A., Song S., Templeton E., The SCEC/USGS dynamic earthquake rupture code verification exercise. Seismol. Res. Lett. 80, 119–126 (2009). [Google Scholar]
- 45.Ida Y., Cohesive force across the tip of a longitudinal shear crack and Griffith’s specific surface energy. J. Geophys. Res. 77, 3796–3805 (1972). [Google Scholar]
- 46.Andrews D. J., Rupture propagation with finite stress in antiplane strain. J. Geophys. Res. 81, 3575–3582 (1976). [Google Scholar]
- 47.Magistrale H., Day S., Clayton R. W., Graves R., The SCEC southern California reference three-dimensional seismic velocity model version 2. Bull. Seismol. Soc. Am. 90, S65–S76 (2000). [Google Scholar]
- 48.Day S. M., Three-dimensional simulation of spontaneous rupture: The effect of nonuniform prestress. Bull. Seismol. Soc. Am. 72, 1881–1902 (1982). [Google Scholar]
Associated Data
This section collects any data citations, data availability statements, or supplementary materials included in this article.
Supplementary Materials
Supplementary material for this article is available at http://advances.sciencemag.org/cgi/content/full/2/3/e1500621/DC1
Fig. S1. Coulomb stress changes from a model rupture with nucleation on the SJF at Cajon Pass.
Fig. S2. Coulomb stress changes from a model rupture with nucleation on the SAF at Cajon Pass.
Fig. S3. Coulomb stress changes from a model rupture with nucleation on the SAF at Pallett Creek.
Fig. S4. Coulomb stress changes on the SAF.