Abstract
Purpose
To develop and validate a novel delivery strategy for reducing the respiratory motion–induced dose uncertainty of spot-scanning proton therapy.
Methods and Materials
The spot delivery sequence was optimized to reduce dose uncertainty. The effectiveness of the delivery sequence optimization was evaluated using measurements and patient simulation. One hundred ninety-one 2-dimensional measurements using different delivery sequences of a single-layer uniform pattern were obtained with a detector array on a 1-dimensional moving platform. Intensity modulated proton therapy plans were generated for 10 lung cancer patients, and dose uncertainties for different delivery sequences were evaluated by simulation.
Results
Without delivery sequence optimization, the maximum absolute dose error can be up to 97.2% in a single measurement, whereas the optimized delivery sequence results in a maximum absolute dose error of ≤11.8%. In patient simulation, the optimized delivery sequence reduces the mean of fractional maximum absolute dose error compared with the regular delivery sequence by 3.3% to 10.6% (32.5-68.0% relative reduction) for different patients.
Conclusions
Optimizing the delivery sequence can reduce dose uncertainty due to respiratory motion in spot-scanning proton therapy, assuming the 4-dimensional CT is a true representation of the patients’ breathing patterns.
Introduction
Spot scanningy–based intensity modulated proton therapy (IMPT), which has been implemented in selected lung cancer patients, can result in a lower dose to normal tissues such as lung, esophagus, and heart, compared with intensity modulated photon radiation therapy (1, 2). However, respiratory motion–induced dose uncertainty remains a major concern in the IMPT of lung and liver cancers (3, 4). Motion-induced dose uncertainty, often referred to as the “interplay effect,” has been extensively studied in scanning-beam proton therapy (5-8), and strategies such as tumor tracking (9) and rescanning (ie scanning treatment fields several times per fraction) (4, 10-13) have been proposed. However, tracking is not yet clinically available. The combination of rescanning and fractionation has been shown to effectively limit the dose uncertainty of IMPT in lung cancer (11). However, the number of rescans that are needed to achieve acceptable dose uncertainty is unknown for a given patient (14), and large numbers of rescans can lead to unacceptably long delivery times (10). Moreover, although fractionation can reduce uncertainty in the total delivered dose, the biological effect of the day-to-day variation in the delivered fractional dose is unknown. Therefore, a delivery strategy that can reduce the fractional dose uncertainty for IMPT of moving tumors is highly desirable.
In the present study we developed and evaluated a novel delivery strategy, spot delivery sequence optimization, for spot-scanning proton beam therapy. Spot delivery sequence, or when and where to deliver each spot in a given spot pattern, has not been previously investigated and could impact the delivered dose of moving tumors. We proposed that optimizing the delivery sequence of the IMPT plan—separating successive spots in space to maximize the total effective time required to deliver the same proton fluence to any given voxel (15)—could reduce motion-induced dose uncertainty. In this study we assumed that 4-dimensional computed tomography (4DCT) provided a true representation of the patient's breathing pattern throughout the course of treatment and that there was no residual motion between 4DCT phases.
Methods and Materials
Reducing motion-induced dose uncertainty by optimizing the delivery sequence
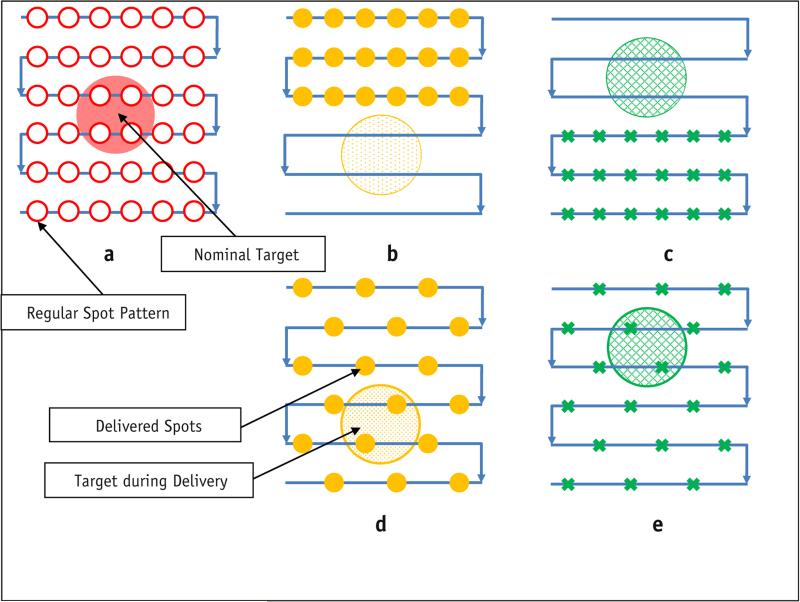
In discrete spot-scanning proton therapy, dose is delivered spot by spot on a 3-dimensional grid. The treatment planning system calculates the dose according to the spot pattern, or the collection of spot positions and monitor units (MU) for each spot, and determines the spot delivery sequence, or the order in which each planned spot is delivered. Figure 1a shows a spot-scanning plan on a circular target with exaggerated margins. The arrows indicate the planned regular scanning delivery sequence (RS) or the order in which spots are to be delivered. However, the RS is not optimal for a moving target. Figure 1b and c show the actual delivery of the RS, assuming only 2 phases: inhalation (T0) and exhalation (T50). In this extreme example, the target was completely missed. Figure 1d and e show the delivery of a different spot delivery sequence, in which every other spot was skipped and the beam returned later. In this case the target received the planned dose. No rescanning (revisiting the same spot location) was involved, and the delivery times were identical in the 2 scenarios. This figure demonstrates that for moving targets, the spot delivery sequence could impact the delivered dose to the target and the motion-induced dose uncertainty.
Fig. 1.
Optimization of the delivery pattern. (a) Nominal plan; (b, c) regular delivery scanning sequence; (d, e) alternative delivery sequence. Solid yellow circles: spots delivered at T0; green x's: spots delivered at T50. A color version of this figure is available at www.redjournal.org.
Proton Therapy Center, Houston (PTC-H) spot-scanning delivery system
The spot-scanning delivery system (Probeat; Hitachi America, Ltd, Tarrytown, NY) used at Proton Therapy Center of Houston (PTC-H) was described in detail by Gillin et al (16) and Li et al (11). The scanning proton beam was generated by a synchrotron with 94 discrete energies that ranged from 4 to 30.6 cm (72.5 to 221.8 MeV, respectively). Each spill of proton particles lasted for a maximum duration of 4.4 seconds, with 2.1 seconds required between spills for the deceleration and acceleration of protons. Proton spots could be modeled by a single 2-dimensional (2D) Gaussian distribution (17, 18) and characterized by the standard deviation (σ) of the Gaussian distribution. The spot size decreases as the energy increases, and σ at isocenter ranges between 5.57 and 14.91 mm in air (for beams with energies of 221.8 MeV and 72.5 MeV, respectively). The proton fluence delivered by each spot was characterized using spot MU, which range from 0.005 to 0.04 (16). The delivery time for each spot was 1 to 10 milliseconds, depending on the spot MU, and an interval of 3 milliseconds between consecutive spots was used for internal checks by the delivery system. In a patient treatment plan, the required spot dose often exceeds 0.04 MU. In such cases, the treatment planning system (Eclipse; Varian Medical Systems, Palo Alto, CA) generated the final Digital Imaging and Communications in Medicine treatment plan with postprocessing, which included splitting each spot into multiple spots that satisfied the MU limits, and arranging the spots in RS, as shown in Figure 1a (19). A typical spot pattern consists of thousands of spots.
Optimizing the spot delivery sequence
Each spot pattern with a given number of spots can be delivered in various sequences. One of the determining factors of motion-induced dose uncertainty is the total time required to deliver all proton fluence to a certain spot location, or the time interval between successive deliveries (15). For example, the worst delivery sequence (WS) that maximizes motion-induced dose uncertainty delivers all spots repeatedly to the same spot position (which reduces the time interval between successive deliveries) and then moves to the nearest position and repeats the process.
In contrast, to generate the optimized delivery sequence (OS) for a given spot pattern, we used the following procedure. For each energy, the spots in the treatment plan are arranged so that the fluence to each pencil beam position is reduced in any set period, which in this study was 1 second. This can be achieved using a simple forward-looking technique that searches for and places new spots at least 2σ away from all spots to be delivered in the previous 1 second. The optimized spot delivery sequence can also be viewed as maximizing the area the proton beam covers in any period.
Example of a spot delivery sequence
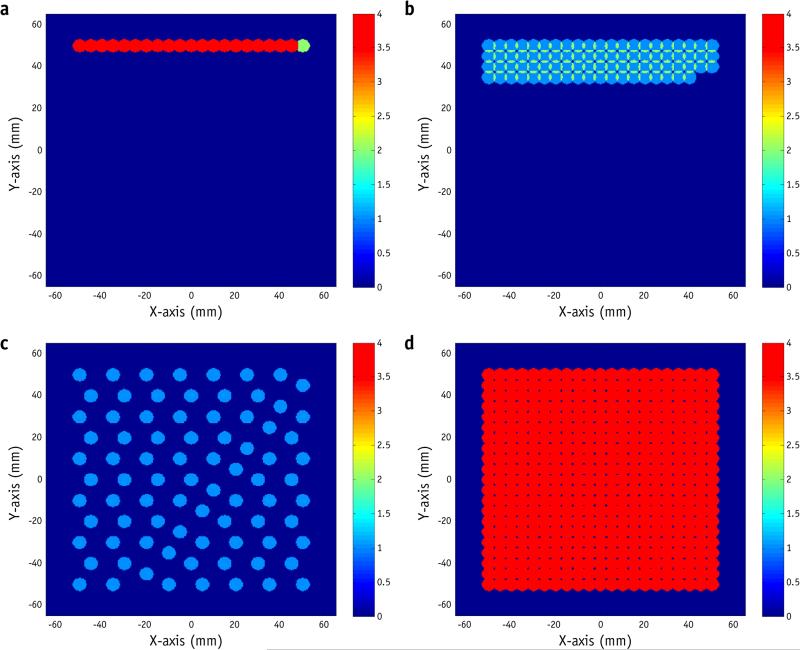
Figure 2 shows an example of a 10 × 10 cm2 uniform field, with a spot pattern that consists of 1764 spots of a single energy (173.7 MeV with a 20-cm range and σ = 6.75 mm). There were 441 spot positions, with spot spacing of 5 mm. A dose of 0.16 MU was delivered to each position in 4 spots of 0.04 MU each, or each spot position was visited 4 times. The total number of MU was 70.56, and the required time to deliver this field was 31 seconds. The MU delivered at any given spot position also contributes to nearby spot positions, depending on the spot size and spot spacing.
Fig. 2.
Sample delivery sequences for a uniform field. The images show spots delivered in the first second with (a) the worst delivery sequence, (b) regular scanning delivery sequence, and (c) optimized delivery sequence. (d) Spot pattern after complete delivery. Color bar represents the number of scans, or the number of spot positions visited. For illustration purposes, each spot is represented by a circle with a radius of 3.5 mm. A color version of this figure is available at www.redjournal.org.
Figure 2b shows the first second of the RS, as generated by the treatment planning system (Eclipse). A certain number of MU (0.04 in this example) was delivered to a given spot position before the beam moved on to the next position. The process was repeated after all spot positions were visited, multiple times if necessary, to deliver the remaining MU.
The WS was generated to deliver the same spot pattern by delivering the fluence in the shortest period possible (Fig. 2a). In this case, the WS delivered all 4 spots to the same position before moving to the next. In the case of no rescanning, the WS is identical to the RS.
To reduce dose uncertainty, one should reduce the total fluence delivered to any given spot position in any 1-second period. Therefore, the OS places successive spots apart from each other (Fig. 2c).
All 3 delivery sequences result in the same spot pattern (Fig. 2d); the WS and OS simply reorder the spots of the corresponding RS. Supplemental Videos 1 and 2 (available online at www.redjournal.org) show the actual delivery times of different sequences for the first–second and overall deliveries, without considering the lag between spills, illustrating the time scale difference between spot delivery and respiratory motion.
Measurement setup
The measurement setup is shown in Figure e1 (available online at www.redjournal.org). A MatriXX multi-ion chamber detector (IBA Dosimetry, Schwarzenbruck, Germany) was placed on a 1-dimensional moving platform (20) and used to acquire the 2D dose distribution, with and without motion. The MatriXX system (27) consists of 1020 vented pixel ionization chambers distributed on a 32 × 32 cm2 grid, with no detectors in the 4 corners. The pixel ionization chambers are 4.5 mm in diameter and spaced 7.62 mm center to center, providing an active area of 24 × 24 cm2. The 1-dimensional moving platform was driven by a VXM stepping motor controller attached to a BiSlide assembly (Velmex, Bloomfield, NY). The motor controller can be programmed to move in different amplitudes and periods and can simulate most types of respiratory motion, including actual patient respiration.
Single-layer uniform pattern measurements
A single-layer, 10 × 10-cm2 uniform field (Fig. 2) was delivered and measured. We obtained 191 2D measurements (measurements with no motion were obtained as a reference but not included in the 191 measurements) with MatriXX, delivering the same total MU to each spot position under various motion conditions and spot delivery sequences.
We used the following spot patterns for the measurements. Each spot position was scanned 2, 4, 8, 16, and 32 times, corresponding to delivery times of 16, 31, 42, 52, and 84 seconds (corresponding to 882, 1764, 3528, 7056, and 14,112 spots), respectively. The base plan shown in Figure 2d required a delivery time of 31 seconds. Half the spots were deleted to generate a spot pattern with a delivery time of 16 seconds with half the MU (35.28), and spots were split to 0.02, 0.01, and 0.005 MU to generate spot patterns with 42-, 52-, and 84-second delivery times with the same MU (70.56). The WS, RS, and OS delivery sequences were then generated for each spot pattern. Using different delivery sequences (WS, RS, and OS) for the same spot pattern does not change the delivery time or the number of spots. A total of 15 delivery sequences were developed for each motion condition.
The following measurements were made with a breathing period of 10 seconds, a scanning pattern perpendicular to the motion, and a motion pattern of A , with a motion range of 0.5, 1, 2, 3, and 4 cm; 15 different delivery sequences (as described above); and at least 3 measurements for each condition. Note that not all conditions were measured, and additional measurements were made when larger errors were observed—for example, with larger motion range and shorter delivery time. A beam energy of 173.7 MeV (range 20 cm, in air spot size σ = 6.75 mm) was used for all measurements, and the measurement depth was 19.4 cm, where the spot size became approximately 7.5 mm. The central axis dose at the measurement plane was 138 cGy (69 cGy for spot patterns with a delivery time of 16 seconds).
All measurements were compared with the 4D composite dose (4D dose) (11, 21, 22), which is the averaged sum of the doses calculated on all N individual phases of the breathing cycle using the planned fluence, with the corresponding motion pattern. Assuming 10 phases in each respiratory cycle, by definition the 4D dose can be determined by averaging 10 stationary measurements at each of the 10 phases for every motion condition, or, alternatively, by making 1 stationary measurement and then shifting and averaging according to the breathing trace. The latter technique is only valid when there is no change in water equivalent thickness in the beam path, and it was used in this study to reduce the number of measurements after validating with the first technique under one motion condition.
For each measurement, the maximum absolute dose error between the measurement and the 4D dose was calculated (ΔDmax). The motion-induced dose uncertainty for a given combination of delivery sequence and motion condition was quantified by the maximum value of all ΔDmax measured under the specific combination.
Patient simulation
Treatment plans for 10 patients with stage II to III lung cancer who received intensity modulated photon radiation therapy or passively scattered proton therapy at UT MD Anderson Cancer Center between March 2010 and June 2012 were selected for this retrospective study. The patients were selected on the basis of the extent of tumor motion and volume. Each patient's treatment parameters are listed in Table e1 (available online at www.redjournal.org).
Multifield-optimized IMPT plans for the 10 patients were generated as previously described, with a prescription of 60 Gy Relative Biological Effectiveness (RBE) in 30 fractions (23). The WS and OS were generated for each planned spot pattern by reorganizing the order of the spots to be delivered as described above, and the original plan served as the RS.
The patients’ respiratory traces recorded by the Real-Time Position Management System (RPM, Varian Medical Systems) at the time of CT simulation (each trace lasts typically approximately 15 minutes), along with the 4DCT data, were used for the patient simulation. The simulation was carried out using the system described in reference 20, where layer-by-layer rescanning using the PTC-H system was investigated. A Demons-based deformable image registration algorithm was applied to calculate the deformation vector field between each individual phase and the reference phase (T50, exhale) (24). Doses were calculated for each individual phase and then deformed onto the reference phase and averaged to acquire the 4D dose. Dynamic dose was calculated using the 4DCT data and respiratory trace of each patient. The delivery of each field was assumed to start at a random time point on the trace, and then the time and phase of each spot were calculated and recorded. The trace restarted from the beginning when it ended during a delivery. The dose for each individual phase was then calculated using all spots delivered to the specific phase during a given delivery and was deformed to the reference phase. Finally, the sum of individual phase doses was calculated as the dynamic dose for one fraction. The process was repeated 30 times for each delivery sequence and for each patient. The sum of all 30 fractional doses was calculated as accumulated dose. The absolute dose error between the 4D dose and each individual delivery and the absolute dose error between the 4D dose and the accumulated dose were calculated and compared with layer-by-layer rescanning results as previously reported (21).
Results
Single-layer measurements
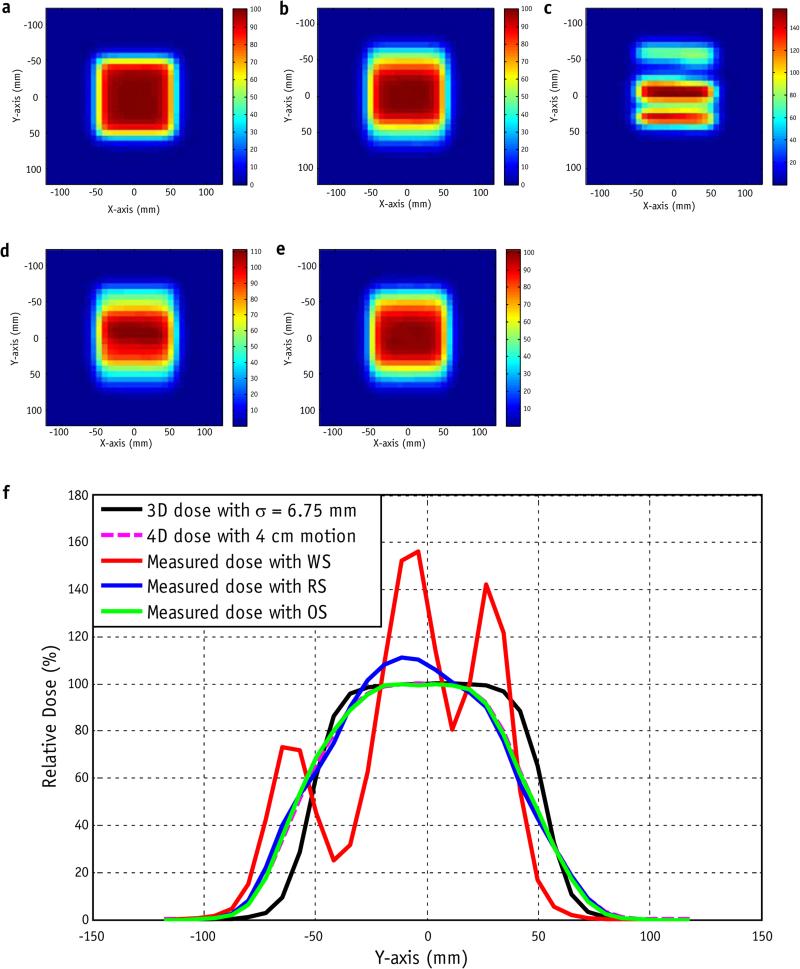
Figure 3 shows the results of measurements with 4 cm of motion range for a single delivery of a single-layer 10 × 10 cm2 uniform field with σ = 6.75 mm and a 52-second delivery time (7056 spots, 16 scans). In this measurement condition, the maximum absolute dose error between the delivered dose and the 4D dose was up to 57.2% (of the dose for the uniform field, or the prescription dose per fraction for the patient field) for the WS, up to 17.2% for the RS, and up to 4.89% for the OS.
Fig. 3.
(a) Nominal 3-dimensional dose distribution for a single-layer uniform plan with σ = 6.75 mm and spot spacing of 5 mm. (b) Four-dimensional calculated dose distribution with 4-cm motion and a period of 10 seconds. (c) Single-fraction measured dose with the worst delivery sequence. (d) Regular scanning delivery sequence. (e) Optimized delivery sequence. (f) Plot of the y-axis with x = 0 for the nominal dose; 4D dose; and measured doses with the worst (WS), optimized (OS), and regular (RS) delivery sequences. Color bar represents the percentage dose.
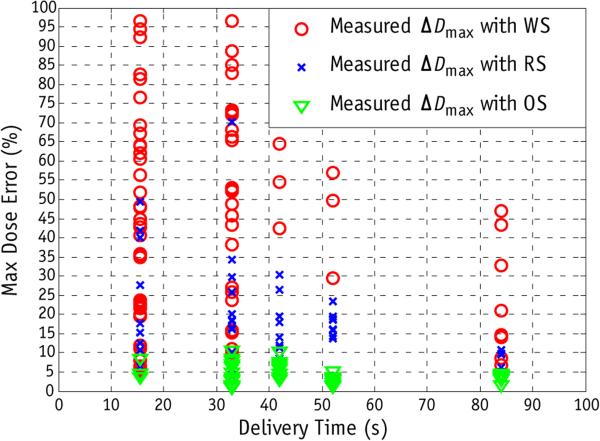
Figure 4 compares the efficacy of spot delivery sequence optimization and rescanning for a single layer with 191 measurements under different motion conditions. With 2 and 4 scans the absolute maximum dose error with the WS can be up to 97.2%. In conventional rescanning in which RS was used, the dose error can be up to 70.5%. With the same number of spots and same delivery time, OS results in substantially less dose uncertainty. The maximum dose error in a single delivery with OS is <11.8%. For different delivery sequences (WS, RS, and OS) the dose uncertainty in general decreases with increasing number of rescanning and delivery time. With 32 scans and 84 seconds of delivery time, the WS still results in maximum absolute dose error up to 47%, whereas for RS and OS the maximum absolute dose error are 11.2% and 4.79%, respectively.
Fig. 4.
Comparison of the worst (WS), regular (RS), and optimized (OS) delivery sequences as a function of rescanning (or delivery time). All measurements were obtained with a motion range of 4 cm and a breathing period of 10 seconds, with 2, 4, 8, 16, and 32 scans (delivery times of 16, 31, 42, 52, and 84 seconds, respectively). Delivery time was a function of the numbers of spots and monitor units for each spot in the treatment plan. The absolute maximum dose error (ΔDmax) for each measurement was plotted against delivery time.
Patient simulation
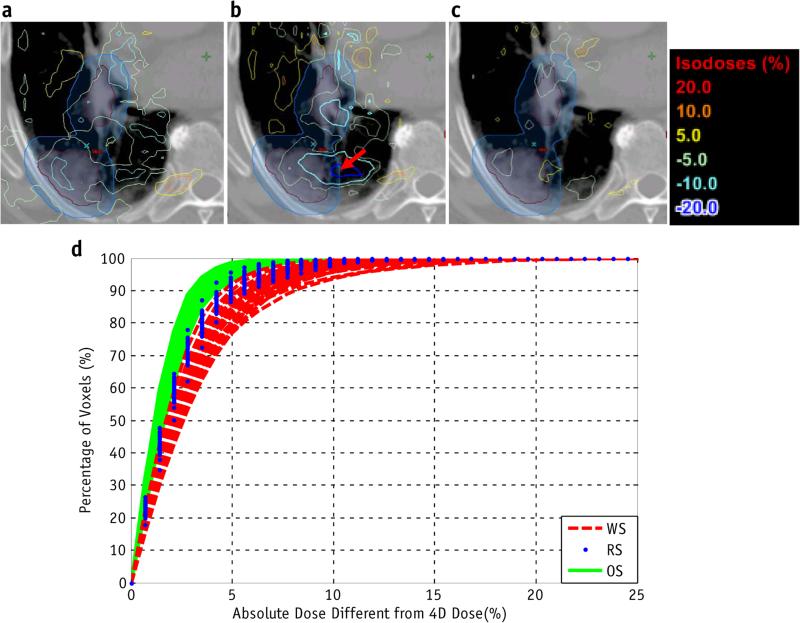
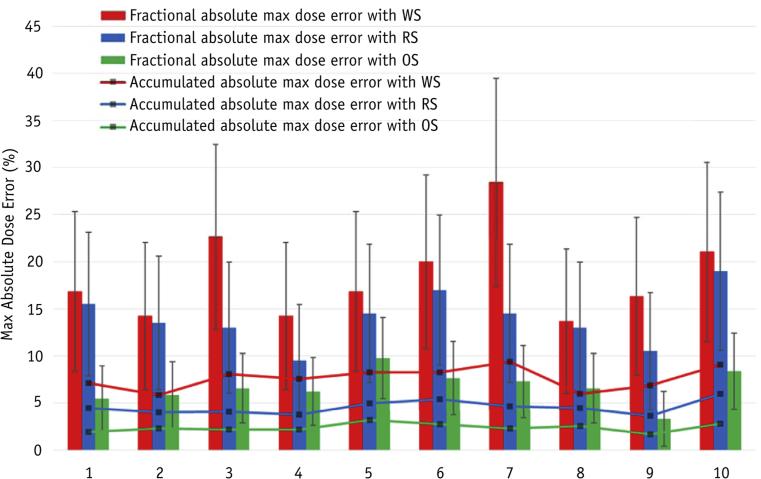
Simulations were performed for each patient with the same spot pattern but with different spot delivery sequences: the RS (the planned sequence), WS, and OS. Figure 5a-c shows the voxel-by-voxel dose difference between the 4D dose and the doses delivered using the RS, WS, and OS, respectively, for 1 fraction in patient 5. The maximum absolute dose error for the clinical target volume (CTV) in 1 fraction was 23.4% for the WS, 14.3% for the RS, and 7.3% for the OS. The simulation was repeated for 30 fractions, and Figure e2 (available online at www.redjournal.org) shows the dose–volume histograms (DVHs) from 4D dose (solid line), along with lower and upper bounds of fractional DVHs (DVHs calculated using dose delivered in each fraction) for the RSs, WSs, and OSs of all deliveries, respectively. Figure 5d shows the dose error for the CTV between the 4D dose and the RS, WS, and OS deliveries. Figure 6 shows the max absolute dose errors between 4D dose and fractional and accumulated doses in the CTV using the RS, WS, and OS for each patient. The dose error was calculated by voxel-by-voxel comparison of the delivered dose with 4D dose. The OS reduces the mean of fractional absolute max dose error compared with RS by 3.3% to 10.6% (32.5-68.0% relative reduction) for different patients, and 7.06% to 21.1% compared with WS. The absolute maximum dose errors between accumulated dose and 4D dose with OS were reduced by 1.55% to 3.17% (34.9-56.3% relative reduction) compared with RS, and 3.4% to 7.1% compared with WS. The absolute maximum dose errors between accumulated dose and 4D dose using OS are <3% in the CTV for all patients. For the patients and conditions considered, the OS with the same delivery time and same number of spots always has less dose uncertainty, as quantified by the mean of fractional absolute maximum dose error in the CTV, than do the RS and WS.
Fig. 5.
An example of patient simulation. For 1 fraction for patient 5, the difference between the 4-dimensional dose and the delivered dose was determined using the (a) regular, (b) worst, and (c) optimized sequences. The simulation was repeated for 30 fractions. (d) Cumulative histogram of clinical target volume dose errors between the 4-dimensional dose and the regular (RS), worst (WS), and optimized (OS) delivery sequences for each fraction.
Fig. 6.
Maximum (Max) absolute dose error for each patient, determined using the same planned spot pattern and different spot delivery sequences. Both the means and standard deviations of maximum dose errors between 30 single fractions and 4-dimensional dose, and maximum dose error between the accumulated dose and the 4-dimensional dose are shown. Abbreviations: OS = optimized delivery sequence; RS = regular delivery sequence; WS = worst delivery sequence.
Discussion
Spot-scanning proton therapy can be highly sensitive to motion (4, 8); our previous studies showed that the delivered dose is the 4D dose, with motion-induced uncertainty due to the interplay effect (15). Through measurements, we found that the motion-induced dose error can be >90% (Fig. 3) in a single fraction if the motion is not managed properly. A previous study (5) showed that with the RS, the fractional dose error can be up to approximately 30% in patients, which is consistent with our patient simulation.
The purpose of the present study was to develop a technique to reduce fractional dose uncertainty while treating free-breathing, moving targets. This was achieved by developing an OS. Our measurements confirmed that the OS resulted in a reduced dose uncertainty in a single fraction compared with RS and WS under all motion conditions. Similarly to rescanning, delivery sequence optimization requires only postprocessing of the treatment plan and does not alter the work flow of treatment delivery. This is different from some other motion mitigation techniques, such as beam tracking (9), breath sampling (7), and phase-controlled rescanning (25, 26).
We developed and validated the optimization of the delivery sequence using the PTC-H system, which includes inherent layer-by-layer rescanning for most plans due to the maximum MU constraint, but it can be easily generalized to any spot-scanning delivery system. Comprehensive phantom measurements using a 2D ion chamber array and patient simulations were performed to validate the method. In both the phantom measurements and the patient simulation, the OS reduced dose uncertainty from those observed for the RS and WS. In this study, absolute maximum voxel-by-voxel dose error between measurement or simulated dose and the 4D dose, which is more sensitive than DVH-based quantities previously reported in the literature (10-12), was used to quantify motion-induced dose uncertainty. Even with this sensitive metric, with the combination of OS and fractionation, the maximum dose error in the accumulative dose of all patients is found to be <3%. These findings confirm the validity of both the simulation system and the OS delivery strategy.
The delivery sequence, which determines when and where to deliver a spot, has not been systematically investigated previously. Instead, an RS was adopted as the default for commercially available treatment planning systems, and only rescanning, a special case of delivery sequence, has been investigated as a technique for mitigating motion-induced dose uncertainty. Previous studies have shown that rescanning and fractionation are effective methods for reducing motion-induced dose uncertainty (5, 7, 11, 12). However, the patient dose received in each fraction may still deviate from the 4D dose because of the interplay effect, in which case the biological effect is unknown. In comparing the effectiveness of reducing motion-induced dose uncertainty with the OS of the original plan, without additional rescanning, and with a previously described layer-by-layer rescanning procedure (21), we found that without a change in the number of spots or the delivery time, the OS of the original plan is comparable to 4 layer-by-layer scans.
Treatment planning was not addressed in this study, because the OS is a delivery-based technique for free-breathing patients that could benefit any IMPT plan regardless of treatment planning techniques used. As shown in Figure 3, the 4D dose deviated substantially from the 3-dimensional dose; this was investigated in a previous study (23). We assumed in this study that 4DCT provides a true representation of the patient throughout treatment. This assumption was inherited from the treatment planning process and may not be valid in practice. Clinically, it is important to monitor patients’ breathing during treatment and provide training as needed.
The OS alone, as shown in the patient simulation, may not be enough to reduce the fractional motion-induced dose uncertainty to an acceptable level. Therefore, it may be beneficial to combine OS with rescanning, as shown in the single-layer measurement. However, the required number of rescanning with OS, although it could be reduced compared with conventional rescanning with RS as shown in Figure 4, remains unknown. An analytic model is being developed to calculate the required number of scans for each spot position.
Conclusions
The OS can reduce respiratory motion–induced dose uncertainty in spot-scanning proton therapy compared with RS, assuming 4DCT provides a true representation of the patients’ breathing patterns.
Supplementary Material
Summary.
In this study, a novel technique, delivery sequence optimization, was proposed to reduce the motion-induced dose uncertainty of spot scanning proton therapy of moving tumors. We obtained 191 2-dimensional measurements and performed patient simulations, both of which demonstrated that delivery sequence optimization reduces dose uncertainty due to respiratory motion in spot-scanning proton therapy compared with regular delivery sequence.
Footnotes
Conflict of interest: none.
Supplementary material for this article can be found at www.redjournal.org.
References
- 1.Zhang X, Li Y, Pan X, et al. Intensity-modulated proton therapy reduces the dose to normal tissue compared with intensity-modulated radiation therapy or passive scattering proton therapy and enables individualized radical radiotherapy for extensive stage iiib non-small-cell lung cancer: A virtual clinical study. International journal of radiation oncology, biology, physics. 2010;77:357–366. doi: 10.1016/j.ijrobp.2009.04.028. [DOI] [PMC free article] [PubMed] [Google Scholar]
- 2.Chang JY, Li H, Zhu R, et al. Clinical implementation of intensity-modulated proton therapy in thoracic malignancies. International journal of radiation oncology, biology, physics. 2014;90(4):809–18. doi: 10.1016/j.ijrobp.2014.07.045. doi: 10.1016/j.ijrobp.2014.07.045. [DOI] [PMC free article] [PubMed] [Google Scholar]
- 3.Engelsman M, Schwarz M, Dong L. Physics controversies in proton therapy. Semin Radiat Oncol. 2013;23:88–96. doi: 10.1016/j.semradonc.2012.11.003. [DOI] [PubMed] [Google Scholar]
- 4.Phillips MH, Pedroni E, Blattmann H, et al. Effects of respiratory motion on dose uniformity with a charged particle scanning method. Phys Med Biol. 1992;37:223–234. doi: 10.1088/0031-9155/37/1/016. [DOI] [PubMed] [Google Scholar]
- 5.Kraus KM, Heath E, Oelfke U. Dosimetric consequences of tumour motion due to respiration for a scanned proton beam. Phys Med Biol. 2011;56:6563–6581. doi: 10.1088/0031-9155/56/20/003. [DOI] [PubMed] [Google Scholar]
- 6.Lambert J, Suchowerska N, McKenzie DR, et al. Intrafractional motion during proton beam scanning. Phys Med Biol. 2005;50:4853–4862. doi: 10.1088/0031-9155/50/20/008. [DOI] [PubMed] [Google Scholar]
- 7.Seco J, Robertson D, Trofimov A, et al. Breathing interplay effects during proton beam scanning: Simulation and statistical analysis. Phys Med Biol. 2009;54:N283–N294. doi: 10.1088/0031-9155/54/14/N01. [DOI] [PubMed] [Google Scholar]
- 8.Bert C, Grozinger SO, Rietzel E. Quantification of interplay effects of scanned particle beams and moving targets. Phys Med Biol. 2008;53:2253–2265. doi: 10.1088/0031-9155/53/9/003. [DOI] [PubMed] [Google Scholar]
- 9.Riboldi M, Orecchia R, Baroni G. Real-time tumour tracking in particle therapy: Technological developments and future perspectives. Lancet Oncol. 2012;13:e383–e391. doi: 10.1016/S1470-2045(12)70243-7. [DOI] [PubMed] [Google Scholar]
- 10.Schatti A, Zakova M, Meer D, et al. Experimental verification of motion mitigation of discrete proton spot scanning by re-scanning. Phys Med Biol. 2013;58:8555–8572. doi: 10.1088/0031-9155/58/23/8555. [DOI] [PubMed] [Google Scholar]
- 11.Li Y, Kardar L, Li X, et al. On the interplay effects with proton scanning beams in stage iii lung cancer. Medical physics. 2014;41:021721. doi: 10.1118/1.4862076. [DOI] [PMC free article] [PubMed] [Google Scholar]
- 12.Knopf AC, Hong TS, Lomax A. Scanned proton radiotherapy for mobile targets—the effectiveness of re-scanning in the context of different treatment planning approaches and for different motion characteristics. Phys Med Biol. 2011;56:7257–7271. doi: 10.1088/0031-9155/56/22/016. [DOI] [PubMed] [Google Scholar]
- 13.Grassberger C, Dowdell S, Lomax A, et al. Motion interplay as a function of patientparameters and spot sizeinspot scanning proton therapy for lung cancer. Int J Radiat Oncol Biol Phys. 2013;86:380–386. doi: 10.1016/j.ijrobp.2013.01.024. [DOI] [PMC free article] [PubMed] [Google Scholar]
- 14.Grassberger C, Dowdell S, Sharp G, et al. Motion mitigation for lung cancer patients treated with active scanning proton therapy. Medical physics. 2015;42:2462–2469. doi: 10.1118/1.4916662. [DOI] [PMC free article] [PubMed] [Google Scholar]
- 15.Li H, Li Y, Zhang X, et al. Dynamically accumulated dose and 4d accumulated dose for moving tumors. Medical physics. 2012;39:7359–7367. doi: 10.1118/1.4766434. [DOI] [PMC free article] [PubMed] [Google Scholar]
- 16.Gillin MT, Sahoo N, Bues M, et al. Commissioning of the discrete spot scanning proton beam delivery system at the university of texas m.D. Anderson cancer center, proton therapy center, houston. Medical physics. 2010;37:154–163. doi: 10.1118/1.3259742. [DOI] [PMC free article] [PubMed] [Google Scholar]
- 17.Li Y, Zhu RX, Sahoo N, et al. Beyond gaussians: A study of single-spot modeling for scanning proton dose calculation. Physics in medicine and biology. 2012;57:983–997. doi: 10.1088/0031-9155/57/4/983. [DOI] [PMC free article] [PubMed] [Google Scholar]
- 18.Zhu XR, Poenisch F, Lii M, et al. Commissioning dose computation models for spot scanning proton beams in water for a commercially available treatment planning system. Medical physics. 2013;40:041723. doi: 10.1118/1.4798229. [DOI] [PMC free article] [PubMed] [Google Scholar]
- 19.Zhu XR, Sahoo N, Zhang X, Robertson D, Li H, Choi S, Lee AK, Gillin MT. Intensity modulated proton therapy treatment planning using single-field optimization: The impact of monitor unit constraints on plan quality. Medical physics. 2010;37:1210–1219. doi: 10.1118/1.3314073. [DOI] [PMC free article] [PubMed] [Google Scholar]
- 20.Fitzpatrick MJ, Starkschall G, Balter P. Antol. A novel platform simulating irregular motion to enhance assessment of respiration-correlated radiation therapy procedures. Journal of applied clinical medical physics / American College of Medical Physics. 2005;6:13–21. doi: 10.1120/jacmp.v6i1.2058. [DOI] [PMC free article] [PubMed] [Google Scholar]
- 21.Kardar L, Li Y, Li X, Li H, Cao W, Chang JY, Liao L, Zhu RX, Sahoo N, Gillin M. Evaluation and mitigation of the interplay effects of intensity modulated proton therapy for lung cancer in a clinical setting. Practical radiation oncology. 2014;4:e259–e268. doi: 10.1016/j.prro.2014.06.010. [DOI] [PMC free article] [PubMed] [Google Scholar]
- 22.Kang Y, Zhang X, Chang JY, Wang H, Wei X, Liao Z, Komaki R, Cox JD, Balter PA, Liu H, Zhu XR, Mohan R, Dong L. 4d proton treatment planning strategy for mobile lung tumors. International journal of radiation oncology, biology, physics. 2007;67:906–914. doi: 10.1016/j.ijrobp.2006.10.045. [DOI] [PubMed] [Google Scholar]
- 23.Li H, Liu W, Park P, et al. Evaluation of the systematic error in using 3d dose calculation in scanning beam proton therapy for lung cancer. Journal of applied clinical medical physics / American College of Medical Physics. 2014;15:4810. doi: 10.1120/jacmp.v15i5.4810. [DOI] [PMC free article] [PubMed] [Google Scholar]
- 24.Wang H, Dong L, O'Daniel J, et al. Validation of an accelerated ’demons’ algorithm for deformable image registration in radiation therapy. Physics in medicine and biology. 2005;50:2887–2905. doi: 10.1088/0031-9155/50/12/011. [DOI] [PubMed] [Google Scholar]
- 25.Mori S, Inaniwa T, Furukawa T, et al. Amplitude-based gated phase-controlled rescanning in carbon-ion scanning beam treatment planning under irregular breathing conditions using lung and liver 4DCTs. J Radiat Res. 2014;55:948–958. doi: 10.1093/jrr/rru032. [DOI] [PMC free article] [PubMed] [Google Scholar]
- 26.Mori S, Inaniwa T, Furukawa T, et al. Effects of a difference in respiratory cycle between treatment planning and irradiation for phase-controlled rescanning and carbon pencil beam scanning. Br J Radiol. 2013;86:20130163. doi: 10.1259/bjr.20130163. [DOI] [PMC free article] [PubMed] [Google Scholar]
- 27.Herzen J, Todorovic M, Cremers F, et al. Dosimetric evaluation of a 2D pixel ionization chamber for implementation in clinical routine. Phys. Med. Biol. 2007;52:1197–1208. doi: 10.1088/0031-9155/52/4/023. [DOI] [PubMed] [Google Scholar]
Associated Data
This section collects any data citations, data availability statements, or supplementary materials included in this article.


