Abstract
Tractography is becoming an increasingly popular method to reconstruct white matter connections in vivo. The diffusion MRI data that tractography is based on requires a high angular resolution to resolve crossing fibers whereas high spatial resolution is required to distinguish kissing from crossing fibers. However, scan time increases with increasing spatial and angular resolutions, which can become infeasible in clinical settings. Here we investigated the trade-off between spatial and angular resolutions to determine which of these factors is most worth investing scan time in. We created a unique diffusion MRI dataset with 1.0 mm isotropic resolution and a high angular resolution (100 directions) using an advanced 3D diffusion-weighted multi-slab EPI acquisition. This dataset was reconstructed to create subsets of lower angular (75, 50, and 25 directions) and lower spatial (1.5, 2.0, and 2.5 mm) resolution. Using all subsets, we investigated the effects of angular and spatial resolutions in three fiber bundles—the corticospinal tract, arcuate fasciculus and corpus callosum—by analyzing the volumetric bundle overlap and anatomical correspondence between tracts. Our results indicate that the subsets of 25 and 50 directions provided inferior tract reconstructions compared with the datasets with 75 and 100 directions. Datasets with spatial resolutions of 1.0, 1.5, and 2.0 mm were comparable, while the lowest resolution (2.5 mm) datasets had discernible inferior quality. In conclusion, we found that angular resolution appeared to be more influential than spatial resolution in improving tractography results. Spatial resolutions higher than 2.0 mm only appear to benefit multi-fiber tractography methods if this is not at the cost of decreased angular resolution.
Introduction
In recent years, diffusion magnetic resonance imaging (MRI) has attracted attention for its potential to reconstruct fiber tract pathways within the white matter (WM) using fiber tractography (e.g., Mori et al. 1999; Basser et al. 2000; Behrens et al. 2007; Jones 2008). High angular resolution diffusion imaging (HARDI) methods have been proposed to describe the measured diffusion profile with a higher accuracy than the diffusion tensor (e.g., Basser et al. 1994; Frank 2002; Tournier et al. 2004; Tuch 2004; Descoteaux et al. 2007). By describing the diffusion signals with a higher angular resolution on a single shell in q-space (Callaghan et al. 1988), orientation distribution functions (ODFs) can be estimated that allow for more accurate representations of diffusion in complex fiber architecture. These multi-fiber methods can be used to boost tractography performance, by more accurately tracking through regions of crossing fibers (Descoteaux et al. 2009; Fillard et al. 2011; Jeurissen et al. 2011; Wedeen et al. 2012), and have already found their way into clinical research studies (e.g., Reijmer et al. 2012) and presurgical planning (e.g., Winston et al. 2014). In parallel to the developments of multi-fiber methods, improvements in diffusion-weighted image (DWI) acquisition have led to an increase in spatial resolution (e.g., McNab and Miller 2008; McNab et al. 2009; O’Halloran et al. 2013; Engstrom and Skare 2013), which increase the spatial accuracy with which to distinguish neighboring structures within the brain.
A high angular resolution is essential for accurate diffusion modeling per voxel, whereas a high spatial resolution is required for accurate localization of anatomy. Specifically, multi-fiber tractography can resolve multiple fibers within a voxel, but has a difficulty distinguishing between crossing and kissing fibers (Tournier et al. 2011). A high spatial resolution, however, aids in making this distinction. Such different complex fiber configurations are present in vivo and these configurations coexist within one voxel to various degrees, which means a high angular and a high spatial resolution would be optimal to resolve the highly complex fiber architecture.
So far, research has mostly focused on improving either spatial or angular resolution. In this work, we aim to bridge the two, investigating the trade-off between angular and spatial resolutions. Early investigations into the effects of angular or spatial resolution on tractography focussed on either one of the two effects, or independently looking at both. (Kim et al. 2006), for instance, have looked at the effects of voxel size on diffusion tensor tractography and were one of the first studies to demonstrate the benefit of isotropic voxel sizes. For multi-fiber methods, the effects of angular and spatial resolutions were first examined independently of one another by Zhan et al (2012) to be followed up by the first study investigating the trade-off between angular and spatial resolutions (Zhan et al. 2013), using short time-matched acquisition protocols with different angular and spatial resolutions to show the added signal-to-noise ratio (SNR) of lower spatial resolutions improved tractography results in a hardware phantom in the low SNR regime. More recently, Calabrese et al. (2014) showed in an extensive ex vivo macaque study using six time-matched protocols with varying spatial and angular resolutions that tractography results greatly vary depending on the acquisition protocol, finding an optimal balance at intermediate spatial and angular resolutions.
In this study we aim to extend these last works into high-end in vivo data, comparing a unique human in vivo dataset that offers both high spatial and high angular resolution to subsamples of this dataset that have either a high spatial or high angular resolution. The overarching aim of this study was to determine whether increasing spatial or angular resolution provides the largest gain and when (if at all) there are diminishing returns. Especially for clinical settings, where scan time is limited, it is important to determine where scan time is best invested in.
Materials and methods
Simulated datasets
Simulations of diffusion-weighted signals for single and crossing fiber configurations have already shown huge benefit in validating multi-fiber methods, both in terms of accuracy, precision, and theoretical optimal acquisition settings (e.g., Jeurissen et al. 2013; Tournier et al. 2013; Zhan et al. 2013). These contributions from simulations are essential in informing the community on the performance of multi-fiber methods under varying SNRs, modeling parameters, and number of gradient directions. These, however, often focus on crossing configurations. To determine how well tractography can resolve different complex fiber geometries under varying angular and spatial resolutions, tractography results from simulations were used. Three configurations are used: crossing, or interdigitating, fibers; brushing fibers; and kissing fibers (as shown in the first column of Fig. 1). These configurations were created using the methods from Leemans et al. (2005) in ExploreDTI (Leemans et al. 2009) with a fiber bundle thickness of 1 mm, with the two fiber populations coming together at a 65° angle within the axial plane. The individual fiber populations were simulated as cylindrically symmetric (i.e., λ2 = λ3) diffusion tensors (simulated with FA = 0.9 and MD = 0.7×10⁻³ mm2/s). Diffusion-weighted images were generated at b = 1000 s/mm2 for each configuration at 1 mm isotropic resolution (at an SNR of 10; Sijbers and den Dekker 2004) and two angular resolutions (25 and 100 gradient orientations sampled on the half-sphere Jones et al. 1999). The simulated DWIs at 1 mm resolution were downsampled to 2 mm for comparison at both resolutions. Multi-fiber deterministic tractography was performed on these datasets as detailed in Section Fiber tractography for the in vivo data.
Fig. 1.
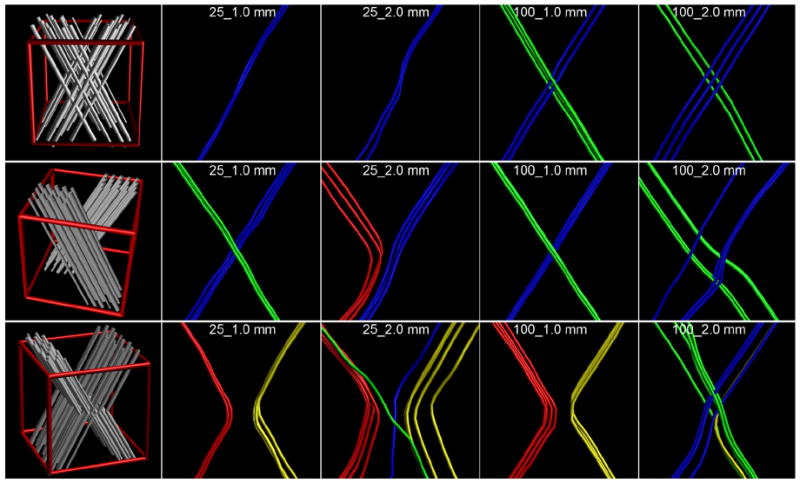
View of the three simulated complex geometries. The top row shows crossing or interdigitating fibers; the middle row brushing fibers; the bottom row shows kissing fibers. The left-most panel in each row is an illustration of how such a configuration looks, with the red cube indicating a 2 mm isotropic voxel in which such a configuration is simulated. The results are shown for four combinations of spatial and angular resolutions. To clearly indicate which tracts connect which branches, the tracts have been color-coded as: blue connects the top-right with the bottom-left; green connects top-left with bottom-right; red connects top-left with bottom-left; and yellow connects top-right with bottom-right. For the top two rows, with crossing and brushing fibers, the green and blue tracts are correct; for the bottom row, with kissing fibers, the red and yellow tracts are correct.
Data acquisition
A variant of the recently proposed 3D multi-slab EPI method by Engstrom and Skare (2013) was used to acquire high-resolution isotropic DWI data. While conventional 2D acquisitions only Fourier-encode each slice in-plane (kx and ky), 3D acquisitions also encode each slab along the z-direction, kz Here, a slab of 7 mm thickness was excited, and read out with a field-of-view (FOVSLAB) of 232 × 232 × 8 mm and an acquisition matrix (matrixSLAB) of 232 × 232 × 8 was used to achieve 1 mm isotropic resolution. The matrix was acquired by ‘stacking’ 2D EPI readouts, each with a different phase-encoding along the kz-dimension. Each of the 8 kz phase-encodes was acquired in a separate excitation. Each in-plane EPI readout was performed with a GRAPPA acceleration factor of 4 and a partial Fourier factor of 0.7. A two-echo readout was used: the first echo was used for the imaging data and the second was used as navigator for non-linear 2D phase correction before combining the kz-encodes. Given the small slab thickness, through-plane phase errors were ignored. The echo time of the imaging and navigator echoes were 71.5 and 146.6 ms, respectively, for a TR of 7 s. As for most MR acquisitions, the slab profile — with a prescribed 7 mm thickness—was not perfectly rectangular. To account for slab boundary artifacts and prevent aliasing of the slab back onto itself (see Fig. 2 in Engstrom and Skare 2013), only 5 of the 8 kz-encodes of 1 mm each were used. Thirty slabs were acquired and spaced in such a way that the combination of the 5 mm volume of the 3rd–7th kz-encodes of each slab formed a continuous coverage of 150 mm to image the entire brain. Imaging was performed on single female subject (30 years old; healthy, no lesions) on a 3 T GE MR750 scanner with a Nova Medical 32-channel head coil.
Fig. 2.
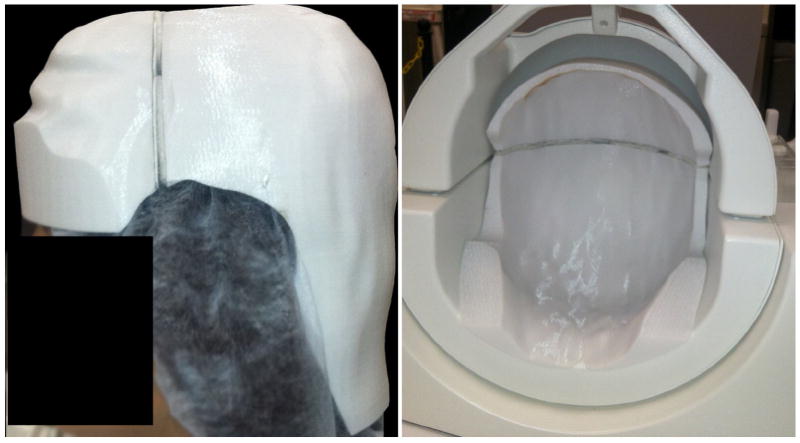
Image of the custom-made 3D-printed head holder on the scan subject’s head (a), shown from the side of the subject’s head with a black box over the face for anonymization. In b), the head holder is positioned in the coil.
For the HARDI acquisition scheme, 100 unique gradient orientations were acquired (Jones et al. 1999) with a b-value of 1000 s/mm2 and single-refocused diffusion preparation. To account for possible background gradients that could modify the diffusion-weighting orientation and magnitude (Neeman et al. 1991), each gradient orientation was acquired with opposing directions (i.e., gradient directions g = [0 0 1] and g = [0 0–1]).
To achieve DWI data with a high geometric fidelity, a high in-plane parallel imaging acceleration of 4 was used, as shown by Holdsworth et al. (2012) to greatly reduce EPI distortions. In order to reduce geometric distortions even further, each DWI was acquired two times, once with the phase-encoding direction in the posterior–anterior direction (blip-up), and once in the anterior–posterior direction (blip-down Chang and Fitzpatrick 1992; Skare and Bammer 2010).
Each of the 100 unique gradient orientations was acquired with two EPI phase-encoding directions (AP and PA) and opposite gradient directions (AP+, AP−, PA+, and PA−), for a total of 100 × 2 × 2 = 400 DWIs. In addition, 40 volumes without diffusion-weighting were acquired (b = 0-images, 20 with ‘blip-up’ and 20 with ‘blip-down’). Because of the 3D nature of the sequence, the total acquisition time per image was TACQ = TR × NKz = 56 s, for a total acquisition time of 440 × 56 s = 24,640 s = 6 h50 m40 s. To acquire this amount of data, the total acquisition was fragmented into 20 sessions of 20.5 min., which were performed over several weeks. Scanner stability over the study duration was monitored, as detailed in a study performed on the same scanner at the same time (Maclaren et al. 2014). In each session, 20 DWIs and 2 b = 0-images were acquired as follows: 5 unique gradient orientations acquired with AP+, AP−, PA+, and PA−; and one b = 0-image with opposite EPI phase-encoding readout.
To ensure accurate repositioning over different scan sessions, and thus reliable data fusion, a custom-made ‘head holder’ was created based on the geometry of the head coil—as determined via CT—and an anatomical MR scan of the subject’s head (Fig. 2). As a result, this head holder molded around the subject’s head and fit tightly into the head coil for immobilization and near-perfect repositioning. The head coil used in this work had a non-circular cross-section so that the insertable head holder fit into the coil in only one unique way. The head holder was constructed using a 3D printer, and yielded a very high repositioning accuracy over repeated scans (<1°). A more detailed description of this positioning approach and its validation can be found in Vos et al. (2013a). This head holder also helped to prevent intra-volume motion—a risk that could seriously corrupt the acquired images and decrease scanning efficiency if not prevented. Note that given the longer scan time per volume compared with 2D imaging, 3D imaging is much more prone to motion artifacts—as any motion during the scanning of a volume could render the 3D k-space of each slab erroneous.
In addition, a single T1-weighted structural scan was acquired using the same 32-channel head coil and head holder. A sagittal 3D FSPGR scan with a 256 × 256 × 192 mm field-of-view (AP × IS × LR) and an acquisition matrix of 256 × 256 × 192 was made to obtain a 1 mm isotropic resolution structural image. Sequence parameters include TE/TR/TI of 3.0/7.3/400 ms, and a flip angle of 11°.
Image preprocessing
Prior to analysis, data had to be fused from the different scan sessions into one dataset. First, each dataset was corrected for possible background gradients and EPI distortions by combining an affine transformation of the corresponding opposite gradient orientations using elastix (Klein et al. 2010) with the Jacobian-weighted reverse gradient polarity method (RGPM) using a multi-resolution b-spline registration (Chang and Fitzpatrick 1992; Skare and Bammer 2010). The order of these two image registrations was chosen such that the affine registration was done first, to increase the image SNR for the non-linear b-spline registration of the EPI distortion. Image intensities were normalized across sessions based on the b = 0-images (similar to Froeling et al. 2014). Lastly, all datasets were combined (similar to Froeling et al. 2014), correcting each DWI for eddy current induced geometric distortions and subject motion by realigning all DWIs and b = 0-images to the the b = 0-image of the first session using elastix (Klein et al. 2010), with an affine coregistration technique and mutual information as the cost function. In the same registration step, this DWI dataset was also transformed to the T1-weighted structural scan (Rohde et al. 2004). The diffusion-encoding gradients were reoriented to account for subject motion (Leemans and Jones 2009).
Reconstruction of datasets with different spatial and angular resolutions
The full 1 mm isotropic dataset with 100 directions (dubbed 100_1.0 mm) was reconstructed into optimal subsets of 75 (75_1.0 mm), 50 (50_1.0 mm), and 25 (25_1.0 mm) of the acquired directions. Here, the aim was to achieve as uniform a sampling on the half-sphere as possible. These optimal subsets were selected based on their condition number of the gradient sampling scheme (Skare et al. 2000; Dubois et al. 2006). The total number of permutations is , or roughly 1029, making it impossible to calculate the condition number of each subset. Instead, 107 random subsets were created and from this the optimal subset was chosen. In addition, these datasets were also spatially subsampled to 1.5 mm, 2.0 mm, and 2.5 mm isotropic resolution (25_1.5 mm, 25_2.0 mm, 25_2.5 mm, etc). This subsampling was done in image-space to ensure equal downsampling effects in all three dimensions, where all imaging volumes were downsampled independently. Interpolation after downsampling was done using a trilinear interpolation—which has inherent anti-aliasing properties. With large downsampling factors the downsampled image may no longer give a complete representation of the underlying high-resolution data. We used a 3 × 3 × 3 trilinear interpolation kernel centered on the point of interest with kernel weights varying by downsampling factor. This can be regarded as a linear version of the work recently presented by Cardoso et al. (2015).
Fiber tractography
For each reconstructed dataset, second-order diffusion tensors were estimated using the iterative weighted least-squares approach (Veraart et al. 2013) to generate fractional anisotropy and directionally-encoded color maps used to delineate tract inclusion and exclusion regions. Constrained-spherical deconvolution (CSD, (Tournier et al. 2007)) was used to calculate the fiber ODF (fODF) using a recursive response function calibration, using the settings from that original paper (Tax et al. 2014). The fODF peak amplitude was set to 0.1, similar to the settings in (Jeurissen et al. 2011, 2013). Multiple values for the maximum order of spherical harmonics (LMAX) were used (4, 6, and 8) except for the 25-direction datasets where only LMAX = 4 was used. The fODFs were created at the respective voxel grid for each spatial resolution.
Whole-brain deterministic multi-fiber tractography was performed based on the fODF peaks in ExploreDTI, using trilinear interpolation of the voxel-wise fODF spherical harmonic coefficients. An isotropic 1.5 × 1.5 × 1.5 mm3 seeding grid was used for all datasets. From these whole-brain tractography results, several fiber bundles were segmented:
the arcuate fasciculus (AF), as described in Catani and Thiebaut de Schotten (2008);
the corticospinal tracts (CSTs) that terminate in the primary motor cortex (M1) were segmented as described in Wakana et al. (2007) and Aarnink et al. (2014). The ROIs selecting M1 were 26 mm superior to the corpus callosum on the mid-sagittal slice;
the trans-callosal bundle connecting the bilateral M1 areas, which will be abbreviated to M1–M1. The same M1 selecting ROIs were used as for the selection of the CST.
Detailed illustrations of the tract-selection process are shown in the Supplementary material. All tracts were included that intersected both bundle-selecting ROIs.
To investigate how the results of deterministic tractography compare with probabilistic tractography, probabilistic multi-fiber tractography of the bilateral CST was performed in MRtrix (Tournier et al. 2012). Here, the inferior tract-selecting ROI was used as seed region from where 20,000 tracts were seeded, only including those that ended up in the superior ROI (using the same ROIs as for the deterministic tractography).
Analysis
Simulated datasets
For each of the three complex fiber geometries—crossing, brushing, and kissing—tracts were extracted for each of the possible subparts. In any two-fiber crossing, there are four branches that could each be connected. Connections between each branch were investigated to determine how well datasets of varying spatial and angular resolutions could resolve the three configurations, and results interpreted solely based on whether the correct connections were retrieved and whether or not wrong connection was found.
In vivo datasets
The anatomical accuracy of fiber tracts is difficult to quantify, given that no ground truth of the wiring of the human brain exists. None of the acquired datasets can be regarded as the ‘gold standard’ for this work, but given that the full 100_1.0 mm dataset using LMAX = 8 has the highest angular and spatial resolutions, and should therefore provide the “best” results in terms of tractography, overlap values were determined with respect to this reference. Because of this lack of a gold standard, it is only possible to compare datasets against each other, and to previously published work on neural anatomy (e.g., Catani and Thiebaut de Schotten 2008).
Volumetric overlap
To quantify the volumetric overlap between segmented fiber tract bundles from different datasets, a binary mask was created of all voxels intersected by the tract pathways included in that bundle. Because tracts are continuous space-curves, this tract-mask is not restricted to the voxel size of the dataset it was created from (as for instance demonstrated in track density imaging, Calamante et al. 2010). For all datasets, the tract masks were created at a 1 mm isotropic resolution. For the fiber bundles from deterministic tractography any tract that intersected a voxel at any point within its volume was counted as being included in the binary mask. For probabilistic tractography at least five tracts should intersect a voxel at any point to be included in the binary mask. A higher threshold was used to account for the large number of tracts initiated from the seed region. From these binary masks the volumetric overlap was quantified as the Dice similarity coefficient (Dice 1945):
| (1) |
where maskA and maskB are the tract masks of the reconstructed bundles to be compared, and ∩ indicates the overlap of the masks. The Dice similarity is bounded between total overlap, 1, and no overlap, 0. All overlap values are determined with respect to the 100_1.0 mm LMAX = 8 reference. Dice overlap scores are the method of choice in reproducibility studies into in vivo fiber tractography (e.g., (Besseling et al. 2012; Bauer et al. 2013; Kristo et al. 2013b; Dayan et al. 2015) which helps put the obtained overlap values in this work into perspective.
Anatomical correspondence
Volumetric overlap is one of the many possible criteria of fiber tract bundle correspondence. Termination points of fiber bundles are another important aspect. Because of the different configurations of the fiber bundles, this is evaluated differently for each fiber bundle:
The segment of the AF investigated connects two language areas: Wernicke’s and Broca’s in the temporal and frontal lobes, respectively (Dejerine 1895; Benson et al. 1973; Catani et al. 2005). Tract reconstructions were evaluated based on their ability to show cortical projections into these areas;
Tracts from the CST should terminate in the M1 gyrus. The superior ROI used to select these tracts was drawn around M1, and the fraction of voxels in this ROI penetrated by fiber tracts was inspected for each reconstructed dataset;
Trans-callosal fibers that connect the bilateral M1 areas were evaluated similar to the tracts from the CST.
Methodological validation
Test–retest, or scan–rescan, experiments on multi-fiber tractography of fiber bundles have already shown that volumetric overlap can be markedly lower than unity (e.g., Kristo et al. 2013b; Dayan et al. 2015), possible as a result from noise-related small variations in local fODF estimation. To put the obtained overlap values between different reconstructed datasets into perspective with respect to such test–retest variation, internal reference values of the volumetric overlap were generated. From the full 100_1.0 mm datasets, ten ‘test sets’ were created where one random gradient direction was removed from each, generating very similar datasets. Because these ‘test sets’ were nearly identical, only very minor changes in local fODF estimation and subsequently in tractography results were expected, and the volumetric overlap values for each fiber bundle between all combinations of these ten ‘test sets’ (45 combinations) can be used as a reference standard against which to compare the overlap values from the differently reconstructed datasets.
Results
Simulations
The results of tractography are shown in Fig. 1 for each of the three configurations. For the three different complex geometries, angular and spatial resolutions have different benefits. For a true crossing, the two datasets with a low angular resolution could only resolve one of the populations. Here, a high spatial resolution does not help in resolving the crossing—one instead needs a high angular resolution. For brushing fibers, as one might have on the interface between two distinct fiber populations (e.g., the cingulum and the corpus callosum), a high spatial or a high angular resolution both aid in resolving the intersection. Here, the dataset with low angular and low spatial resolutions could correctly follow one bundle but also finds an erroneous connection. In this case, the low spatial resolution of 2 mm isotropic showed a larger variability in tract location due to the increased partial voluming effect. The kissing fiber experiment shows that a high spatial resolution is essential. Both datasets with 1 mm resolution perfectly separate the two kissing bundles, whereas both datasets with low spatial resolution also find crossings when these are not there. Here, the low angular resolution of the 25_2.0 mm dataset seems to perform better than the 100_2.0 mm dataset. Here, the 25_2.0 mm dataset has insufficient angular resolution to resolve the complex configuration, whereas the 100_2.0 mm datasets resolves this area—wrongly—as a crossing. As such, the 25_2.0 mm dataset that cannot resolve the configuration seems to perform better.
Dataset reconstruction
Example diffusion-encoded color (DEC) maps of the full 100_1.0 mm dataset and the datasets reconstructed at lower spatial resolutions are shown in axial and coronal views in Fig. 3.
Fig. 3.
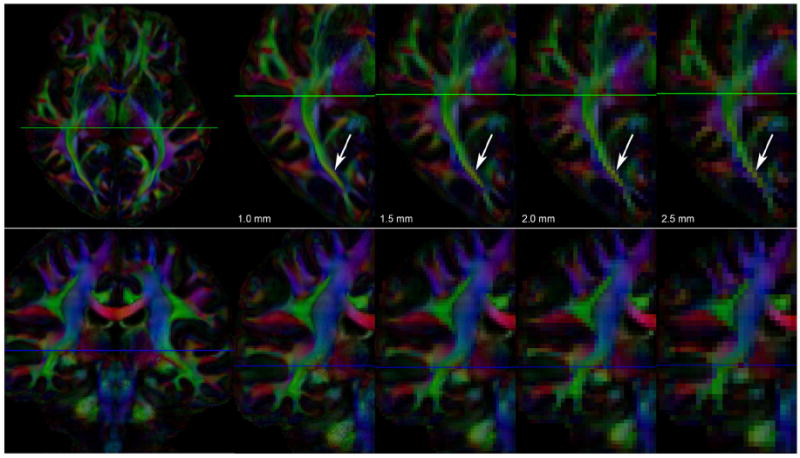
Axial and coronal views (top and bottom rows, respectively) of the DEC-maps of datasets with 100 gradient directions reconstructed at four different spatial resolutions: 1.0, 1.5, 2.0, and 2.5 mm. The voxel volumes of these datasets are 1, 3.375, 8, and 15.625 mm3, respectively. For both rows, the left-most panel shows the entire slice at 1 mm resolution. For the axial view in the top row, the zoomed-in area shows the posterior half of one hemisphere; for the coronal view in the bottom row, the zoomed-in area shows one hemisphere. The green lines in the axial image indicate the shown coronal slices; the blue lines in the coronal image the shown axial slices. The differences in spatial resolution are strongly reflected in the amount of partial volume effect, as most clearly seen in the posterior part of the optic radiation (indicated by the arrows).
Methodological validation
The overlap between the fiber bundles from deterministic tractography in the two near-identical test sets with 99 gradient directions is shown in Table 1, where the mean, minimum, and maximum overlaps are shown for each bundle over the 45 combinations from the ten subsets. Example fiber bundles of the structures with the highest (M1–M1) and lowest (AF) overlaps are shown in Fig. 4 from two test sets, to visualize where these differences occur. Although visually there are only minor differences in the reconstruction of these bundles, the volumetric overlap is lower than 1 (which would have indicated perfect overlap). For the probabilistic tractography results from the bilateral CST the test–retest overlap values were lower, 0.81 for the left and 0.75 for the right bundle.
Table 1.
Dice overlap for test–retest experiment.
| Mean [range] | ||
|---|---|---|
| AF | Left | 0.87 [0.86–0.88] |
| Right | 0.86 [0.84–0.88] | |
| M1–M1 | 0.95 [0.93–0.96] | |
| CST (det) | Left | 0.92 [0.91–0.94] |
| Right | 0.91 [0.90–0.93] | |
| CST (prob) | Left | 0.81 [0.80–0.82] |
| Right | 0.77 [0.76–0.79] |
AF = arcuate fasciculus; CST = corticospinal tracts.
Fig. 4.
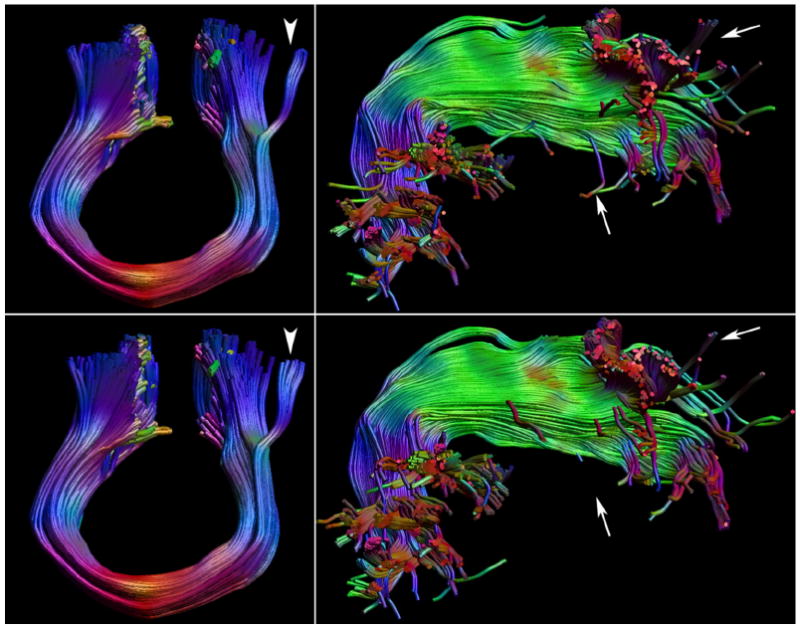
Test comparison of the fiber bundles between the two test sets with 99 directions, 1.0 mm, and LMAX = 8 for the M1–M1 tracts and right arcuate fasciculus (AF). The top panels show the bundles of one test set with 99 directions, the bottom row the other test set of 99 directions. Of all five investigated bundles in this test example, the M1–M1 (shown on the left) has the highest overlap, 0.94, the right AF (shown on the right) the lowest, 0.84. Very minor changes can be observed along the cores of the bundles, with the largest differences for the M1–M1 in tracts branching of laterally (white arrowhead), and for the AF in its frontal and lateral temporal projections (white arrows).
Comparison of spatial and angular resolutions
The overlap in reconstructed tract volumes is shown in Figs. 5-8, for the AF, CST, and M1–M1 tracts, respectively. The fiber bundles are visualized in Figs. 9-14, respectively. This allows for inspection of where differences are, facilitating the interpretation of why any differences in volumetric overlap occur.
Fig. 5.
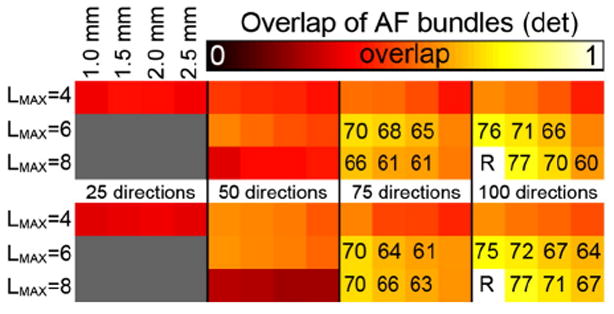
Volumetric overlap between the AF fiber tracts reconstructed from datasets with different spatial and angular resolutions using deterministic tractography. The top panel shows overlap values for the left AF, the bottom panel for the right AF. The overlap values are with respect to the 100_1.0 mm tracts with LMAX = 8. For each panel, the rows indicate the LMAX values used, the columns indicate the angular and spatial resolutions of the data as indicated. Overlap values (×100) are given in case of moderate overlap, i.e., ≥0.6.
Fig. 8.
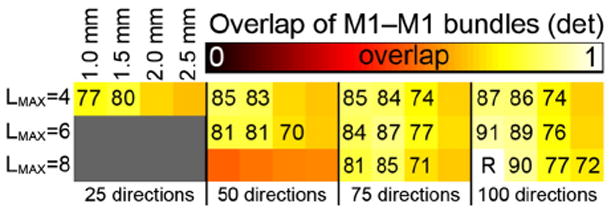
Volumetric overlap between the M1—M1 fiber tracts reconstructed from datasets with different spatial and angular resolutions using deterministic tractography. The overlap values are with respect to the 100_1.0 mm tracts with LMAX = 8. For each panel, the rows indicate the LMAX values used, the columns indicate the angular and spatial resolutions of the data as indicated. Overlap values (×100) are given in case of moderate overlap, i.e., ≥0.7.
Fig. 9.
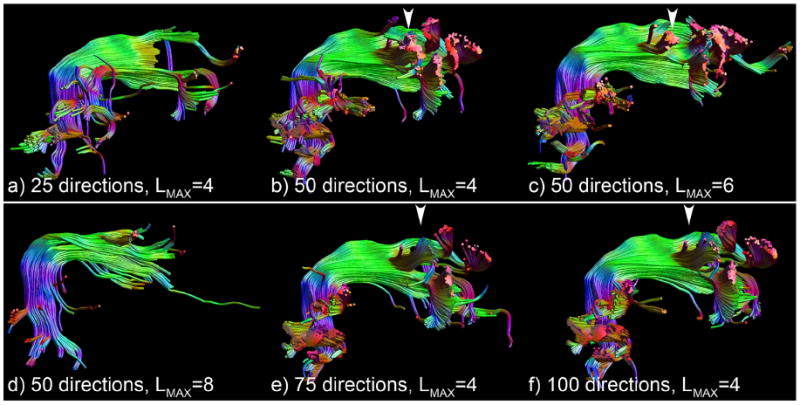
Tractography results of the right arcuate fasciculus a spatial resolution of 2.0 mm and all datasets with 25 (a) and 50 directions (b–d) and the datasets with 75 (e) and 100 (f) directions with LMAX = 4. Clear premature termination is visible in a), and insufficient SNR is present in the 50 direction dataset to use LMAX = 8 (d). The other datasets suffer from incorrect branching into the lateral projections of the corpus callosum, as indicated by the white arrowheads. Although examples from only the 2.0 mm datasets are shown for clarity, identical errors are present for other spatial resolutions for low angular resolution and low LMAX.
Fig. 14.
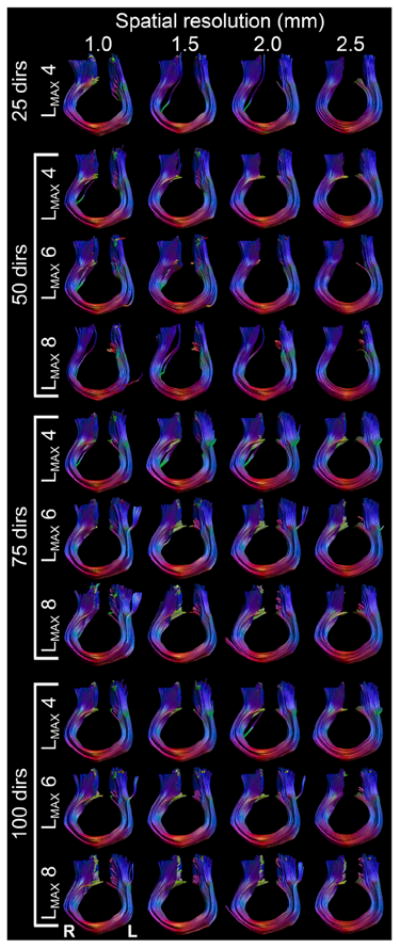
Tractography results of the M1–M1 tracts for all combinations of spatial and angular resolution and LMAX values.
Arcuate fasciculus
Volumetric overlap
These results clearly show that the datasets with only 25 directions are inadequate to capture the complete AF, where the reduced volumetric overlap originates largely from the more anterior part of the bundle (Fig. 9a). Similar limitations are visible using LMAX = 8 at only 50 directions (Fig. 9d). More generally, at the highest number of directions, 75 and 100, the use of LMAX = 4 seems to give inferior overlap compared with the LMAX = 6 and LMAX = 8 (5). From Fig. 9 one can see that the lower volumetric overlap for the datasets with 50 directions and for LMAX = 4 at 75 and 100 directions seem to arise from a similar origin: tracts branching off laterally in the middle of the AF that seem to belong to the corpus callosum. These limitations are present for all spatial resolutions for low angular resolution and low LMAX.
Anatomical correspondence
As the datasets with low angular resolution suffer from various errors (Fig. 9) only the datasets with 75 and 100 directions with LMAX = 6 and 8 (Fig. 10) will be discussed in more detail. The 75_1.0 and all datasets with 100 directions show more posterior and lateral projections off the temporal part of the AF, which are missed in the other low-resolution datasets with 75 directions at LMAX = 8 (arrows in Fig. 10). At the anterior end of the bundle, the only systematic difference seems to be that the higher spatial resolution datasets show tracts branching off superiorly (arrowheads in Fig. 10 indicate location in datasets with these branching tracts).
Fig. 10.
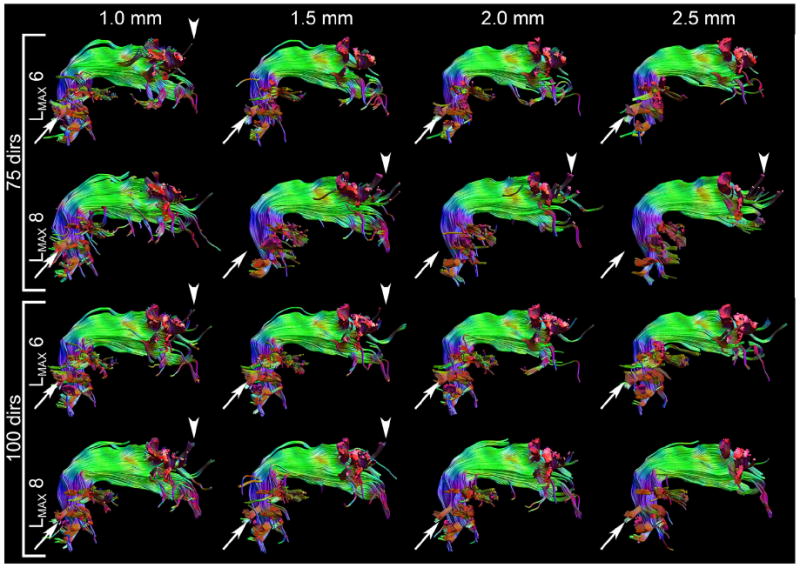
Tractography results of the right arcuate fasciculus for datasets with 75 and 100 directions at LMAX = 6 and 8 for all spatial resolutions. None of the errors present in the low angular resolution datasets (Fig. 9) are visible. The arrows indicate temporal projections that are missing in the 75 directions datasets with LMAX = 8 but are present in the other datasets. The arrowheads show anterior cortical projections in the datasets with high spatial resolution (1.0 and 1.5 mm) that are not found in the low spatial resolution cases (2.0 and 2.5 mm).
Corticospinal tracts
Volumetric overlap
In comparison with the test–retest overlap values from the methodological validation, the deterministic tractography fiber bundles from 25 directions (LMAX = 4) and 50 directions at LMAX = 8 demonstrate low (<0.7) volumetric overlap (Fig. 6). For the left CST, overlap is very high (≥0.80) between the 100_1.0 at LMAX = 8 reference standard and the other datasets with 100 directions except the 2.5 mm resolution cases, and high (≥0.75) for the 100_2.5 and all datasets with 75 directions. This indicates high similarities throughout a large range of parameters concerning spatial and angular resolutions. For the right CST, the overlap values are marginally lower, and a clear decrease in overlap is observed with spatial resolutions of 2.0 and 2.5 mm.
Fig. 6.
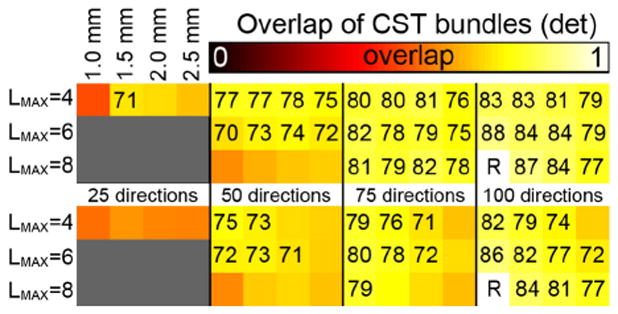
Volumetric overlap between the CST fiber tracts reconstructed from datasets with different spatial and angular resolutions using deterministic tractography. The top panel shows overlap values for the left CST, the bottom panel for the right CST. The overlap values are with respect to the 100_1.0 mm tracts with LMAX = 8. For each panel, the rows indicate the LMAX values used, the columns indicate the angular and spatial resolutions of the data as indicated. Overlap values (×100) are given in case of moderate overlap, i.e., ≥0.7.
For the probabilistic tractography similar patterns are observed albeit with lower absolute overlap values (Fig. 7), which could be expected from the lower overlap values from the test–retest experiments (0.75–0.81 vs 0.9 from deterministic tractography). The datasets seem to benefit more from higher spatial resolution, with relatively equal overlap at 1.0 and 1.5 mm and a stronger drop in overlap values when going from 1.5 to 2.0 mm then in the deterministic approach. Moreover, the difference between the 75 direction and 100 direction datasets seems smaller, with the 50 direction dataset also performing reasonably well.
Fig. 7.
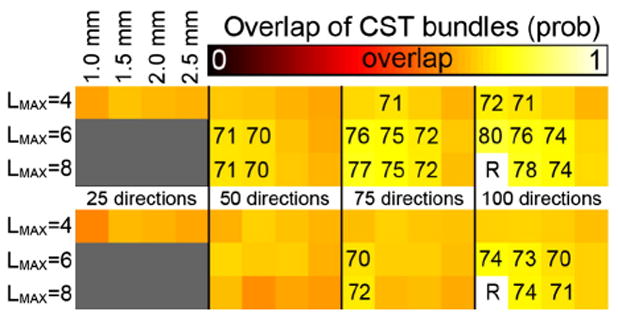
Volumetric overlap between the CST fiber tracts reconstructed from datasets with different spatial and angular resolutions using probabilistic tractography. The top panel shows overlap values for the left CST, the bottom panel for the right CST. The overlap values are with respect to the 100_1.0 mm tracts with LMAX = 8. For each panel, the rows indicate the LMAX values used, the columns indicate the angular and spatial resolutions of the data as indicated. Overlap values (×100) are given in case of high overlap, i.e., ≥0.7.
Anatomical correspondence
From Fig. 11, showing the left CST, it would appear that the majority of the volumetric differences arise from the inferior half of the CST. At the most inferior end, there are marked differences in how the tracts remain within the CST or branch also into the medial lemniscus (posterior to the CST), especially for lower LMAX and lower spatial resolution (open arrowhead). Where the CST should only contain fibers from the primary motor area, the medial lemniscus contains tactile fibers that terminate in the primary somatosensory area (Purves et al. 2001; O’Sullivan and Schmitz 2007; Oishi et al. 2011). These cortical areas are on different sides of the central sulcus, and the inclusion of these lemniscal tracts in the CST for the lower resolutions can therefore be regarded as a clear result of increased partial voluming. In the datasets with 75 and 100 directions, partial volume effects also cause tracts entering the cerebellar peduncles to appear at a lower spatial resolution (as indicated with closed arrowheads for the 100 directions datasets). For lower number of directions, LMAX, and spatial resolutions there is a tendency to pick up tracts that branch off medially towards the basal ganglia (as indicated by white arrows in Fig. 11).
Fig. 11.
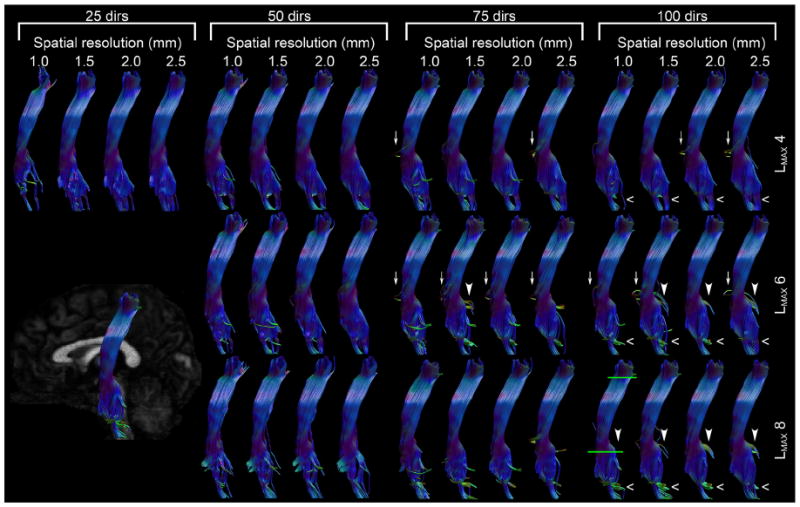
Tractography results of the corticospinal tracts for all combinations of spatial and angular resolutions and LMAX values. The inset in the bottom left corner shows the view angle. The green lines in the 100_1.0 panel indicate the bundle-selecting ROIs.
Cortical visitation
Fig. 12 shows how the primary motor cortices are penetrated by the bilateral CST from deterministic tractography. Here, for the right M1 the more lateral part of the cortex is visited by tracts, for instance in all spatial resolutions of the 100_LMAX = 8 cases, all of the 50_LMAX = 6 cases, and 75_1.5 and 75_2.0 at LMAX = 8. These projections were missed in the 75_1.0 dataset, likely because of a reduction in number of directions causing a reduction in angular SNR. The lower spatial resolutions (75_1.5 and 75_2.0) have increased SNR and can recover these parts. For all spatial resolutions, this is at the highest reliable LMAX value. Interestingly, intersection of the lateral part of the cortex by tracts seems to be consistent over the range of spatial resolutions. In contrast, whereas at 100 directions the CST reconstructed with LMAX = 8 do show these lateral parts consistently, they are fully absent when using LMAX = 6 or LMAX = 4 to reconstruct the same datasets. No clear distinction is found in the left M1 area, with almost no tracts ending up in the lateral parts. At lower spatial resolutions the shape of the cortex seems to be lost somewhat, with the visitation map becoming more continuous and compact compared with the high spatial resolutions.
Fig. 12.
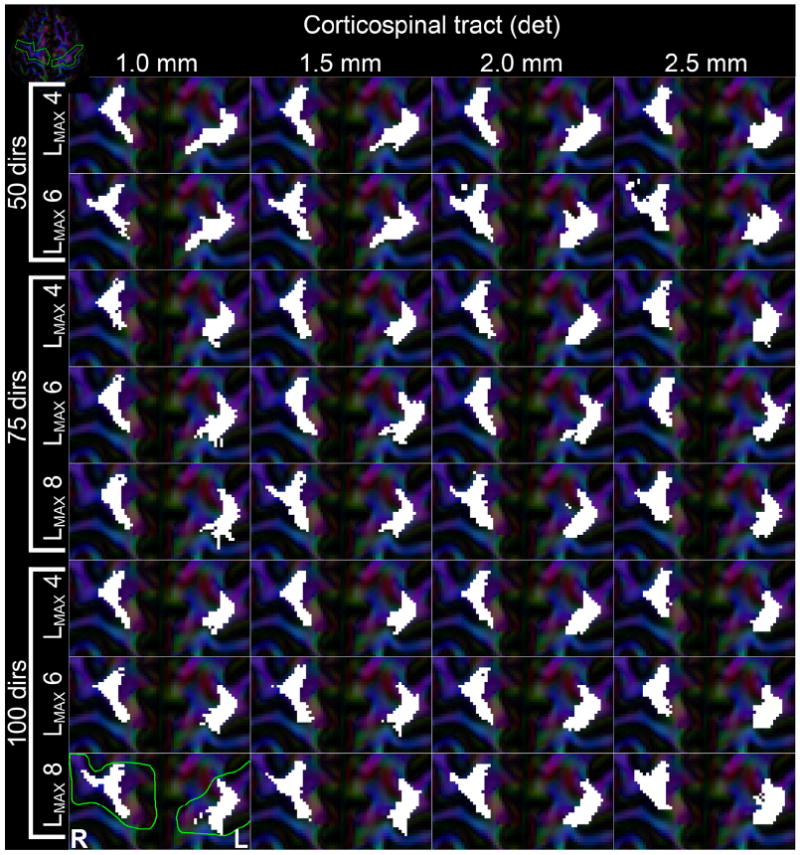
Visualization of where deterministic tractography fiber bundle of the bilateral CST end up in the M1 cortices. Each subpanel represents results from the different reconstructed datasets, with columns being different spatial resolutions and each row a combination of number of gradient directions and used LMAX, as indicated in the figure. White areas indicate voxels that were intersected by fiber tracts. The green line on the 100_1.0 LMAX = 8 panel indicates the ROI that selects the cortices. The inset in the top-left corner shows an overview of the axial slice, with the gyri of interest outlined in green.
For probabilistic tractography the results are shown in Fig. 13. Generally, the lateral part of the gyrus has a higher visitation than in deterministic tractography, combined with smaller variations in cortical visitation at different angular resolutions and LMAX. With lower angular resolution of a dataset fewer tracts reached the M1 gyrus, causing a less densely sampled visitation area (e.g., comparing the 50 and 100 directions datasets for the same LMAX), especially at high spatial resolutions. Across spatial resolutions, a similar pattern was observed as in the deterministic tractography (Fig. 12), where lower spatial resolutions yielded a more clustered and convex visitation area. For the left CST a lot more of the lateral part of the gyrus was visited than in deterministic tractography. Although this effect was not observed in all datasets and typically only included a few lateral voxels, this seemed to appear at low angular resolution and/or lower spatial resolution.
Fig. 13.
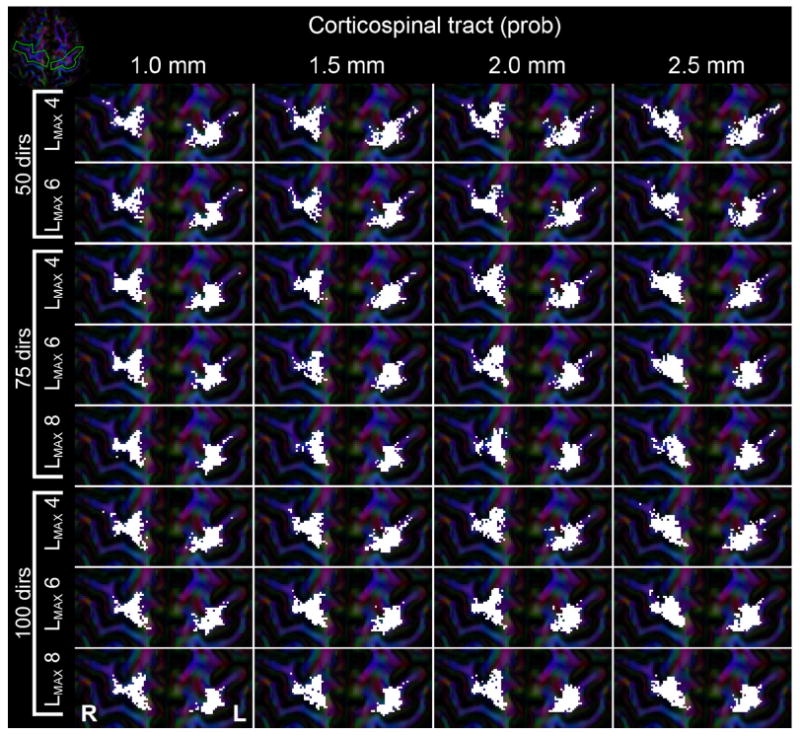
Visualization of where probabilistic tractography fiber bundle of the bilateral CST end up in the M1 cortices. Each subpanel represents results from the different reconstructed datasets, with columns being different spatial resolutions and each row a combination of number of gradient directions and used LMAX, as indicated in the figure. White areas indicate voxels that were intersected by fiber tracts. The green line on the 100_1.0 LMAX = 8 panel indicates the ROI that selects the cortices. The inset in the top-left corner shows an overview of the axial slice, with the gyri of interest outlined in green.
M1–M1 tracts
Volumetric overlap
For the M1–M1 tracts, Fig. 8, only the 50 directions at LMAX = 8 datasets seem to have significantly lower overlap compared with the 100_1.0 reference tracts. The highest overlap values (0.90 and 0.91) are found for the 100_1.5 at LMAX = 8 and 100_1.0 at LMAX = 6 datasets. A clear pattern of lower overlap is observed with a decrease in spatial resolution, for all number of directions and all LMAX values, with all datasets of 2.5 mm resolutions having an overlap <0.7, except for 100_2.5 at LMAX = 8. For datasets with 75 directions, the LMAX value used seems to have a relatively little effect, with overlap values w.r.t. the reference being around 0.75–0.85. However, there is some indication that use of lower LMAX on the datasets with 50 and 75 directions gives a greater overlap than using the highest possible LMAX value.
Anatomical correspondence
Visually, the fiber bundles in all these cases are very similar (Fig. 14). The most pronounced difference is whether a lateral branch is included, as also seen in Fig. 4. The effect of spatial resolution on overlap seems to arise mostly from a difference in cross-section along the entire tract length.
Cortical visitation
The tract visitation maps of where in the cortical areas the tracts end up is shown in Fig. 15. These results appear very consistent concerning angular resolutions for 75 and 100 gradient directions and all values of LMAX. These patterns of visitation also appear reproducible at spatial resolutions down to 2.0 mm. The tracts from the 50 directions lack the contiguity that the higher angular resolution datasets show, whereas all 2.5 mm datasets show less well-defined areas. It is also apparent that the M1–M1 tracts end more medially than the CST (Figs. 12 and 15).
Fig. 15.
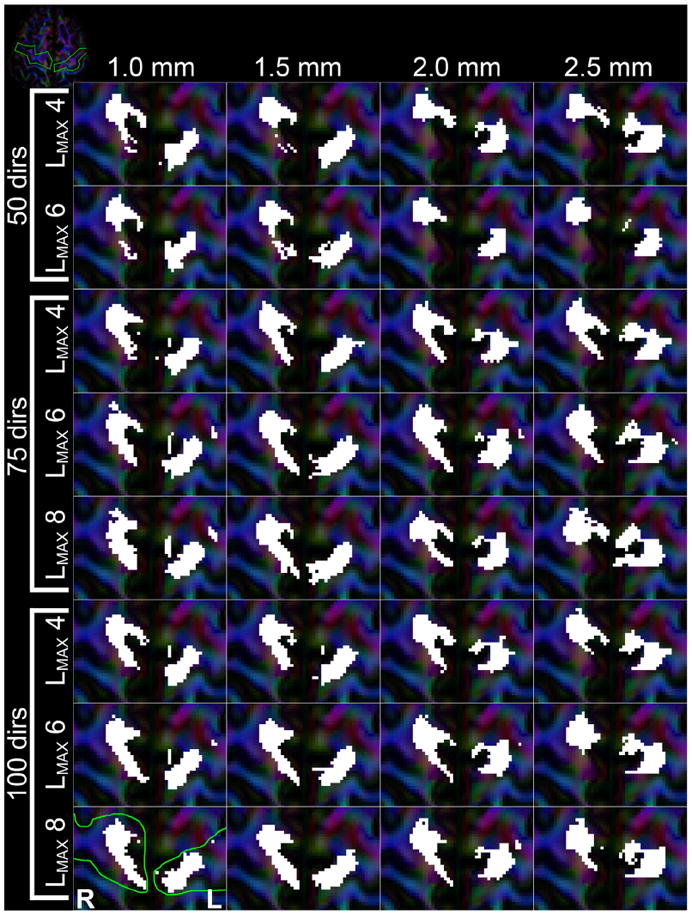
Visualization of where fiber tracts of the bilateral M1–M1 tracts intersect the cortical areas. Each subpanel represents results from the different reconstructed datasets, with columns being different spatial resolutions and each row a combination of number of gradient directions and used LMAX, as indicated in the figure. White areas indicate voxels that were intersected by fiber tracts. The green line on the 100_1.0 LMAX = 8 panel indicates the ROI that selects the cortices. The inset in the top-left corner shows an overview of the axial slice, with the gyri of interest outlined in green.
Discussion
The purpose of this work was to give an overview of how different degrees of angular and spatial resolutions impact fiber tractography results. We used the latest-generation 3D DWI pulse sequence to acquire diffusion MRI data at 1 mm isotropic resolution with a HARDI acquisition scheme comprising 100 gradient directions. Reconstructions of this high-resolution dataset were subsequently generated with a lower angular resolution, a lower spatial resolution, or both.
Methodological validation
Prior to comparing datasets with different angular and spatial resolutions, a statistical validation was performed. The volumetric overlap between fiber bundles from two nearly identical datasets is in the range of 0.84–0.95, depending on the structure of interest (Fig. 4). The excellent structural correspondence between these different reconstructions can be appreciated along the length of the bundle. The differences in volumetric overlap are mostly caused by individual fiber tract pathways deviating from the core bundle.
The different reconstructions analyzed in this work could be considered as some variants of test–retest or intra-subject repeatability, and our overlap values are in the same range as the previously reported reproducibility of tractography (e.g., Ciccarelli et al. 2003; Heiervang et al. 2006; Malykhin et al. 2008; Kristo et al. 2013a, 2013b). For multi-fiber tractography, Dice scores are known to be relatively low between scan–rescan tests, with a recent study by Kristo et al. (2013b) showing overlap values of around 0.6 in both the AF and CST. The methodological validation experiment (Fig. 4) resulted in much higher overlap values of 0.84 for the AF and 0.90 for the CST. This indicates that the minor difference between the two test–retest datasets used here can cause small perturbations in fODF estimation that cause mismatch in the reconstructed fiber bundles.
Comparisons of test–retest between deterministic and probabilistic tensor-based tractography show that the latter generally has a lower reproducibility for tract volume and overlap (e.g., Heiervang et al. 2006; Malykhin et al. 2008), which is also observed in this work for CSD-based tractography of the CST.
Analysis of reconstructed datasets
From Figs. 5-8 it is most obvious that the volumetric overlap between fiber bundle reconstructions shows large variations between bundles, with the CST and M1–M1 tracts are more reproducible across subsets than the AF. At the regions where these fibers cross, the CST is the dominant fiber population, and is the easiest to model accurately with low angular resolutions. The non-dominant fiber populations, the AF and the lateral projections of the corpus callosum, are known to be less accurate at lower angular resolutions (Vos et al. 2013b) and consequently produce erroneous tract reconstructions (Fig. 9).
Ultimately, objective metrics of cortical visitation and anatomical correspondence would aid in quantitative evaluation of these aspects, but no such metrics exist. The difficulty here, for instance for cortical visitation, is that these metrics should evaluate both the proportion of visited voxels as well as the location within the gyrus, as one would want the distinction between a large convex medial visitation area and a more irregularly-shaped and thin visitation area that covers the entire gyrus.
Arcuate fasciculus
Only the datasets with 75 and 100 directions using LMAX = 6 and 8 show the AF bundle as completely as it is in the reference dataset (Fig. 10); all other combinations of angular resolution seem inadequate in varying ways (Fig. 9). In the tracts that were reconstructed properly only minor differences could be observed, mostly in cortical projections off the temporal section, with the exception of the three lowest spatial resolutions at LMAX = 8 in the 75 direction datasets, possibly as a result of a complex interplay between partial voluming and SNR at these lower resolutions. The highest overlap values when varying spatial or angular resolution are around 0.75–0.77, for those closest in parameters to the reference. This is still lower than the overlap in the test–retest bundles, which was 0.84. This decrease is likely caused by the higher number of individual tracts branching off from the AF at the various spatial or angular resolutions.
Corticospinal tracts
Overlap values for the CST are generally higher than the AF but demonstrate similar patterns. With respect to the 100_1.0 LMAX = 8 dataset, highest overlap values are obtained in tract reconstructions from datasets with very similar parameters. Clear decreases in overlap can be observed at low spatial resolution, with the most systematic differences being how the inferior part of the CST is reconstructed. Superiorly, there are few systematic differences in how much of the M1 gyrus is intersected by the CST (Fig. 12). The largest areas were intersected when the highest usable LMAX was used per number of gradient directions. However, the 50_LMAX = 6 datasets showed equal penetration to the 100_LMAX = 8 datasets, which were both superior to the 75_LMAX = 8 datasets, showing no clear consistency with respect to number of DWIs. The maximum overlap values for deterministic tracking of 0.88 were for 100_1.0_LMAX = 6 and 100_1.5_LMAX = 8, and can be regarded as being in the same range as the overlap of 0.90 in the test–retest case. Similarly for the probabilistic CST, the highest overlap of 0.80 (left) and 0.74 (right) are at the same subsets, and strongly match the test–retest values of 0.81 and 0.75, respectively.
The overlap values show asymmetry between the left and right bundles, in both the deterministic and probabilistic reconstructions (Figs. 6 and 7), with higher overlap for the left fiber bundle, possibly caused by the left–right asymmetry observed in the cortical visitation (Figs. 12 and 13).
M1–M1 tracts
The variations between different spatial and angular resolutions seem to have the least effect on the M1–M1 tracts. Although overlap values do vary—mostly due to a change in the cross-section of the bundle—visual inspection shows very minor differences in tract morphometry and anatomy. Tract visitation in both M1 areas seems consistent for 75 and 100 directions at all but a spatial resolution of 2.5 mm. Overlap values of 0.90 and higher are present for some datasets, indicating very comparable values with the test–retest data with an overlap of 0.94.
Comparison between bundles
The overlap scores varied substantially between different fiber bundles. Overlap between subsets was generally lower in the AF (topping at 0.77) than in the CST (with a 0.88 maximum), with the M1–M1 tracts showing the highest overlap values (0.91). This pattern is also present in the test–retest experiments. The main reason for this is the complexity of the fiber structure investigated. The M1–M1 tracts are very strictly defined as going through the left and right M1 cortices, as shown in the Supplementary material. This allows for a very little variation along the path of the bundle. Similarly, the CST is defined by passing through one of the M1 gyri and the cerebellar peduncles, which is also a very strict delineation. This allows for a bit more variability in the inclusion of small side-branches, as highlighted by the arrows and arrowheads in Fig. 11. In both the CST and the M1–M1, the tract-selecting ROIs were at the far edges of the bundles. Contrastingly, for the AF the tract-selecting ROIs were rather medial to ensure that all relevant temporal, lateral, and frontal projections would be included (as shown in e.g., Catani et al. 2005; Catani and Thiebaut de Schotten 2008). This inherently allows for much variation in these projections—variations that are observed in Figs. 9 and 10 and results in Dice overlap values that are lower in the AF than in the CST and M1–M1.
Deterministic vs. probabilistic tractography of the CST
The corticospinal tracts were reconstructed with both deterministic and probabilistic CSD-based tractography. In terms of volumetric overlap the patterns were very similar, albeit with relatively lower absolute overlap values for the probabilistic than deterministic results (Figs. 7 and 6, respectively). The lower overlap in probabilistic than deterministic tractography is already present in the test–retest data (Table 1), likely caused by the inherently larger variability in the probabilistic method. In fact, the difference between test–retest Dice overlap and the variation as a result of different spatial or angular resolution seemed slightly lower for probabilistic than deterministic tractography. In terms of cortical visitation, the patterns vary between the two tractography types. Where deterministic tracking results in tracts that appear continuous, the probabilistic tracts show a more varied pattern that extends more laterally, spreading the tracts out thinly across more different areas of the gyrus at the expense of not always covering the full medial extent. One could regard this as an inherent characteristic of the probabilistic approach. At the highest angular resolution and LMAX = 8, the CSD model is assumed to describe the data as well as can be within these datasets, which would result in relatively sharp fODFs and thus low variability during the probabilistic tractography. At lower angular resolution or lower values of LMAX, the signal is noisier or less accurately described, respectively, resulting in a larger variability in the fODFs and thus a larger range of tract configurations. From the total number of seeded tracts in the brain stem there were twice as many tracts reaching the M1 gyrus in the 100 directions dataset compared with the 25 and 50 direction datasets, indicating increased variability in fODF estimation and the probabilistic tracking approach in these lower angular resolution datasets resulting in a much larger spread than in high angular resolution datasets.
Trade-off between spatial and angular resolutions
The simulations of crossing, brushing, and kissing fibers (Fig. 1) show that the type of complex fiber configurations influences the trade-off between angular and spatial resolutions, as a high angular resolution could properly resolve crossings but not kissing, and vice versa for a high spatial resolution. The unknown ratio of these configurations at each location in the brain indicates the in vivo investigations which will likely be non-trivial.
For deterministic tractography, fiber bundles were mostly comparable over different spatial resolutions—up to certain limits—whereas decreases in angular resolution seemed to degrade tractography results more quickly. These results indicate that the gain in knowing the fiber orientations in more detail is more beneficial than knowing fiber locations more accurately. This may infer that at lower spatial resolution the higher intra-voxel complexity over-rules the SNR boost achieved with larger voxels, resulting in a reduction of fODF accuracy. The cross-over of effects appears to occur at spatial resolutions of 2.5 mm, which do not seem to perform to the same high standard as the three higher spatial resolutions, neither in terms of volumetric overlap nor in anatomical correspondence.
For probabilistic tractography of the CST it would seem that the results are not as clearly in favor of angular resolution, with a more equal cortical visitation between the 75 and 100 direction datasets than in deterministic tracking before reducing the coverage in the 50 direction datasets. In line with the deterministic CST reconstructions, the effect of spatial resolution seems negligible on the cortical visitation. However an increase in voxel size to 2.5 mm isotropic seems to reduce visitation patterns more strongly than in the deterministic experiments.
The results favoring high spatial resolutions arise only in anatomical accuracy in the brainstem for the CST (Fig. 11). The ability to correctly distinguish tracts from the corticospinal tracts and the medial lemniscus degraded more with decreasing spatial than with angular resolution. When aiming to map the different cortical areas and their respective projection fibers, making this distinction is critical. However, at the highest angular resolution (100 directions and LMAX = 8), this could be achieved at spatial resolutions of 1.0, 1.5, and 2.0 mm.
Clearly, the balance between angular and spatial resolutions lies somewhere in the middle. Increasing the resolution from 2.5 mm—which is still common in many clinical studies—to 2.0 mm is beneficial for anatomically accurate tractography results, as is most clearly apparent in the CST. Spatial resolutions higher than 2.0 mm only seem to benefit multi-fiber tractography methods if this would not include a decrease in angular resolution.
These results complement the results from Calabrese et al. (2014), who investigated this trade-off between angular and spatial resolutions ex vivo. They used six time-matched acquisition protocols with varying spatial and angular resolutions—ranging from 0.13 mm3 and 12 directions to 0.6 mm3 and 257 directions—to investigate the trade-off for tractography in eight different fiber bundles in the ex vivo macaque brain. Their results show greatly varying results depending on the acquisition protocol, also finding an optimal balance at intermediate spatial and angular resolutions. Our setup and methodology differ from previous studies investigating the trade-off (Zhan et al. 2013; Calabrese et al. 2014), in that where those studies used six distinct time-matched acquisition protocols, we have opted for a single dataset to be reconstructed into more combinations of angular and spatial resolutions yielding a total of 16 different datasets. Further, for each of these datasets CSD modeling was performed with multiple values of LMAX where possible, whereas the works from Zhan et al. (2013) and Calabrese et al. (2014) used only one value of LMAX for ODF estimation or used a different diffusion modeling approach for each dataset. With datasets of different angular resolutions and SNR, as we use here, not making a decision about the model parameters a priori is an extra degree of freedom to understand the trade-off.
Limitations
Angular resolution
An important factor in the angular resolution of the diffusion-weighted signal is the b-value. The contrast between regions of high and low diffusivity increases with b-value, resulting in a higher effective angular resolution. For HARDI-based multi-fiber method, a b-value of 1000 s/mm2 is considered to be lower than optimal, but is commonly used for CSD-based tractography in more clinically-oriented studies (e.g., Metzler-Baddeley et al. 2011) as well as technical studies (e.g., Reisert et al. 2012; Jeurissen et al. 2013). In a comparative study on the performance of different multi-fiber methods at b-values in the order of b = 1000 s/mm2, CSD showed above average performance (Ramirez-Manzanares et al. 2011) making CSD the model of choice for our data. The high spatial resolution used in this work prevented the use of b-values in the range of 2000–3000 s/mm2, which would have decreased SNR. The use of additional signal averages to increase SNR was not regarded as an option because this would double the already extreme scan time.
Performance of multi-fiber methods will generally increase with the number of acquired DWIs (Wedeen and Dai 2011), with possibly limited gains at high numbers of DWIs (depending on the chosen method). Therefore, tractography is expected to be more accurate with increasing numbers of gradient directions for the datasets with different angular resolutions used here, irrespective of the b-value used. If higher b-values would have been used in this work, the effective angular resolution would have increased for all datasets, allowing for better characterization of crossing fibers. Alternatively, similar results may have been obtained using fewer diffusion directions at a higher b-value (Tournier et al. 2007; Vos et al. 2014). This is supported by preliminary analyses in a single dataset from the Human Connectome Project (HCP), as shown in the Supplementary material for the arcuate fasciculus reconstructed at different angular and spatial subsets using b-values of 1000, 2000, and 3000 s/mm2. Similar to the 3D DWI data, using LMAX of 4 seemed not to capture the full complexity of the bundle as well as LMAX of 6 and 8. At b = 3000 s/mm2, results at 75 and 90 directions yielded very comparable results, with a strong drop in AF reconstruction performance reducing angular resolution to 50 directions (Figs. S1-S3). With a b-value of 2000 s/mm2, there is a clear benefit of using LMAX = 8 over LMAX = 6, allowing the reconstruction the most frontal projections that are absent at LMAX = 6 (Fig. S4). At b = 1000 s/mm2, these most frontal projections are found with difficulty, mostly when the SNR is boosted by having a lower spatial resolution (Fig. S5). In all cases, having adequate angular resolution (either through b-value, number of directions, or used LMAX) is critical for reconstructing the AF. For a moderate b-value, 1000 s/mm2, many directions are required to do so (i.e., 90), whereas with higher b-values a reduction in number of directions is acceptable: for b = 2000, datasets with 75 and 90 directions performed very well using LMAX = 8, where the angular information captured in that data was represented as accurately as possible. At the highest b-value, this dependence on LMAX was reduced, possibly as a result of the increased angular contrast in the data (Tournier et al. 2013). A high spatial resolution aided in finding the cortical termination points in a more well-defined way, with some cortical projections lost at the lower spatial resolutions (some at 2.00 mm and more at 2.50 mm).
Spatial resolution
To create the lower resolution datasets, the acquired images were downsampled from the 1 mm isotropic dataset, which does not yield exactly the same images as when they would have been acquired at these resolutions. For instance, higher resolutions introduce larger geometric distortions, and the longer readout time prolongs the echo time and thus lowers SNR. The first aspect is largely addressed by using the RGPM for EPI distortions, and should have limited influence. The prolongation of TE is inherent in higher in-plane resolutions, since a larger part of k-space is sampled. With a partial Fourier factor of 0.7 and high parallel imaging factor used in this work, the effective TE is only slightly increased compared with standard clinical acquisition with 2.5 mm isotropic resolution.
The 1 mm datasets were downsampling using straightforward linear interpolation. Much effort has been put into finding optimal ways of interpolation for upsampling of images, to aid in the detection of fine image boundaries from low-resolution data, (e.g., Lehmann et al. 1999; Dyrby et al. 2014). The most recent diffusion MRI related work on this, by Dyrby et al. (2014), has shown that interpolation of the individual DWIs or through the tensor-model outperforms interpolation of quantitative maps, with higher-order interpolation methods performing better overall despite issues of ringing from overfitting. The interpolation steps used in this work, during tractrography, a model-based interpolation of the fODFs is in line with the well-performing methods from that work.
In this work, we have used a 3D multi-slab acquisition to acquire DWIs with a 1 mm isotropic resolution. To achieve true isotropic resolution, 3D acquisitions are preferred. Slice profiles for 2D imaging becomes worse for thinner slices, rendering an effective 1 mm thin slice difficult to acquire. The 3D multi-slab method does not suffer from these slice profile imperfections in the same way, yielding true isotropic resolution. Another benefit of the 3D acquisition is that it is more SNR efficient than conventional 2D imaging (Engstrom and Skare 2013). A downside is that the scan time is increased compared with 2D imaging, by the need to acquire different kz-encodes. To address this, Van et al. (2015) have proposed a SENSE-like reconstruction to reconstruct all 3D slabs simultaneously, providing an increase in speed of roughly 25–50%. It is important to note here that 3D multi-slab has a higher SNR per unit time, or SNR efficiency (Engstrom and Skare 2013), but the minimum scan time per volume is higher. Given that one needs at least 45 directions to use LMAX = 8 for CSD, the use of 3D multi-slab methods in clinical settings would require longer scan times than 2D single-shot EPI.
Another effect of varying spatial resolutions on tractography results is the varying extent of partial voluming of WM with non-WM signal, e.g., from gray matter or cerebrospinal fluid (CSF). For most single-shell diffusion methods it is a difficult challenge to correctly estimate ODFs in the presence of CSF, as e.g., shown by Parker et al. (2013), and our results may be affected by these differently for different spatial resolutions. Although multi-shell modeling approaches (e.g., Yeh et al. 2010; Jeurissen et al. 2014) can overcome these drawbacks, this was not included in our study as the extra shell in q-space would require another level of complexity in the trade-off, and the use of single-shell approaches still predominates in clinical settings.
Generalization
The conclusions in this work are based on deterministic tracto-graphy results of one association (AF), one projection (CST), and one commissural (M1–M1) fiber bundle combined with probabilistic tractography of the CST. Generalization to other structures is likely to be possible for other major fiber bundles such as the uncinate fasciculus and parts of the pyramidal tracts other than the CST, given that sizes and configurations are roughly similar. These results may not be as easily generalized for smaller fiber bundles or fiber bundles of significantly differing configurations, such as the subcortical U-fibers and the optic radiation. Although we believe that our results may have been different for these structures, we have not included them because either there is as yet no definitive consensus on their exact anatomy, or their results in fiber tractography vary significantly (e.g., Sherbondy et al. 2008; Nilsson et al. 2010). Therefore, any results we would show on these bundles would be specific to the methodology, highly debatable, and thus of limited use to the community.
This study has used a single local diffusion modeling approach, CSD to model fODFs, with both deterministic and probabilistic tractography. Generalization across other fODF or dODF estimation methods or tractography algorithms is expected to be non-trivial, as methods behave differently under conditions or varying number of directions, SNR, and b-value. As two examples, one could imagine another local modeling approach that may yield an overall better result than the one used in this study at very high angular resolutions but perform markedly worse at lower angular resolutions, or vice versa; or, similarly the more computationally expensive group of global tractography methods might outperform local tractography methods at low angular resolutions—benefitting greatly from the global approach—while yielding no benefits at high angular resolution.
Conclusion
While modeling techniques demand increases in angular resolution, the developments in diffusion acquisition often focus upon increasing spatial resolution. However, it is infeasible to increase both spatial and angular resolutions in clinically accepted scan times. As a result, the decision as to which of these two factors is most beneficial to invest scan time in becomes ever more relevant. In this work, we have given an overview of tractography results from datasets with varying spatial resolutions and different numbers of diffusion-weighting directions. High spatial and high angular resolutions are the ultimate combination. If a trade-off must be made between: i) increasing spatial resolution past current standards, or ii) investing scan time in higher angular resolutions, our results suggest that fiber tractography benefits the most from high angular resolutions.
Supplementary Material
Acknowledgments
This work was financially supported by the Care4Me (Cooperative Advanced REsearch for Medical Efficiency) pan-European research program ITEA (Information Technology for European Advancement), NIH (2R01 EB00271108, 5RO1 EB008706, 5R01 EB01165402), the Center of Advanced MR Technology at Stanford (P41 RR009784), the Lucas Foundation, and the Oak Foundation. The research of A.L. is supported by VIDI Grant 639.072.411 from The Netherlands Organization for Scientific Research (NWO). The authors would like to thank Dr. Heiko Schmiedeskamp for assistance in designing the RF pulses. Data were provided in part by the Human Connectome Project, WU-Minn Consortium (Principal Investigators: David Van Essen and Kamil Ugurbil; 1U54MH091657) funded by the 16 NIH Institutes and Centers that support the NIH Blueprint for Neuroscience Research; and by the McDonnell Center for Systems Neuroscience at Washington University.
Footnotes
Appendix A. Supplementary data
Supplementary data to this article can be found online at http://dx.doi.org/10.1016/j.neuroimage.2016.01.011
References
- Aarnink S, Vos S, Leemans A, Jernigan TL, Madsen KS, Baare WF. Automated longitudinal intra-subject analysis (ALISA) for diffusion MRI tractography. NeuroImage. 2014;86:404–416. doi: 10.1016/j.neuroimage.2013.10.026. [DOI] [PubMed] [Google Scholar]
- Basser PJ, Mattiello J, LeBihan D. MR diffusion tensor spectroscopy and imaging. Biophys J. 1994;66(1):259–267. doi: 10.1016/S0006-3495(94)80775-1. [DOI] [PMC free article] [PubMed] [Google Scholar]
- Basser PJ, Pajevic S, Pierpaoli C, Duda J, Aldroubi A. In vivo fiber tractography using DT-MRI data. Magn Reson Med. 2000;44(4):625–632. doi: 10.1002/1522-2594(200010)44:4<625::aid-mrm17>3.0.co;2-o. [DOI] [PubMed] [Google Scholar]
- Bauer MHA, Kuhnt D, Barbieri S, Klein J, Becker A, Freisleben B, Hahn HK, Nimsky C. Reconstruction of white matter tracts via repeated deterministic streamline tracking — initial experience. PLoS One. 2013;8(5):e63082 (05). doi: 10.1371/journal.pone.0063082. [DOI] [PMC free article] [PubMed] [Google Scholar]
- Behrens T, Johansen-Berg H, Jbabdi S, Rushworth M, Woolrich M. Probabilistic diffusion tractography with multiple fibre orientations: what can we gain? NeuroImage. 2007;34(1):144–155. doi: 10.1016/j.neuroimage.2006.09.018. [DOI] [PMC free article] [PubMed] [Google Scholar]
- Benson D, Sheremata W, Bouchard R, Segarra J, Price D, Geschwind N. Conduction aphasia: a clinicopathological study. Arch Neurol. 1973;28:339–346. doi: 10.1001/archneur.1973.00490230075011. [DOI] [PubMed] [Google Scholar]
- Besseling RMH, Jansen JFA, Overvliet GM, Vaessen MJ, Braakman HMH, Hofman PAM, Aldenkamp AP, Backes WH. Tract specific reproducibility of tractography based morphology and diffusion metrics. PLoS One. 2012;7(4):e34125 (04). doi: 10.1371/journal.pone.0034125. [DOI] [PMC free article] [PubMed] [Google Scholar]
- Calabrese E, Badea A, Coe CL, Lubach GR, Styner MA, Johnson GA. Investigating the tradeoffs between spatial resolution and diffusion sampling for brain mapping with diffusion tractography: time well spent? Hum. Brain Mapp. 2014;35(11):5667–5685. doi: 10.1002/hbm.22578. [DOI] [PMC free article] [PubMed] [Google Scholar]
- Calamante F, Tournier J-D, Jackson GD, Connelly A. Track-density imaging (TDI): super-resolution white matter imaging using whole-brain track-density mapping. NeuroImage. 2010;53(4):1233–1243. doi: 10.1016/j.neuroimage.2010.07.024. [DOI] [PubMed] [Google Scholar]
- Callaghan P, Eccles C, Xia Y. NMR microscopy of dynamic displacements: k-space and q-space imaging. J Phys E Sci Instrum. 1988;21:820–822. [Google Scholar]
- Cardoso M, Modat M, Vercauteren T, Ourselin S. Scale factor point spread function matching: beyond aliasing in image resampling. Proceedings of the MICCAI, 2015; Munchen, Germany. 2015. [Google Scholar]
- Catani M, Thiebaut de Schotten M. A diffusion tensor imaging tractography atlas for virtual in vivo dissections. Cortex. 2008 Sep;44(8):1105–1132. doi: 10.1016/j.cortex.2008.05.004. [DOI] [PubMed] [Google Scholar]
- Catani M, Jones DK, Ffytche DH. Perisylvian language networks of the human brain. Ann Neurol. 2005;57(1):8–16. doi: 10.1002/ana.20319. [DOI] [PubMed] [Google Scholar]
- Chang H, Fitzpatrick J. A technique for accurate magnetic resonance imaging in the presence of field inhomogeneities. IEEE Trans Med Imaging. 1992;11(3):319–329. doi: 10.1109/42.158935. [DOI] [PubMed] [Google Scholar]
- Ciccarelli O, Parker GJM, Toosy AT, Wheeler-Kingshott CAM, Barker GJ, Boulby PA, Miller DH, Thompson AJ. From diffusion tractography to quantitative white matter tract measures: a reproducibility study. NeuroImage. 2003;18(2):348–359. doi: 10.1016/s1053-8119(02)00042-3. [DOI] [PubMed] [Google Scholar]
- Dayan M, Kreutzer S, Clark CA. Tractography of the optic radiation: a repeatability and reproducibility study. NMR Biomed. 2015;28(4):423–431. doi: 10.1002/nbm.3266. [DOI] [PubMed] [Google Scholar]
- Dejerine J. Anatomie de centres nerveux. Rueff et Cie 1895 [Google Scholar]
- Descoteaux M, Angelino E, Fitzgibbons S, Deriche R. Regularized, fast, and robust analytical Q-ball imaging. Magn Reson Med. 2007;58(3):497–510. doi: 10.1002/mrm.21277. [DOI] [PubMed] [Google Scholar]
- Descoteaux M, Deriche R, Knosche TR, Anwander A. Deterministic and probabilistic tractography based on complex fibre orientation distributions. IEEE Trans Med Imaging. 2009;28(2):269–286. doi: 10.1109/TMI.2008.2004424. [DOI] [PubMed] [Google Scholar]
- Dice L. Measures of the amount of ecologic association between species. Ecology. 1945;26:297–302. [Google Scholar]
- Dubois J, Poupon C, Lethimonnier F, Le Bihan D. Optimized diffusion gradient orientation schemes for corrupted clinical DTI data sets. MAGMA. 2006;19(3):134–143. doi: 10.1007/s10334-006-0036-0. [DOI] [PubMed] [Google Scholar]
- Dyrby TB, Lundell H, Burke MW, Reislev NL, Paulson OB, Ptito M, Siebner HR. Interpolation of diffusion weighted imaging datasets. NeuroImage. 2014;103(0):202–213. doi: 10.1016/j.neuroimage.2014.09.005. [DOI] [PubMed] [Google Scholar]
- Engstrom M, Skare S. Diffusion-weighted 3D multislab echo planar imaging for high signal-to-noise ratio efficiency and isotropic image resolution. Magn Reson Med. 2013 doi: 10.1002/mrm.24594. in press. [DOI] [PubMed] [Google Scholar]
- Fillard P, Descoteaux M, Goh A, Gouttard S, Jeurissen B, Malcolm J, Ramirez-Manzanares A, Reisert M, Sakaie K, Tensaouti F, Yo T, Mangin JF, Poupon C. Quantitative evaluation of 10 tractography algorithms on a realistic diffusion MR phantom. NeuroImage. 2011;56(1):220–234. doi: 10.1016/j.neuroimage.2011.01.032. [DOI] [PubMed] [Google Scholar]
- Frank LR. Characterization of anisotropy in high angular resolution diffusion-weighted MRI. Magn Reson Med. 2002;47(6):1083–1099. doi: 10.1002/mrm.10156. [DOI] [PubMed] [Google Scholar]
- Froeling M, Tax C, Vos SB, Luijten P, Leemans A. MASSIVE: multiple acquisitions for standardization of structural imaging for validation and evaluation. Proceedings of the 22th Annual Meeting of International Society for Magnetic Resonance in Medicine; Milan, Italy. 2014. p. 2582. [DOI] [PubMed] [Google Scholar]
- Heiervang E, Behrens T, Mackay C, Robson M, Johansen-Berg H. Between session reproducibility and between subject variability of diffusion MR and tractography measures. NeuroImage. 2006;33(3):867–877. doi: 10.1016/j.neuroimage.2006.07.037. [DOI] [PubMed] [Google Scholar]
- Holdsworth SJ, Van A, Skare S, Bammer R. Comparison between EPI and RS-EPI at high acceleration factors. Proceedings of the 20th Annual Meeting of International Society for Magnetic Resonance in Medicine; Melbourne, Australia. 2012. p. 4212. [Google Scholar]
- Jeurissen B, Leemans A, Jones DK, Tournier J-D, Sijbers J. Probabilistic fiber tracking using the residual bootstrap with constrained spherical deconvolution. Hum Brain Mapp. 2011;32:461–479. doi: 10.1002/hbm.21032. [DOI] [PMC free article] [PubMed] [Google Scholar]
- Jeurissen B, Leemans A, Tournier J-D, Jones DK, Sijbers J. Investigating the prevalence of complex fiber configurations in white matter tissue with diffusion MRI Hum. Brain Mapp. 2013;34:2747–2766. doi: 10.1002/hbm.22099. [DOI] [PMC free article] [PubMed] [Google Scholar]
- Jeurissen B, Tournier J-D, Dhollander T, Connelly A, Sijbers J. Multi-tissue constrained spherical deconvolution for improved analysis of multi-shell diffusion MRI data. NeuroImage. 2014 Dec;103(0):411–426. doi: 10.1016/j.neuroimage.2014.07.061. [DOI] [PubMed] [Google Scholar]
- Jones D. Tractography gone wild: probabilistic fibre tracking using the wild bootstrap with diffusion tensor MRI. IEEE Trans Med Imaging. 2008;27(9):1268–1274. doi: 10.1109/TMI.2008.922191. [DOI] [PubMed] [Google Scholar]
- Jones DK, Horsfield M, Simmons A. Optimal strategies for measuring diffusion in anisotropic systems by magnetic resonance imaging. Magn Reson Med. 1999;42(3):515–525. [PubMed] [Google Scholar]
- Kim M, Ronen I, Ugurbil K, Kim DS. Spatial resolution dependence of DTI tractography in human occipito-callosal region. NeuroImage. 2006;32(3):1243–1249. doi: 10.1016/j.neuroimage.2006.06.006. [DOI] [PubMed] [Google Scholar]
- Klein S, Staring M, Murphy K, Viergever MA, Pluim J. elastix: a toolbox for intensity-based medical image registration. IEEE Trans. Med Imaging. 2010;29:196–205. doi: 10.1109/TMI.2009.2035616. [DOI] [PubMed] [Google Scholar]
- Kristo G, Leemans A, Gelder B, Raemaekers M, Rutten GJ, Ramsey N. Reliability of the corticospinal tract and arcuate fasciculus reconstructed with DTI-based tractography: implications for clinical practice. Eur Radiol. 2013a;23(1):28–36. doi: 10.1007/s00330-012-2589-9. [DOI] [PubMed] [Google Scholar]
- Kristo G, Leemans A, Raemaekers M, Rutten G-J, de Gelder B, Ramsey NF. Reliability of two clinically relevant fiber pathways reconstructed with constrained spherical deconvolution. Magn Reson Med. 2013b doi: 10.1002/mrm.24602. in press. [DOI] [PubMed] [Google Scholar]
- Leemans A, Jones DK. The B-matrix must be rotated when correcting for subject motion in DTI data. Magn Reson Med. 2009;61(6):1336–1349. doi: 10.1002/mrm.21890. [DOI] [PubMed] [Google Scholar]
- Leemans A, Jeurissen B, Sijbers J, Jones DK. ExploreDTI: a graphical toolbox for processing, analyzing, and visualizing diffusion MR data. Proceedings of the 17th Annual Meeting of International Society for Magnetic Resonance in Medicine; Hawaii, USA. 2009. p. 3536. [Google Scholar]
- Leemans A, Sijbers J, Verhoye M, van der Linden A, van Dyck D. Mathematical framework for simulating diffusion tensor MR neural fiber bundles. Magn Reson Med. 2005;53(4):944–953. doi: 10.1002/mrm.20418. [DOI] [PubMed] [Google Scholar]
- Lehmann T, Gonner C, Spitzer K. Survey: interpolation methods in medical image processing. IEEE Trans. Med Imaging. 1999;18(11):1049–1075. doi: 10.1109/42.816070. [DOI] [PubMed] [Google Scholar]
- Maclaren J, Han Z, Vos SB, Fischbein N, Bammer R. Reliability of brain volume measurements: a test–retest dataset. Sci Data. 2014 Oct-1 doi: 10.1038/sdata.2014.37. [DOI] [PMC free article] [PubMed] [Google Scholar]
- Malykhin N, Concha L, Seres P, Beaulieu C, Coupland NJ. Diffusion tensor imaging tractography and reliability analysis for limbic and paralimbic white matter tracts. Psychiatry Res Neuroimaging. 2008;164(2):132–142. doi: 10.1016/j.pscychresns.2007.11.007. [DOI] [PubMed] [Google Scholar]
- McNab JA, Miller KL. Sensitivity of diffusion weighted steady state free precession to anisotropic diffusion. Magn Reson Med. 2008;60(2):405–413. doi: 10.1002/mrm.21668. [DOI] [PubMed] [Google Scholar]
- McNab JA, Jbabdi S, Deoni SC, Douaud G, Behrens TE, Miller KL. High resolution diffusion-weighted imaging in fixed human brain using diffusion-weighted steady state free precession. NeuroImage. 2009;46(3):775–785. doi: 10.1016/j.neuroimage.2009.01.008. [DOI] [PubMed] [Google Scholar]
- Metzler-Baddeley C, Jones DK, Belaroussi B, Aggleton JP, O’Sullivan MJ. Frontotemporal connections in episodic memory and aging: a diffusion MRI tractography study. J Neurosci. 2011;31(37):13236–13245. doi: 10.1523/JNEUROSCI.2317-11.2011. [DOI] [PMC free article] [PubMed] [Google Scholar]
- Mori S, Crain BJ, Chacko VP, Zijl PCMV. Three-dimensional tracking of axonal projections in the brain by magnetic resonance imaging. Ann Neurol. 1999;45(2):265–269. doi: 10.1002/1531-8249(199902)45:2<265::aid-ana21>3.0.co;2-3. [DOI] [PubMed] [Google Scholar]
- Neeman M, Freyer J, Sillerud L. A simple method for obtaining cross-term-free images for diffusion anisotropy studies in NMR microimaging. Magn Reson Med. 1991;21:138–143. doi: 10.1002/mrm.1910210117. [DOI] [PubMed] [Google Scholar]
- Nilsson D, Rydenhag B, Malmgren K, Starck G, Ljungberg M. Anatomical accuracy and feasibility of probabilistic and determinstic tractography of the optic radiation. Epilepsia; 9th European Congress on Epileptology: Rhodes; 2010. p. 91. [Google Scholar]
- O’Halloran RL, Aksoy M, Van AT, Bammer R. 3D isotropic high-resolution diffusion-weighted MRI of the whole brain with a motion-corrected steady-state free precession sequence. Magn Reson Med. 2013;70:466–478. doi: 10.1002/mrm.24489. [DOI] [PubMed] [Google Scholar]
- O’Sullivan S, Schmitz T, editors. Physical Rehabilitation. F.A Davis Company; Philadelphia: 2007. [Google Scholar]
- Oishi K, Faria A, Van Zijl P, Mori S, editors. MRI Atlas of Human White Matter. second. Academic Press; 2011. [Google Scholar]
- Parker G, Marshall D, Rosin P, Drage N, Richmond S, Jones D. A pitfall in the reconstruction of fibre ODFs using spherical deconvolution of diffusion MRI data. NeuroImage. 2013;65(0):433–448. doi: 10.1016/j.neuroimage.2012.10.022. [DOI] [PMC free article] [PubMed] [Google Scholar]
- Purves D, Augustine G, Fitzpatrick D, Katz L, LaMantia A-S, McNamara J, W SM, editors. Neuroscience. second. Sinauer Associates; Sunderland, MA: 2001. [Google Scholar]
- Ramirez-Manzanares A, Cook PA, Hall M, Ashtari M, Gee JC. Resolving axon fiber crossings at clinical b-values: an evaluation study. Med Phys. 2011;38(9):5239–5253. doi: 10.1118/1.3626571. [DOI] [PubMed] [Google Scholar]
- Reijmer YD, Leemans A, Heringa SM, Wielaard I, Jeurissen B, Koek H, Biessels GJ. Improved sensitivity to cerebral white matter abnormalities in Alzheimer’s disease with spherical deconvolution based tractography. PLoS One. 2012;7:e44074. doi: 10.1371/journal.pone.0044074. [DOI] [PMC free article] [PubMed] [Google Scholar]
- Reisert M, Kellner E, Kiselev V. About the geometry of asymmetric fiber orientation distributions. IEEE Trans Med Imaging. 2012;31(6):1240–1249. doi: 10.1109/TMI.2012.2187916. [DOI] [PubMed] [Google Scholar]
- Rohde GK, Barnett AS, Basser PJ, Marenco S, Pierpaoli C. Comprehensive approach for correction of motion and distortion in diffusion-weighted MRI. Magn Reson Med. 2004;51(1):103–114. doi: 10.1002/mrm.10677. [DOI] [PubMed] [Google Scholar]
- Sherbondy AJ, Dougherty RF, Ben-Shachar M, Napel S, Wandell BA. Contrack: finding the most likely pathways between brain regions using diffusion tractography. J Vis. 2008 Jul;8(9):15.1–1516. doi: 10.1167/8.9.15. [DOI] [PMC free article] [PubMed] [Google Scholar]
- Sijbers J, den Dekker A. Maximum likelihood estimation of signal amplitude and noise variance from MR data. Magn Reson Med. 2004;51(3):586–594. doi: 10.1002/mrm.10728. [DOI] [PubMed] [Google Scholar]
- Skare S, Bammer R. Jacobian weighting of distortion corrected EPI data. Proceedings of the 18th Annual Meeting of International Society for Magnetic Resonance in Medicine; Stockholm, Sweden. 2010. p. 5063. [Google Scholar]
- Skare S, Hedehus M, Moseley ME, Li TQ. Condition number as a measure of noise performance of diffusion tensor data acquisition schemes with MRI. J Magn Reson. 2000;147(2):340–352. doi: 10.1006/jmre.2000.2209. [DOI] [PubMed] [Google Scholar]
- Tax CM, Jeurissen B, Vos SB, Viergever MA, Leemans A. Recursive calibration of the fiber response function for spherical deconvolution of diffusion MRI data. NeuroImage. 2014;86:67–80. doi: 10.1016/j.neuroimage.2013.07.067. [DOI] [PubMed] [Google Scholar]
- Tournier J-D, Calamante F, Connelly A. Robust determination of the fibre orientation distribution in diffusion MRI: non-negativity constrained super-resolved spherical deconvolution. NeuroImage. 2007;35(4):1459–1472. doi: 10.1016/j.neuroimage.2007.02.016. [DOI] [PubMed] [Google Scholar]
- Tournier J-D, Calamante F, Connelly A. MRtrix: diffusion tractography in crossing fiber regions. Int J Imaging Syst Technol. 2012;22(1):53–66. [Google Scholar]
- Tournier J-D, Calamante F, Connelly A. Determination of the appropriate b value and number of gradient directions for high-angular-resolution diffusion-weighted imaging. NMR Biomed. 2013;26:1775–1786. doi: 10.1002/nbm.3017. [DOI] [PubMed] [Google Scholar]
- Tournier J-D, Calamante F, Gadian DG, Connelly A. Direct estimation of the fiber orientation density function from diffusion-weighted MRI data using spherical deconvolution. NeuroImage. 2004;23(3):1176–1185. doi: 10.1016/j.neuroimage.2004.07.037. [DOI] [PubMed] [Google Scholar]
- Tournier J-D, Mori S, Leemans A. Diffusion tensor imaging and beyond. Magn Reson Med. 2011;65(6):1532–1556. doi: 10.1002/mrm.22924. [DOI] [PMC free article] [PubMed] [Google Scholar]
- Tuch DS. Q-ball imaging. Magn Reson Med. 2004;52(6):1358–1372. doi: 10.1002/mrm.20279. [DOI] [PubMed] [Google Scholar]
- Van AT, Aksoy M, Holdsworth SJ, Kopeinigg D, Vos SB, Bammer R. Slab profile encoding (PEN) for minimizing slab boundary artifact in three-dimensional diffusion-weighted multislab acquisition. Magn Reson Med. 2015;73:605–613. doi: 10.1002/mrm.25169. [DOI] [PMC free article] [PubMed] [Google Scholar]
- Veraart J, Sijbers J, Sunaert S, Leemans A, Jeurissen B. Weighted linear least squares estimation of diffusion MRI parameters: strengths, limitations, and pitfalls. NeuroImage. 2013;81:335–346. doi: 10.1016/j.neuroimage.2013.05.028. [DOI] [PubMed] [Google Scholar]
- Vos SB, Aksoy M, M J, Han Z, Holdsworth S, Brost A, Seeger C, Leemans A, Bammer R. High-spatial and high-angular resolution diffusion imaging with a fragmented acquisition scheme. Proceedings of the 21th Annual Meeting of International Society for Magnetic Resonance in Medicine; Salt Lake City, United States. 2013a. p. 3195. [Google Scholar]
- Vos SB, Tax C, Froeling M, Leemans A. In vivo investigations of accuracy and precision of fiber orientations in crossing fibers in spherical deconvolution-based HARDI methods. Proceedings of the 22th Annual Meeting of International Society for Magnetic Resonance in Medicine; Milan, Italy. 2014. p. 976. [Google Scholar]
- Vos SB, Viergever MA, Leemans A. Multi-fiber tractography visualizations for diffusion MRI data. PLoS One. 2013b;8(11):e81453. doi: 10.1371/journal.pone.0081453. [DOI] [PMC free article] [PubMed] [Google Scholar]
- Wakana S, Caprihan A, Panzenboeck MM, Fallon JH, Perry M, Gollub RL, Hua K, Zhang J, Jiang H, Dubey P, Blitz A, van Zijl PC, Mori S. Reproducibility of quantitative tractography methods applied to cerebral white matter. NeuroImage. 2007;36(3):630–644. doi: 10.1016/j.neuroimage.2007.02.049. [DOI] [PMC free article] [PubMed] [Google Scholar]
- Wedeen V, Dai G. Diffusion-limited diffusion MRI and a universal optimum b-value. Proceedings of the 19th Annual Meeting of International Society for Magnetic Resonance in Medicine; Montreal, Canada. 2011. p. 1965. [Google Scholar]
- Wedeen VJ, Rosene DL, Wang R, Dai G, Mortazavi F, Hagmann P, Kaas JH, Tseng WYI. The geometric structure of the brain fiber pathways. Science. 2012;335(6076):1628–1634. doi: 10.1126/science.1215280. [DOI] [PMC free article] [PubMed] [Google Scholar]
- Winston G, Daga P, White M, Micallef C, Miserocchi A, Mancini L, Modat M, Stretton J, Sidhu M, Symms M, Lythgoe D, Thornton J, Yousry T, Ourselin S, Duncan J, McEvoy AW. Preventing visual field deficits from neurosurgery. Neurology. 2014;83:604–611. doi: 10.1212/WNL.0000000000000685. [DOI] [PMC free article] [PubMed] [Google Scholar]
- Yeh C-H, Tournier J-D, Cho K-H, Lin C-P, Calamante F, Connelly A. The effect of finite diffusion gradient pulse duration on fibre orientation estimation in diffusion MRI. NeuroImage. 2010;51(2):743–751. doi: 10.1016/j.neuroimage.2010.02.041. [DOI] [PubMed] [Google Scholar]
- Zhan L, Franc D, Patel V, Jahanshad N, Jin Y, Mueller B, Bernstein MA, Borowski BJ, Jack CR, Toga AW, Lim K, Thompson PM. How do spatial and angular resolution affect brain connectivity maps from diffusion MRI. SIBI. 2012 doi: 10.1109/ISBI.2012.6235469. [DOI] [PMC free article] [PubMed] [Google Scholar]
- Zhan L, Jahanshad N, Ennis DB, Jin Y, Bernstein MA, Borowski BJ, Jack CR, Toga AW, Leow AD, Thompson PM. Angular versus spatial resolution trade-offs for diffusion imaging under time constraints. Hum Brain Mapp. 2013;34(10):2688–2706. doi: 10.1002/hbm.22094. [DOI] [PMC free article] [PubMed] [Google Scholar]
Associated Data
This section collects any data citations, data availability statements, or supplementary materials included in this article.


