

Abstract
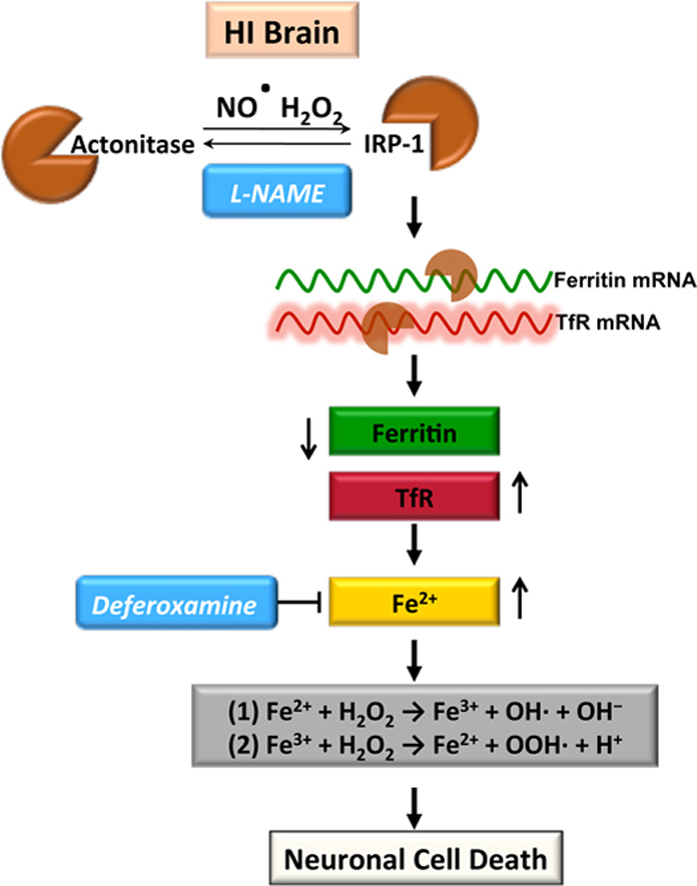
We have recently shown that increased hydrogen peroxide (H2O2) generation is involved in hypoxia–ischemia (HI)-mediated neonatal brain injury. H2O2 can react with free iron to form the hydroxyl radical, through Fenton Chemistry. Thus, the objective of this study was to determine if there was a role for the hydroxyl radical in neonatal HI brain injury and to elucidate the underlying mechanisms. Our data demonstrate that HI increases the deposition of free iron and hydroxyl radical formation, in both P7 hippocampal slice cultures exposed to oxygen–glucose deprivation (OGD), and the neonatal rat exposed to HI. Both these processes were found to be nitric oxide (NO) dependent. Further analysis demonstrated that the NO-dependent increase in iron deposition was mediated through increased transferrin receptor expression and a decrease in ferritin expression. This was correlated with a reduction in aconitase activity. Both NO inhibition and iron scavenging, using deferoxamine administration, reduced hydroxyl radical levels and neuronal cell death. In conclusion, our results suggest that increased NO generation leads to neuronal cell death during neonatal HI, at least in part, by altering iron homeostasis and hydroxyl radical generation.
Keywords: Hypoxia–ischemia, Neuronal cell death, Iron, Hydroxyl radical, Nitric oxide, Neonatal brain
Graphical abstract
Highlights
-
•
HI increases the deposition of free iron and hydroxyl radical formation in the neonatal brain.
-
•
Both these processes are NO dependent.
-
•
Increased iron deposition is mediated via increased TfR and decreased ferritin expression.
-
•
These processes are involved in the neuronal cell death associated with neonatal HI.
Introduction
Neonatal hypoxia–ischemia (HI) remains an important cause of acute mortality and chronic morbidity in infants and children. The neurologic consequences of injury include mental retardation, epilepsy, cerebral palsy, and blindness [1]. Despite progress in obstetric and neonatal care, the current clinical treatments for neonatal HI brain injury are mainly supportive. The mechanisms underlying the brain injury associated with HI is only partly understood. Although increasing evidence indicates that free radicals and reactive oxygen species are important mediators of ischemic neuronal death [2], [3], [4], little is known regarding their specific cellular sources and how they are regulated. Our previous studies have shown that there is increased superoxide and hydrogen peroxide (H2O2) production in the HI-exposed neonatal brain [5], [6] and this is mediated at least in part via NADPH oxidase brain [5]. The neonatal brain also has a low with antioxidant capacity, including limited GPx activity [7], [8] and increasing GPx activity is neuroprotective [5]. The iron-catalyzed formation of hydroxyl radical from H2O2 is also recognized as a potent oxidant that can cause cell damage. However, its role in neonatal HI brain injury is unresolved. The neonatal brain accumulates more ferrous and ferric iron than older animals [9], [10], [11]. Iron uptake in the neonatal rat brain is also high, reaching a peak during the first 2 weeks [12] and provides a reservoir for brain cellular development. Thus, it also makes the neonatal brain more vulnerable to oxidative stress, as iron can catalyze the Fenton reaction in which H2O2 is converted into highly reactive and toxic hydroxyl radicals causing cell death [13].
The free radical, nitric oxide (NO) is well recognized as a physiological mediator in the brain and plays important roles in long-term potentiation (LTP), synaptic plasticity and activity-dependent modification of neural networks [14], [15], [16]. NO is enzymatically generated from the conversion of l-arginine and oxygen by various forms of NOS, all three NOS isoforms (eNOS, nNOS and iNOS) are potential sources of NO in the brain. However, the mechanisms by which elevated levels of NO leads to neuronal cell death in the HI brain are still unclear. Interestingly, there are data suggesting that NO can modulate cellular iron metabolism through its ability to inactivate cellular aconitase [17], [18] and activate the iron regulatory protein-1 [19] altering the homeostasis that exists between iron uptake and cellular storage to favor uptake.
The aim of the present study was to investigate the potential role of increased hydroxyl radical generation in HI-mediated neonatal brain injury and to elucidate the involvement of NO. Using both an in vitro hippocampal slice culture model and an in vivo model of neonatal HI we demonstrated that an NO-dependent increase in hydroxyl radical generation plays an important role in the neuronal cell death associated with neonatal HI and this is mediated via a disruption in iron homeostasis.
Materials and methods
Hippocampal slice culture and OGD exposure
Neonatal rats (Sprague–Dawley, Charles River, Wilmington, MA, USA) at postnatal day 7 (P7) were decapitated and the hippocampi dissected under sterile conditions. Each hippocampus was sliced into 400 µm slices using a Mcilwain tissue chopper (Science Products GmbH, Switzerland). Slices were then cultured on permeable membrane Millicell inserts (Millipore, Billerica, MA, USA) (0.4 µm pore size) in six well plates for 6 days at 37 °C in 5% CO2 as previously described [5], [6]. Twenty-four hours before exposure to OGD the culture medium was changed to neurobasal-A and B27 supplement without antioxidants. Just prior to OGD, a sucrose balanced salt solution (SBSS) (120 mM NaCl, 5 mM KCl, 1.25 mM NaH2PO4, 2 mM MgSO4, 2 mM CaCl2, 25 mM NaHCO3, 20 mM HEPES, 25 mM sucrose, pH of 7.3) was infused for 1 h with 5% CO2 and 10 l/h nitrogen gas. The inserts were then transferred into deoxygenated SBSS and placed in a ProOxC system chamber with oxygen controller (BioSpherix, NY, USA) and exposed to 0.1% O2, 5% CO2, 94.4% nitrogen for 90 min at 37 °C. The slices were then returned to oxygenated serum-free neurobasal medium with B27 supplement. The NOS inhibitor, l-NAME [Nω-Nitro-L-arginine methyl ester hydrochloride] (100 µM, Sigma-Aldrich, St. Louis, USA) were dissolved in DMSO and added to the medium 2 h before OGD. Control experiments contained the equivalent amount of DMSO that did not exceed 0.2% (v/v). The iron chelator, Deferoxamine (100 µM, Sigma-Aldrich, St. Louis, USA) were dissolved in autoclaved distilled water and added to the medium 2 h before OGD. The hippocampal slice cultures were harvested at 4 h after OGD for further investigation. All protocols were approved by the Institutional Animal Care Committee at Georgia Regents University.
Quantification of slice culture cell death
This was carried out using propidium iodide staining, the live slice culture fluorescence images were recorded at on OGD, and 4 h after OGD groups. The evaluation of cell death was performed using a modification of the method of Cronberg et al. [20], as previously described [5], [6].
Aconitase activity
Aconitase activity was measured using the Aconitase Assay Kit (Cayman Chemical, Ann Arbor, MI) [21]. Briefly, hippocampal slice cultures, or isolated rat brain tissue, were washed with ice-cold PBS and lysed in lysis buffer containing 1% Triton X-100, 20 mM Tris, pH 7.4, 100 mM NaCl, with 1× protease inhibitor cocktail, and 1× phosphatase inhibitor cocktail (Sigma, St. Louis, MO, USA). Samples were sonicated on crushed ice with two 10 s bursts and centrifuged at 13,000g for 5 min at 4 °C. Supernatants were treated according to the manufacturer's instructions and the protein content was measured. Samples were diluted 1:10 in the kinase buffer provided with the kit, and the absorbance read at 450 nm, using a microplate reader (Synergy HT, Biotek Instruments, VT, USA). Data are present as percentage to the control.
LDH cytotoxicity assay
Cytotoxicity was evaluated by quantification of lactate dehydrogenase (LDH) using a Cytotoxicity Detection Kit (Roche Applied Science, Mannheim, Germany) in the slice culture medium as described [5], [6]. All LDH measurements were divided by the protein levels of the samples (Bradford protein assay, Bio-Rad Laboratories, CA, USA).
Histologic evaluations
Brain tissues were washed in PBS, fixed in 4% paraformaldehyde (RT, 1 h), then in 30% sucrose (RT, 1 h), embedded in O.C.T embedding medium (Tissue-Tek, Sakura Finetechnical, Tokyo, Japan) and stored at −80 °C overnight. Embedded tissues were frozen sectioned (15 µm), mounted on glass slides. Sections were analyzed for the presence of apoptotic nuclei using the DeadEnd Fluorometric TUNEL System (Promega, Madison, WI, USA) as described [5], [6]. Quantification of the TUNEL stained nuclei and total nuclei was processed by Image-Pro software and presented as a percentage of total nuclei in the field as described [5], [6]. Tissue iron deposition was detected in cryostat sections using the Prussian Blue Iron Stain Kit (Sigma-Aldrich, St. Louis, USA) as previously described [22], [23]. Briefly, sections were incubated in distilled water with 1% potassium ferrocyanide and 1% hydrochloric acid (HCl) for 15 min. After rinsing with distilled water, sections were counterstained with neutral red. Images were then captured using an Olympus IX70 microscope (Olympus, Japan). The iron intensity (blue) was then quantified using ImageJ (NIH).
Immunoblot analyses
Tissue was homogenized in lysis buffer containing 1% Triton X-100, 20 mM Tris, pH 7.4, 100 mM NaCl, with 1× protease inhibitor cocktail, and 1× phosphatase inhibitor cocktail (Sigma, St. Louis, MO, USA). Lysates were centrifuged at 13,000g for 10 min at 4 °C to precipitate the debris, and the protein content in the supernatant determined using the Bio-Rad protein assay (Bio-Rad Laboratories, CA, USA). Lysate protein (20 µg/lane) was separated using 4–20% gradient gels (Bio-Red, Hercules, CA, USA) and transferred to PVDF membranes with the Trans-Blot® Turbo™ Transfer System(Bio-Red, Hercules, CA, USA). The blots were then probed with the appropriate antibody overnight at 4 °C. Primary antibodies used were anti-IRP-1 (Abcam Inc., Cambridge, MA, USA); anti-Ferritin (Abcam Inc., Cambridge, MA, USA); anti-TfR (Abcam Inc., Cambridge, MA, USA). Blots were washed in 1× TBST (3×15 min) and the appropriate secondary antibodies conjugated to HRP (Sigma, St. Louis, MO, USA) were then added for 1 h at RT (Thermo Scientific, Rockford, IL, USA). After further washing in TBST (3×15 min) bands were visualized by chemiluminescence (West-Femto, Pierce, Rockford, IL, USA) and quantified using a Kodak Molecular Imaging System (Kodak, Rochester, NY, USA).
Measurement of hydroxyl radical levels
Hydroxyl radical production was measured using electron paramagnetic resonance (EPR) spectroscopy [24] (Miniscope MS 200, Megnet tech, Berlin, Germany). Fresh tissue homogenates protein levels were measured. Sample solutions for analysis contained 35 µl homogenate and 5 µl of spin trap, 5,5-dimethey-1-pyrroline-N-oxide (DMPO, Cayman Chemical Company, Ann Arbor, MI). Under room temperature, the spectra were obtained using, 2 mW of microwave power, 100 kHz of modulation frequence, 2.0 G of modulation amplitude a 3 min scan time. To quantify the amount of the waveform amplitudes generated in slice cultures of brain hippocampi were converted into nanomoles of hydroxyl radical per milligram/minute of protein utilizing this value.
Rat model of neonatal hypoxia–ischemia
Postnatal day 7 rat pups were anesthetized with isoflurane (4% for induction; 3% for maintenance), and 20% oxygen at 1 l/min flow rate. For the duration of induction and surgery, a heated induction chamber and surgical bed, (Microflex EZ Anesthesia System, Euthanex, Palmer, PA, USA), maintained core body temperature between 35–36 °C. Rectal temperature was monitored continuously using a sensitive microprobe thermometer (Physitemp Instruments, Clifton, NJ, USA). The right common carotid artery was exposed, permanently occluded by electrical coagulation and incision sutured as described [5], [6]. Sham operated pups received vessel manipulation without occlusion. Immediately after surgery, pups were placed in a temperature controlled recovery chamber to recover for 15 min before returning to the dam for 1–2 h. For induction of HI, pups were placed in a custom made, Plexiglas, multi-chambered hypoxia device (Jarrold Manufacturing, St. Louis, MO, USA). Chamber water bath temperature was maintained at 37 °C and each chamber infused with a calibrated mixture of warm, humidified 8% oxygen/balance nitrogen for 2.5 h at a flow rate of 100 ml/min. Oxygen concentration was monitored (Mini-Ox3000 oxygen analyzer, MSA Medical Products, Pittsburgh, PA, USA) and core body temperature of pups maintained between 35 and 36 °C throughout duration of hypoxia. Sham pups were also placed in chamber with exposure to room air only. Immediately after hypoxia, pups were placed in a temperature regulated recovery chamber (36 °C), and allowed 1–2 h of recovery before returning to dam. The NOS Inhibitor, l-NAME (30 mg/kg, Sigma-Aldrich, St. Louis, USA) was injected i.p. 30 min prior to exposure to hypoxia. The iron iron chelator, Deferoxamine (200 mg/kg, Sigma-Aldrich, St. Louis, USA) was injected i.p. immediately after exposure to hypoxia. Vehicle groups received an equivalent injection volume of saline. After 8 h recovery from HI, the rats were terminated and their brain was removed, tissue homogenate was prepared for western blot and aconitase activity analysis. Fresh tissue homogenates also went through electron spin resonance spectroscopy to measure the hydroxyl radical levels. Using a rodent neonatal matrix (Zivic Instruments, Pittsburgh, PA, USA), the 2 mm thick coronal sections of the brain were processed with TTC staining and infract volume quantification carried out as previously described [5], [6].
Statistical analysis
Statistical calculations were performed using the GraphPad Prism V. 4.01 software. The mean±SD or SE were calculated for all samples, and significance was determined by either the Student's t-test or ANOVA with the Newman–Keuls or Bonferroni post hoc test. A value of P<0.05 was considered significant.
Results
OGD-mediated increases in nitric oxide is associated with neuronal cell death in rat hippocampal slice cultures
Hippocampal slices from P7 rats were pretreated with the NOS inhibitor, l-NAME (100 µM, 2 h), then exposed to OGD. Our data indicate that NOx levels are increased after OGD and that the NOS-inhibitor, l-NAME significantly inhibit this increase (Fig. 1A). To examine the effect of NOS inhibition on OGD associated cell death, we quantified PI uptake in whole hippocampal slice. Our data demonstrate that OGD increases PI uptake (Fig. 1B) and this was significantly attenuated by NOS inhibition (Fig. 1B). Similarly, NOS inhibition significantly decreased lactate dehydrogenase (LDH) release (a measure of necrotic cell death) into the culture medium (Fig. 1C). TUNEL staining also showed that inhibiting NOS, significantly reduced OGD induced neuronal cell apoptosis (Fig. 1E and F).
Fig. 1.

Oxygen glucose deprivation increases NOx levels and NO inhibition reduces cell death in rat hippocampal slice cultures. Rat hippocampal slice cultures were exposed to OGD in the presence of the NOS inhibitor, l-NAME (100 µM, 2 h prior to OGD). NOx levels were determined in the culture medium 2- and 4-h after OGD (A). The effect on cell injury was also quantified by measuring changes in PI uptake fluorescence in the CA1, CA3, DG regions and the whole slice 4 h after OGD (B and C) and by measuring changes in LDH release (D). Both PI uptake and LDH release are increased by OGD and this is prevented by l-NAME (B–D). Slices were also subjected to TUNEL analysis. Representative images are shown demonstrating the TUNEL staining of apoptotic cells (green) co-localized with PI staining of all the nuclei (red) resulted in more yellow (merged) nuclei than in l-NAME pretreated slices (E). The magnification used was10×. Quantification of the percentage of apoptotic nuclei to total nuclei was also carried out indicating that l-NAME decreased the level of apoptotic nuclei in response to OGD (F). Data are presented as mean±S.E from 4 independent experiments using 24 pooled slices per experiment. *P<0.05 vs. control, †P<0.05 vs. previous group, ‡P<0.05 vs. same time point without l-NAME.
OGD induced hydroxyl radical generation and iron deposition are attenuated by NOS inhibition in rat hippocampal slice cultures
To determine if OGD increases hydroxyl radical generation in the hippocampal slice cultures, we utilized EPR spectroscopy and spin trapping. OGD induces a significant increase in hydroxyl radical generation (Fig. 2A). The increased generation of the hydroxyl radical correlated an increase in iron deposition (Fig. 2B and C). The increases in both hydroxyl radical generation (Fig. 2A) and iron deposition (Fig. 2B and C) were significantly attenuated when the slices were pretreated with the NOS inhibitor, l-NAME.
Fig. 2.

NO inhibition attenuates hydroxyl radical generation and reduces iron deposition in rat hippocampal slice cultures exposed to oxygen glucose deprivation. Four hours after OGD, hydroxyl radical levels were determined using electron paramagnetic resonance (EPR) and the spin-trap compound, 5,5-dimethey-1-pyrroline-N-oxide (DMPO). There is a significant increase in hydroxyl radical generation that is attenuated by l-NAME (A). Slices were harvested and the amount of iron deposition determined (blue color). Representative images are shown (B). The intensity of blue color was increased by OGD, indicating increased iron deposition and this was attenuated by l-NAME (B and C). Values are presented as mean±S.E from 4 independent experiments using 24 pooled slices per experiment. *P<0.05 vs. No OGD, †P<0.05 vs. OGD no treatment.
OGD alters the expression of proteins involved in cellular iron homeostasis in rat hippocampal slice cultures
When the iron–sulfur cluster of mitochondrial aconitase is disrupted, the unfolded protein becomes, IRP1, a major cellular iron-responsive element (IRE)-binding protein [25], [26], [27], [28], [29]. Binding to the IRE present in the transferrin receptor (TfR) mRNA attenuates its degradation, while binding to the ferritin mRNA IRE enhances its translation [25], [26], [27], [28], [29]. Our data indicate that OGD inhibits aconitase activity in hippocampal slice cultures (Fig. 3A) without altering aconitase/IRP-1 protein levels (Fig. 3B). The decrease in aconitase activity corresponded with increased protein levels of TfR (Fig. 3C) and decreased ferritin protein levels (Fig. 3D). NOS inhibition prevented the decrease in aconitase activity (Fig. 3A) and the changes in TfR (Fig. 3C) and ferritin (Fig. 3D) protein.
Fig. 3.

NOS inhibition preserves iron homeostasis in rat hippocampal slice cultures exposed to oxygen glucose deprivation. Rat hippocampal slice cultures were exposed to OGD in the presence of the NOS inhibitor, l-NAME (100 µM, 2 h prior to OGD), then harvested at 4 h after OGD. The effect of the OGD on aconitase activity was determined (A). The OGD-mediated decreases in aconitase activity is attenuated by l-NAME (A). Cell extracts were also subjected to Western blot analysis to determine the effect on iron regulatory protein-1 (IRP-1, B), ferritin (C) and transferrin receptor (TfR, D) levels. IRP-1 protein levelsa re unchanged (B). However, OGD decreases ferritin protein levels (C) and increases TfR levels (D). These changes are attenuated by l-NAME (C and D). Values are presented as mean±S.E from 4 independent experiments using 24 pooled slices per experiment. *P<0.05 vs. no OGD, †P<0.05 vs. OGD no treatment.
Iron regulation is disrupted in the neonatal rat brain exposed to HI
Aconitase activity is decreased in the HI brain ad this is prevented when NOS is inhibited with l-NAME (Fig. 4). Again, IRP-1 protein levels did not change significantly with HI (Fig. 5A). However, Ferritin levels were decreased (Fig. 5B) and TfR levels were increased (Fig. 5C) in a NOS dependent manner (Fig. 5B). The HI brain also exhibited an NOs-dependent increase in iron deposition (Fig. 5D).
Fig. 4.

l-NAME preserves aconitase activity in the neonatal rat brain exposed to hypoxia–ischemia. P7 neonatal rats were pre-treated with l-NAME (30 mg/kg, 30 min) then exposed to HI. Eight hours post-HI the brains were removed and the aconitase activity in the right hemisphere determined. HI decreases aconitase activity and this is attenuated by l-NAME. Values are presented as mean±S.D. from 5–6 animals per group. *P<0.05 vs. sham, †P<0.05 vs. HI+vehicle.
Fig. 5.

l-NAME preserves iron homeostasis in the neonatal rat brain exposed to hypoxia–ischemia. P7 neonatal rats were pre-treated with l-NAME (30 mg/kg, 30 min) then exposed to HI. Eight hours post-HI the brains were removed and the right hemisphere was subjected to Western blot analysis to evaluate changes in IRP-1 (A), ferritin (B), and TfR (C) levels. IRP-1 protein levels are unaffected by HI (A). However, HI decreases ferritin protein levels (B) and increases TfR levels (C). These changes are attenuated by l-NAME (B and C). In addition the iron deposition was determined. Representative images are shown (D). The intensity of blue color was increased by HI, indicating increased iron deposition and this was attenuated by l-NAME (D). Values are presented as mean±S.D. from 5–6 animals per group. *P<0.05 vs. sham, †P<0.05 vs. HI+vehicle.
The ferric iron chelator, deferoxamine reduces iron deposition and hydroxyl radical generation in rat hippocampal slice cultures
We next used a ferric iron chelator, deferoxamine to reduce cellular iron toxicity. Deferoxamine reduced both the iron staining (Fig. 6A) and elevated hydroxyl radical generation (Fig. 6B) after OGD. This sequestration of iron correlated with a reduction in PI uptake (Fig. 7A) and LDH release (Fig. 7B).
Fig. 6.

Deferoxamine reduces cell death in hippocampal slice culture exposed to oxygen glucose deprivation. Rat hippocampal slice cultures were exposed to OGD in the presence of the iron chelator, deferoxamine (100 µM, 2 h prior to OGD). The effect on cell injury was also quantified by measuring changes in PI uptake fluorescence in the whole slice 4 h after OGD (A) and by measuring changes in LDH release (B). Both PI uptake and LDH release are increased by OGD and this is prevented by deferoxamine (A and B). Data are presented as mean±S.E from 4 independent experiments using 24 pooled slices per experiment. *P<0.05 vs. no OGD, †P<0.05 vs. OGD no treatment.
Fig. 7.

Deferoxamine reduces iron deposition and hydroxyl radical generation in hippocampal slice culture exposed to oxygen glucose deprivation. Rat hippocampal slice cultures were exposed to OGD in the presence of the iron chelator, deferoxamine (100 µM, 2 h prior to OGD). Deferoxamine pretreatment reduces the OGD-mediated increase in iron deposition 4 h after OGD (A). The generation of hydroxyl radical was also measured 4 h after OGD. The OGD-mediated increase in hydroxyl radical generation is attenuated by deferoxamine (B). Values are presented as mean±S.E from 4 independent experiments using 24 pooled slices per experiment. *P<0.05 vs. No OGD †P<0.05 vs. OGD no treatment.
Deferoxamine reduces hydroxyl radical generation and infract volume in the neonatal brain exposed to HI
Deferoxamine (200 mg/kg, I.P.) administrated immediately after HI significantly reduced iron deposition (Fig. 8A) and hydroxyl radical generation (Fig. 8B). This correlated with a reduction in the infract volume of the right hemisphere of the neonatal rat brain exposed to (Fig. 8C).
Fig. 8.

Deferoxamine reduces iron deposition, hydroxyl radical generation and infarct volume in the neonatal rat brain exposed to hypoxia-ischemia. P7 neonatal rats were given deferoxamine (200 mg/kg I.P.) immediately after HI. After HI 8 h the rat brains were removed, iron deposition (A), hydroxyl radical generation (B), and infarct volume (C) were all determined in the right hemisphere. The HI mediated increase in iron deposition (A) and hydroxyl radical generation (B) are prevented by deferoxamine. This correlates with a reduction in infarct volume (C). *P<0.05 vs. sham, †P<0.05 vs. HI+vehicle.
Discussion
Perinatal HI represents a long-standing, refractory public health problem [30], [31], [32], [33]. Initially, HI results in a rapid early phase of cellular energy failure then a secondary phase of injury that evolves over hours to days and is accompanied by a clinical syndrome manifest as encephalopathy, seizures and an abnormal EEG. The initial phase of HI is characterized by excitotoxic cell injury. In this study we have identified a new mechanism that is involved in the neuronal cell death associated with neonatal HI. Our data from OGD slice cultures, and the neonatal rat brain exposed to HI, show that NOx levels are elevated and that NOS inhibition prevents the loss of aconitase activity, which results in the reduction of iron deposition and hydroxyl radical generation. The neuronal cell death in the HI brain was also dramatically decreased; suggesting this iron mediated hydroxyl radical neuronal cell injury is NO dependent. Many studies show that NO is a mediator of neuronal injury after HI [34], [35], [36], [37] and NOS inhibition reduces infarct volume after HI injury in the rat [38], [39]. However, the source of the NO also appears to determine if NO acts in a protective or deleterious manner. Thus, the increase in eNOS activity that occurs immediately after ischemic cerebral damage [40], is a protective as it can improve blood supply [41], [42]. Conversely, the activation of the nNOS isoform when glutamate binds to the NMDA receptor is thought to be deleterious [43], [44]. Thus, HI injury is reduced in adult [45], [46] and neonatal mice [36] deficient in nNOS but increased in eNOS deficient mice [47]. Further, nNOS expression in the developing brain correlates with regions of selective vulnerability to HI injury [48], again supporting a role for nNOS derived NO in HI injury in the developing brain.
Despite many years of continued investigation it is still not clear the mechanisms by which NO is involved in the brain injury associated with HI. Some data have suggested that nNOS-derived NO activates the p38MAPK pathway which leads to neuronal death [49]. This is supported by our previous studies that implicate the activation of p38MAPK in HI brain injury [5], [6]. The activation of p38MAPK appears to be an initiator event that in turn results in an increase in oxidative stress through its ability to phosphorylate and activate the p47phox subunit of NADPH oxidase resulting in increased superoxide generation [5], [6]. This suggests that there may be links between NO and reactive oxygen species generation. ROS are continuously produced in mammalian cells during normal aerobic metabolism, and an overabundance can threaten neuronal survival through their ability to induce lipid peroxidation, protein oxidation, and DNA damage [50], [51], [52], [53], [54]. ROS are processed by a highly complex and integrated antioxidant defense system composed of the enzymes CuZnSOD, MnSOD, catalase, GPx, and glutathione reductase, as well as nonenzymatic substances such as vitamins A, C, and E and low molecular weight molecules including reduced GSH [55]. The detoxification of ROS is especially important for the brain because neurons have been shown to be particularly vulnerable to oxidative stress as a result of their limited ROS scavenging ability [55]. Indeed our prior studies have shown that peak antioxidant defense protein levels, especially GPx, do not occur until later developmental ages [56]. However, the potential for antioxidant enzymes to exert neuroprotection is complex and far from resolved. For example, adult copper zinc superoxide dismutase (SOD1) over-expressing mice or rats have reduced injury in a model of focal cerebral ischemic injury compared with wild-type mice [57], [58], [59]. However, neonatal SOD1 over-expressing mice have increased brain injury [60]. This appears to be due to that neonatal SOD1 transgenic mice accumulating excessive levels of H2O2 after HI [60]. As this was correlated with a decreases in the activity of GPx after the injury it has been suggested that GPx may be the important anti-oxidant enzyme in protection against the brain injury associated with neonatal HI [60]. We have also shown that H2O2 levels are significantly increased by OGD in hippocampal slice cultures and by HI in the neonatal rat brain [5]. Further, scavenging H2O2 using the adenoassociated viral (AAV) gene delivery of GPx1 significantly attenuates the neuronal injury associated with HI [5]. This is important as the generation of the hydroxyl radical is dependent on the reaction of free iron with H2O2 via Fenton type chemistry. It also suggests that NO may act at different levels in the pathway: activating p38MAPK to stimulate NADPH oxidase activity and superoxide generation and by stimulating free iron levels to increase hydroxyl radical levels.
Iron is required for optimal neuronal growth and function during development. Iron forms an important component of enzymes and proteins involved in neurotransmitter synthesis, neuronal oxidative metabolism, myelin formation, and DNA synthesis [61], [62], [63]. The ability of the element to exist in either of two stable oxidation states (ferric, Fe3+; ferrous, Fe2+) is the key to its enzymatic activity. Unrestrained, however, iron can have adverse consequences on cellular survival through the production of the hydroxyl radical generated by its interaction with H2O2 [55], [64], [65], [66]. The first 16 postnatal days in the rat are characterized by a high rate of cell proliferation and iron requirements parallel this rapid rate of development [67], [68]. Prior work has also shown that, in the neonatal HI rat brain, iron staining increases rapidly in regions of ischemic injury, suggesting that HI induces a rapid accumulation of iron in the brain [69]. Magnetic resonance imaging of children with severe ischemic anoxic brain injury has identified extensive areas of iron deposition in the basal ganglia and periventricular white matter [70]. Our data show that sequestering cellular iron using deferoxamine attenuates hydroxyl radical generation and attenuates neuronal cell death suggesting that the hydroxyl radical is a major player in HI brain injury. Deferoxamine not only sequesters “free iron” to form an extremely stable complex, it also has the ability to remove iron from ferritin and to complex non-transferrin bound iron [71]. Thus, it mimics the effect of altering the iron regulatory and trafficking proteins and is a direct way to reduce the iron pool inside the cell. That deferoxamine can reduce neonatal HI brain injury has been previously reported [72], [73]. Thus, our data are in agreement with these previous studies, but go further by implicating iron mediated hydroxyl radical generation as being a key downstream mediator of the neuronal cell death.
Generally, iron is loaded by transferrin which binds to TfR on the cell membrane, after which it is passed across the membrane by endocytosis [74]. The ferric iron (Fe3+) is then released from transferrin and reduced to ferrous iron (Fe2+) for further use or/and storage in ferritin. A major mechanism for the regulation of iron homeostasis relies on divergent but coordinated control of TfR-mediated iron uptake and ferritin-mediated iron sequestration. The expression of TfR and ferritin is controlled by a process involving mRNA–protein interactions. Both TfR and ferritin mRNA’s contain structural motifs known as “iron response elements” (IREs), which can be bound by iron regulatory protein 1 (IRP1) [25], [26], [27], [28], [29]. When iron levels are low, the IRP1 binds to IREs in untranslated regions of mRNAs for TfR and ferritin, blocking degradation of the former while decreasing translation of the latter [25], [26], [27], [28], [29]. These processes result in a simultaneous increase in iron uptake and a decrease in iron sequestration, forming a pool of iron that is available for metabolic utilization. When iron levels are high, IRP-1 assembles a [4Fe–4S] cluster and acquires aconitase activity, while also losing its function as a post-transcriptional regulator [75], [76]. However, IRP-1 can also be regulated by factors other than iron levels in the cells. For example, studies have shown that IRP-1 is highly sensitive to NO generated by NOS or by exogenous NO donors [77], [78], [79], [80], [81]. The prevailing paradigm is that NO directly attacks the Fe–S cluster of aconitase, inducing its disassembly and switching the enzyme to IRP-1 [77], [78], [80]. Our data support this possibility as we find that after HI, there is a decrease in aconitase activity and a corresponding increase in cellular iron uptake, mediated via increased levels of TfR protein and reduced sequestration via a reduction in ferritin protein. In addition, our work is in agreement with recent studies in which aerobic exercise was found to elevate free iron levels in the hippocampus [82] while 2,3,7,8-dibenzo-p-dioxin (TCDD) alters iron homeostasis in urinary bladder epithelial RT4 cells [83]. In both cases the mechanism was found to involve NO and IRPs. It should be noted that another IRP exists, IRP-2. IRP-2 does not assemble an Fe–S cluster but responds to iron repletion by undergoing degradation through the ubiquitin-proteasome pathway [26], [27], [28], [29]. We did not evaluate the potential role of IRP-2 in HI brain injury and it is unclear to what extent it is involved.
In summary, elevated NO generation in the HI brain, inhibits aconitase activity and leads to cellular iron accumulation, increases in hydroxyl radical generation and neuronal cell death. Thus, our findings have clarified the mechanism by which NO exerts its cytotoxic effect in the neonatal brain exposed to HI, and suggests that regulating iron homeostasis is a potential clinical strategy for protecting the neonatal brain.
Acknowledgments
This research was supported in part by HL60190 (SMB), HL67841 (SMB), HL101902 (SMB), HD039110 (SMB) from the National Institutes of Health and a Scientist Development Grant (14SDG20480354) from the American Heart Association National Office (RR).
References
- 1.Ferriero D.M. Neonatal brain injury. N. Engl. J. Med. 2004;351(19):1985–1995. doi: 10.1056/NEJMra041996. 15525724 [DOI] [PubMed] [Google Scholar]
- 2.Lipton P. Ischemic cell death in brain neurons. Physiol. Rev. 1999;79(4):1431–1568. doi: 10.1152/physrev.1999.79.4.1431. 10508238 [DOI] [PubMed] [Google Scholar]
- 3.Martin L.J., Brambrink A.M., Price A.C., Kaiser A., Agnew D.M., Ichord R.N. Neuronal death in newborn striatum after hypoxia–ischemia is necrosis and evolves with oxidative stress. Neurobiol. Dis. 2000;7(3):169–191. doi: 10.1006/nbdi.2000.0282. 10860783 [DOI] [PubMed] [Google Scholar]
- 4.Clarkson A.N., Sutherland B.A., Appleton I. The biology and pathology of hypoxia–ischemia: an update. Arch. Immunol. Ther. Exp. (Warsz.) 2005;53(3):213–225. 15995582 [PubMed] [Google Scholar]
- 5.Lu Q., Wainwright M.S., Harris V.A., Aggarwal S., Hou Y., Rau T. Increased NADPH oxidase-derived superoxide is involved in the neuronal cell death induced by hypoxia–ischemia in neonatal hippocampal slice cultures. Free Radic. Biol. Med. 2012;53(5):1139–1151. doi: 10.1016/j.freeradbiomed.2012.06.012. 22728269 [DOI] [PMC free article] [PubMed] [Google Scholar]
- 6.Lu Q., Rau T.F., Harris V., Johnson M., Poulsen D.J., Black S.M. Increased p38 mitogen-activated protein kinase signaling is involved in the oxidative stress associated with oxygen and glucose deprivation in neonatal hippocampal slice cultures. Eur. J. Neurosci. 2011;34(7):1093–1101. doi: 10.1111/j.1460-9568.2011.07786.x. 21939459 [DOI] [PMC free article] [PubMed] [Google Scholar]
- 7.Sheldon R.A., Jiang X., Francisco C., Christen S., Vexler Z.S., Täuber M.G. Manipulation of antioxidant pathways in neonatal murine brain. Pediatr. Res. 2004;56(4):656–662. doi: 10.1203/01.PDR.0000139413.27864.50. 15295091 [DOI] [PubMed] [Google Scholar]
- 8.Jiang X., Mu D., Manabat C., Koshy A.A., Christen S., Täuber M.G. Differential vulnerability of immature murine neurons to oxygen–glucose deprivation. Exp. Neurol. 2004;190(1):224–232. doi: 10.1016/j.expneurol.2004.07.010. 15473995 [DOI] [PubMed] [Google Scholar]
- 9.Moos T. Developmental profile of non-heme iron distribution in the rat brain during ontogenesis. Brain Res. Dev. Brain Res. 1995;87(2):203–213. doi: 10.1016/0165-3806(95)00077-q. 7586503 [DOI] [PubMed] [Google Scholar]
- 10.Moos T., Rosengren Nielsen T. Ferroportin in the postnatal rat brain: implications for axonal transport and neuronal export of iron. Semin. Pediatr. Neurol. 2006;13(3):149–157. doi: 10.1016/j.spen.2006.08.003. 17101453 [DOI] [PubMed] [Google Scholar]
- 11.Moos T., Oates P.S., Morgan E.H. Expression of the neuronal transferrin receptor is age dependent and susceptible to iron deficiency. J. Comp. Neurol. 1998;398(3):420–430. 9714152 [PubMed] [Google Scholar]
- 12.Morgan E.H., Moos T. Mechanism and developmental changes in iron transport across the blood–brain barrier. Dev. Neurosci. 2002;24(2–3):106–113. doi: 10.1159/000065699. 12401948 [DOI] [PubMed] [Google Scholar]
- 13.Lipinski B. Hydroxyl radical and its scavengers in health and disease. Oxid. Med. Cell Longev. 2011;2011:809696. doi: 10.1155/2011/809696. 21904647 [DOI] [PMC free article] [PubMed] [Google Scholar]
- 14.Edelman G.M., Gally J.A. Nitric oxide: linking space and time in the brain. Proc. Natl. Acad. Sci. USA. 1992;89(24):11651–11652. doi: 10.1073/pnas.89.24.11651. 1334544 [DOI] [PMC free article] [PubMed] [Google Scholar]
- 15.Mongin A.A., Dohare P., Jourd’heuil D. Selective vulnerability of synaptic signaling and metabolism to nitrosative stress. Antioxid. Redox Signal. 2012;17(7):992–1012. doi: 10.1089/ars.2012.4559. 22339371 [DOI] [PMC free article] [PubMed] [Google Scholar]
- 16.Dachtler J., Hardingham N.R., Fox K. The role of nitric oxide synthase in cortical plasticity is sex specific. J. Neurosci. 2012;32(43):14994–14999. doi: 10.1523/JNEUROSCI.3189-12.2012. 23100421 [DOI] [PMC free article] [PubMed] [Google Scholar]
- 17.Tórtora V., Quijano C., Freeman B., Radi R., Castro L. Mitochondrial aconitase reaction with nitric oxide, S-nitrosoglutathione, and peroxynitrite: mechanisms and relative contributions to aconitase inactivation. Free Radic. Biol. Med. 2007;42(7):1075–1088. doi: 10.1016/j.freeradbiomed.2007.01.007. 17349934 [DOI] [PubMed] [Google Scholar]
- 18.Castro L.A., Robalinho R.L., Cayota A., Meneghini R., Radi R. Nitric oxide and peroxynitrite-dependent aconitase inactivation and iron-regulatory protein-1 activation in mammalian fibroblasts. Arch. Biochem. Biophys. 1998;359(2):215–224. doi: 10.1006/abbi.1998.0898. 9808763 [DOI] [PubMed] [Google Scholar]
- 19.Cairo G., Ronchi R., Recalcati S., Campanella A., Minotti G. Nitric oxide and peroxynitrite activate the iron regulatory protein-1 of J774A.1 macrophages by direct disassembly of the Fe−S cluster of cytoplasmic aconitase. Biol. Chem. 2002;41(23):7435–7442. doi: 10.1021/bi025756k. 12044177 [DOI] [PubMed] [Google Scholar]
- 20.Cronberg T., Rytter A., Asztély F., Söder A., Wieloch T. Glucose but not lactate in combination with acidosis aggravates ischemic neuronal death in vitro. Stroke. 2004;35(3):753–757. doi: 10.1161/01.STR.0000117576.09512.32. 14963271 [DOI] [PubMed] [Google Scholar]
- 21.Gardner P.R., Raineri I., Epstein L.B., White C.W. Superoxide radical and iron modulate aconitase activity in mammalian cells. J. Biol. Chem. 1995;270(22):13399–13405. doi: 10.1074/jbc.270.22.13399. 7768942 [DOI] [PubMed] [Google Scholar]
- 22.Lee D.H., Zhou L.J., Zhou Z., Xie J.X., Jung J.U., Liu Y., Xi C.X., Mei L., Xiong W.C. Neogenin inhibits HJV secretion and regulates BMP-induced hepcidin expression and iron homeostasis. Blood. 2010;115(15):3136–3145. doi: 10.1182/blood-2009-11-251199. 20065295 [DOI] [PMC free article] [PubMed] [Google Scholar]
- 23.Casanova M.F., Comparini S.O., Kim R.W., Kleinman J.E. Staining intensity of brain iron in patients with schizophrenia: a postmortem study. J. Neuropsychiatry Clin. Neurosci. 1992;4(1):36–41. doi: 10.1176/jnp.4.1.36. 1627959 [DOI] [PubMed] [Google Scholar]
- 24.Pieper G.M., Felix C.C., Kalyanaraman B., Turk M., Roza A.M. Detection by ESR of DMPO hydroxyl adduct formation from islets of langerhans. Free Radic. Biol. Med. 1995;19(2):219–225. doi: 10.1016/0891-5849(95)00018-s. 7649493 [DOI] [PubMed] [Google Scholar]
- 25.Hentze M.W., Kühn L.C. Molecular control of vertebrate iron metabolism: mRNA-based regulatory circuits operated by iron, nitric oxide, and oxidative stress. Proc. Natl. Acad. Sci. USA. 1996;93(16):8175–8182. doi: 10.1073/pnas.93.16.8175. 8710843 [DOI] [PMC free article] [PubMed] [Google Scholar]
- 26.Henderson B.R. Iron regulatory proteins 1 and 2. Bioessays. 1996;18(9):739–746. doi: 10.1002/bies.950180909. 8831290 [DOI] [PubMed] [Google Scholar]
- 27.Mascotti D.P., Rup D., Thach R.E. Regulation of iron metabolism: translational effects mediated by iron, heme, and cytokines. Annu. Rev. Nutr. 1995;15:239–261. doi: 10.1146/annurev.nu.15.070195.001323. 8527220 [DOI] [PubMed] [Google Scholar]
- 28.Kühn L.C. Molecular regulation of iron proteins. Baillieres Clin. Haematol. 1994;7(4):763–785. doi: 10.1016/s0950-3536(05)80123-4. 7881153 [DOI] [PubMed] [Google Scholar]
- 29.Piñero D.J., Hu J., Connor J.R. Alterations in the interaction between iron regulatory proteins and their iron responsive element in normal and Alzheimer's diseased brains. Cell. Mol. Biol. Noisy le Grand. 2000;46(4):761–776. 10875438 [PubMed] [Google Scholar]
- 30.du Plessis A.J., Johnston M.V. Hypoxic–ischemic brain injury in the newborn. cellular mechanisms and potential strategies for neuroprotection. Clin. Perinatol. 1997;24(3):627–654. 9394864 [PubMed] [Google Scholar]
- 31.Fenichel G.M. Hypoxic–ischemic encephalopathy in the newborn. Arch. Neurol. 1983;40(5):261–266. doi: 10.1001/archneur.1983.04050050029002. 6405725 [DOI] [PubMed] [Google Scholar]
- 32.Vannucci R.C., Perlman J.M. Interventions for perinatal hypoxic-ischemic encephalopathy. Pediatrics. 1997;100(6):1004–1014. doi: 10.1542/peds.100.6.1004. 9374573 [DOI] [PubMed] [Google Scholar]
- 33.Volpe J. Neurology of the Newborn. WB Saunders; Philadelphia: 1995. Hypoxic–ishcemic encephalopathy. [Google Scholar]
- 34.Ferriero D.M., Arcavi L.J., Simon R.P. Ontogeny of excitotoxic injury to nicotinamide adenine dinucleotide phosphate diaphorase reactive neurons in the neonatal rat striatum. Neuroscience. 1990;36(2):417–424. doi: 10.1016/0306-4522(90)90437-9. 2145527 [DOI] [PubMed] [Google Scholar]
- 35.Ferriero D.M., Sheldon R.A., Black S.M., Chuai J. Selective destruction of nitric oxide synthase neurons with quisqualate reduces damage after hypoxia–ischemia in the neonatal rat. Pediatr. Res. 1995;38(6):912–918. doi: 10.1203/00006450-199512000-00014. 8618793 [DOI] [PubMed] [Google Scholar]
- 36.Ferriero D.M., Holtzman D.M., Black S.M., Sheldon R.A. Neonatal mice lacking neuronal nitric oxide synthase are less vulnerable to hypoxic–ischemic injury. Neurobiol. Dis. 1996;3(1):64–71. doi: 10.1006/nbdi.1996.0006. 9173913 [DOI] [PubMed] [Google Scholar]
- 37.Burke R.E., Baimbridge K.G. Relative loss of the striatal striosome compartment, defined by calbindin-D28k immunostaining, following developmental hypoxic–ischemic injury. Neuroscience. 1993;56(2):305–315. doi: 10.1016/0306-4522(93)90333-b. 8247262 [DOI] [PubMed] [Google Scholar]
- 38.Nowicki J.P., Duval D., Poignet H., Scatton B. Nitric oxide mediates neuronal death after focal cerebral ischemia in the mouse. Eur. J. Pharmacol. 1991;204(3):339–340. doi: 10.1016/0014-2999(91)90862-k. 1773832 [DOI] [PubMed] [Google Scholar]
- 39.Yamamoto S., Golanov E.V., Berger S.B., Reis D.J. Inhibition of nitric oxide synthesis increases focal ischemic infarction in rat. J. Cereb. Blood Flow Metab. 1992;12(5):717–726. doi: 10.1038/jcbfm.1992.102. 1380515 [DOI] [PubMed] [Google Scholar]
- 40.Depré C., Fiérain L., Hue L. Activation of nitric oxide synthase by ischaemia in the perfused heart. Cardiovasc. Res. 1997;33(1):82–87. doi: 10.1016/s0008-6363(96)00176-9. 9059531 [DOI] [PubMed] [Google Scholar]
- 41.Wada K., Chatzipanteli K., Busto R., Dietrich W.D. Role of nitric oxide in traumatic brain injury in the rat. J. Neurosurg. 1998;89(5):807–818. doi: 10.3171/jns.1998.89.5.0807. 9817419 [DOI] [PubMed] [Google Scholar]
- 42.Brevetti L.S., Chang D.S., Tang G.L., Sarkar R., Messina L.M. Overexpression of endothelial nitric oxide synthase increases skeletal muscle blood flow and oxygenation in severe rat hind limb ischemia. J. Vasc. Surg. 2003;38(4):820–826. doi: 10.1016/s0741-5214(03)00555-x. 14560236 [DOI] [PubMed] [Google Scholar]
- 43.Dawson T.M., Bredt D.S., Fotuhi M., Hwang P.M., Snyder S.H. Nitric oxide synthase and neuronal NADPH diaphorase are identical in brain and peripheral tissues. Proc. Natl. Acad. Sci. USA. 1991;88(17):7797–7801. doi: 10.1073/pnas.88.17.7797. 1715581 [DOI] [PMC free article] [PubMed] [Google Scholar]
- 44.Dawson V.L., Dawson T.M., London E.D., Bredt D.S., Snyder S.H. Nitric oxide mediates glutamate neurotoxicity in primary cortical cultures. Proc. Natl. Acad. Sci. USA. 1991;88(14):6368–6371. doi: 10.1073/pnas.88.14.6368. 1648740 [DOI] [PMC free article] [PubMed] [Google Scholar]
- 45.Huang P.L., Dawson T.M., Bredt D.S., Snyder S.H., Fishman M.C. Targeted disruption of the neuronal nitric oxide synthase gene. Cell. 1993;75(7):1273–1286. doi: 10.1016/0092-8674(93)90615-w. 7505721 [DOI] [PubMed] [Google Scholar]
- 46.Huang Z., Huang P.L., Panahian N., Dalkara T., Fishman M.C., Moskowitz M.A. Effects of cerebral ischemia in mice deficient in neuronal nitric oxide synthase. Science. 1994;265(5180):1883–1885. doi: 10.1126/science.7522345. 7522345 [DOI] [PubMed] [Google Scholar]
- 47.Huang Z., Huang P.L., Ma J., Meng W., Ayata C., Fishman M.C. Enlarged infarcts in endothelial nitric oxide synthase knockout mice are attenuated by nitro-L-arginine. J. Cereb. Blood Flow Metab. 1996;16(5):981–987. doi: 10.1097/00004647-199609000-00023. 8784243 [DOI] [PubMed] [Google Scholar]
- 48.Black S.M., Bedolli M.A., Martinez S., Bristow J.D., Ferriero D.M., Soifer S.J. Expression of neuronal nitric oxide synthase corresponds to regions of selective vulnerability to hypoxia–ischaemia in the developing rat brain. Neurobiol. Dis. 1995;2(3):145–155. doi: 10.1006/nbdi.1995.0016. 9173998 [DOI] [PubMed] [Google Scholar]
- 49.Li L.L., Ginet V., Liu X., Vergun O., Tuittila M., Mathieu M. The nNOS-p38MAPK pathway is mediated by NOS1AP during neuronal death. J. Neurosci. 2013;33(19):8185–8201. doi: 10.1523/JNEUROSCI.4578-12.2013. 23658158 [DOI] [PMC free article] [PubMed] [Google Scholar]
- 50.Tribe R.M., Poston L. Oxidative stress and lipids in diabetes: a role in endothelium vasodilator dysfunction? Vasc. Med. 1996;1(3):195–206. doi: 10.1177/1358863X9600100304. 9546938 [DOI] [PubMed] [Google Scholar]
- 51.Ronson R.S., Nakamura M., Vinten-Johansen J. The cardiovascular effects and implications of peroxynitrite. Cardiovasc. Res. 1999;44(1):47–59. doi: 10.1016/s0008-6363(99)00184-4. 10615389 [DOI] [PubMed] [Google Scholar]
- 52.Lynch J.K., Nelson K.B. Epidemiology of perinatal stroke. Curr. Opin. Pediatr. 2001;13(6):499–505. doi: 10.1097/00008480-200112000-00002. 11753097 [DOI] [PubMed] [Google Scholar]
- 53.Johnston M.V., Trescher W.H., Ishida A., Nakajima W. Neurobiology of hypoxic-ischemic injury in the developing brain. Pediatr. Res. 2001;49(6):735–741. doi: 10.1203/00006450-200106000-00003. 11385130 [DOI] [PubMed] [Google Scholar]
- 54.Johnston M.V., Trescher W.H., Ishida A., Nakajima W. Novel treatments after experimental brain injury. Semin. Neonatol. 2000;5(1):75–86. doi: 10.1053/siny.1999.0116. 10802752 [DOI] [PubMed] [Google Scholar]
- 55.Halliwell B. Reactive oxygen species and the central nervous system. J. Neurochem. 1992;59(5):1609–1623. doi: 10.1111/j.1471-4159.1992.tb10990.x. 1402908 [DOI] [PubMed] [Google Scholar]
- 56.Khan J.Y., Black S.M. Developmental changes in murine brain antioxidant enzymes. Pediatr. Res. 2003;54(1):77–82. doi: 10.1203/01.PDR.0000065736.69214.20. 12646716 [DOI] [PubMed] [Google Scholar]
- 57.Kinouchi H., Epstein C.J., Mizui T., Carlson E., Chen S.F., Chan P.H. Attenuation of focal cerebral ischemic injury in transgenic mice overexpressing CuZn superoxide dismutase. Proc. Natl. Acad. Sci. USA. 1991;88(24):11158–11162. doi: 10.1073/pnas.88.24.11158. 1763030 [DOI] [PMC free article] [PubMed] [Google Scholar]
- 58.Chan P.H., Epstein C.J., Li Y., Huang T.T., Carlson E., Kinouchi H. Transgenic mice and knockout mutants in the study of oxidative stress in brain injury. J. Neurotrauma. 1995;12(5):815–824. doi: 10.1089/neu.1995.12.815. 8594209 [DOI] [PubMed] [Google Scholar]
- 59.Chan P.H., Kawase M., Murakami K., Chen S.F., Li Y., Calagui B. Overexpression of SOD1 in transgenic rats protects vulnerable neurons against ischemic damage after global cerebral ischemia and reperfusion. J. Neurosci. 1998;18(20):8292–8299. doi: 10.1523/JNEUROSCI.18-20-08292.1998. 9763473 [DOI] [PMC free article] [PubMed] [Google Scholar]
- 60.Fullerton H.J., Ditelberg J.S., Chen S.F., Sarco D.P., Chan P.H., Epstein C.J. Copper/zinc superoxide dismutase transgenic brain accumulates hydrogen peroxide after perinatal hypoxia ischemia. Ann. Neurol. 1998;44(3):357–364. doi: 10.1002/ana.410440311. 9749602 [DOI] [PubMed] [Google Scholar]
- 61.Beard J.L., Connor J.R., Jones B.C. Iron in the brain. Nutr. Rev. 1993;51(6):157–170. doi: 10.1111/j.1753-4887.1993.tb03096.x. 8371846 [DOI] [PubMed] [Google Scholar]
- 62.Beard J.L., Connor J.D., Jones B.C. Brain iron: location and function. Prog. Food Nutr. Sci. 1993;17(3):183–221. 7901870 [PubMed] [Google Scholar]
- 63.Beard J. Iron deficiency alters brain development and functioning. J. Nutr. 2003;133(5 Suppl. 1):1468S–1472S. doi: 10.1093/jn/133.5.1468S. 12730445 [DOI] [PubMed] [Google Scholar]
- 64.Halliwell B., Aeschbach R., Löliger J., Aruoma O.I. The characterization of antioxidants. Food Chem. Toxicol. 1995;33(7):601–617. doi: 10.1016/0278-6915(95)00024-v. 7628797 [DOI] [PubMed] [Google Scholar]
- 65.Halliwell B. The antioxidant paradox. Lancet. 2000;355(9210):1179–1180. doi: 10.1016/S0140-6736(00)02075-4. 10791396 [DOI] [PubMed] [Google Scholar]
- 66.Nappi A.J., Vass E. Hydroxyl radical formation via iron-mediated Fenton chemistry is inhibited by methylated catechols. Biochim. Biophys. Acta. 1998;1425(1):159–167. doi: 10.1016/s0304-4165(98)00062-2. [DOI] [PubMed] [Google Scholar]
- 67.Connor J.R. Iron acquisition and expression of iron regulatory proteins in the developing brain: manipulation by ethanol exposure, iron deprivation and cellular dysfunction. Dev. Neurosci. 1994;16(5–6):233–247. doi: 10.1159/000112115. 7768202 [DOI] [PubMed] [Google Scholar]
- 68.Connor J.R. Iron regulation in the brain at the cell and molecular level. Adv. Exp. Med. Biol. 1994;356:229–238. doi: 10.1007/978-1-4615-2554-7_25. 7887227 [DOI] [PubMed] [Google Scholar]
- 69.Palmer C., Menzies S.L., Roberts R.L., Pavlick G., Connor J.R. Changes in iron histochemistry after hypoxic–ischemic brain injury in the neonatal rat. J. Neurosci. Res. 1999;56(1):60–71. doi: 10.1002/(SICI)1097-4547(19990401)56:1<60::AID-JNR8>3.0.CO;2-A. 10213476 [DOI] [PubMed] [Google Scholar]
- 70.Dietrich R.B., Bradley W.G., Jr. Iron accumulation in the basal ganglia following severe ischemic–anoxic insults in children. Radiology. 1988;168(1):203–206. doi: 10.1148/radiology.168.1.3380958. 3380958 [DOI] [PubMed] [Google Scholar]
- 71.Hamilton K.O., Stallibrass L., Hassan I., Jin Y., Halleux C., Mackay M. The transport of two iron chelators, desferrioxamine B and L1, across Caco-2 monolayers. Br. J. Haematol. 1994;86(4):851–857. doi: 10.1111/j.1365-2141.1994.tb04841.x. 7918082 [DOI] [PubMed] [Google Scholar]
- 72.Palmer C., Roberts R.L., Bero C. Deferoxamine posttreatment reduces ischemic brain injury in neonatal rats. Stroke. 1994;25(5):1039–1045. doi: 10.1161/01.str.25.5.1039. 8165675 [DOI] [PubMed] [Google Scholar]
- 73.Sarco D.P., Becker J., Palmer C., Sheldon R.A., Ferriero D.M. The neuroprotective effect of deferoxamine in the hypoxic–ischemic immature mouse brain. Neurosci. Lett. 2000;282(1–2):113–116. doi: 10.1016/s0304-3940(00)00878-8. 10713409 [DOI] [PubMed] [Google Scholar]
- 74.Ponka P. Hereditary causes of disturbed iron homeostasis in the central nervous system. Ann. N. Y. Acad. Sci. 2004;1012:267–281. doi: 10.1196/annals.1306.022. 15105272 [DOI] [PubMed] [Google Scholar]
- 75.Gruer M.J., Artymiuk P.J., Guest J.R. The aconitase family: three structural variations on a common theme. Trends Biochem. Sci. 1997;22(1):3–6. doi: 10.1016/s0968-0004(96)10069-4. 9020582 [DOI] [PubMed] [Google Scholar]
- 76.Paraskeva E., Hentze M.W. Iron–sulphur clusters as genetic regulatory switches: the bifunctional iron regulatory protein-1. FEBS Lett. 1996;389(1):40–43. doi: 10.1016/0014-5793(96)00574-1. 8682202 [DOI] [PubMed] [Google Scholar]
- 77.Drapier J.C. Interplay between NO and [Fe−S] clusters: relevance to biological systems. Methods. 1997;11(3):319–329. doi: 10.1006/meth.1996.0426. 9073575 [DOI] [PubMed] [Google Scholar]
- 78.Cairo G., Pietrangelo A. Nitric-oxide-mediated activation of iron-regulatory protein controls hepatic iron metabolism during acute inflammation. Eur. J. Biochem. 1995;232(2):358–363. doi: 10.1111/j.1432-1033.1995.358zz.x. 7556182 [DOI] [PubMed] [Google Scholar]
- 79.Oria R., Sánchez L., Houston T., Hentze M.W., Liew F.Y., Brock J.H. Effect of nitric oxide on expression of transferrin receptor and ferritin and on cellular iron metabolism in K562 human erythroleukemia cells. Blood. 1995;85(10):2962–2966. 7742556 [PubMed] [Google Scholar]
- 80.Pantopoulos K., Hentze M.W. Nitric oxide signaling to iron-regulatory protein: direct control of ferritin mRNA translation and transferrin receptor mRNA stability in transfected fibroblasts. Proc. Natl. Acad. Sci. USA. 1995;92(5):1267–1271. doi: 10.1073/pnas.92.5.1267. 7533289 [DOI] [PMC free article] [PubMed] [Google Scholar]
- 81.Ponka P. Cellular iron metabolism. Kidney Int. Suppl. 1999;69:S2–11. doi: 10.1046/j.1523-1755.1999.055suppl.69002.x. 10084280 [DOI] [PubMed] [Google Scholar]
- 82.Chen Q., Xiao D.S. Long-term aerobic exercise increases redox-active iron through nitric oxide in rat hippocampus. Nitric Oxide. 2014;36:1–10. doi: 10.1016/j.niox.2013.10.009. 24184442 [DOI] [PubMed] [Google Scholar]
- 83.Verma N., Pink M., Petrat F., Rettenmeier A.W., Schmitz-Spanke S. Proteomic analysis of human bladder epithelial cells by 2D blue native SDS-PAGE reveals TCDD-induced alterations of calcium and iron homeostasis possibly mediated by nitric oxide. J. Proteome Res. 2015;14(1):202–213. doi: 10.1021/pr501051f. 25348606 [DOI] [PubMed] [Google Scholar]