Abstract
Background
Acute abdominal pain (AAP) is one of the most common causes of referral to an emergency department (ED), but information about its impact is limited.
Objectives
The objectives of this article are to define the prevalence of AAP among ED visits in a large university hospital and analyze its main clinical features.
Methods
All patients admitted at the Sant’Orsola, Malpighi University Hospital of Bologna ED on 12 a priori selected sample days in 2013 were included. General data were recorded for each patient. A total of 192 clinical variables were recorded for each patient with abdominal pain.
Results
During the observation period the ED assisted 2623 patients with a daily admission rate of 219 ± 20 (mean ± SD). Of these, 239 patients complained of AAP as their chief complaint at entry (prevalence = 9.1%). AAP prevalence was significantly higher in females than in males (10.4% vs. 7.8%; OR = 1.37; p = 0.021) as well as in foreign over Italian patients (13.2% vs. 8.5%; OR = 1.64; p = 0.007). The most frequent ED operative diagnoses were non-specific abdominal pain (n = 86, 36.0%) and gastrointestinal (GI) tract-related pain (n = 79, 33.1%; n = 19 upper GI, n = 60 lower GI).
Conclusions
AAP is a common cause of referral at EDs. Despite technological advances, non-specific abdominal pain is still the main operative diagnosis.
Keywords: Abdominal pain, emergency care, epidemiology, gastroenterology
Introduction
Acute abdominal pain (AAP) is a medical emergency, characterized by pain arising from the abdominal area, of non-traumatic origin with a maximum duration of five days.1
It is the most common surgical emergency, one of the most common reasons for referral to an emergency department (ED) and the most common cause for non-trauma-related hospital admissions.2,3
Abdominal pain represents the chief complaint at entry for about 8% of the total ED visits in the United States.4 It is hard to precisely quantify the number of affected individuals in Italy because of the paucity of epidemiological data in this area of medicine. However, AAP is recognized as one of the leading causes of medical consultation and hospitalization.5,6
Although there is a lack of objective data validating ED overcrowding, clear evidence shows that the use of emergency services is increasing and EDs are not able to meet this growing demand.7–9 Furthermore, ED waiting times and the percentage of total ED visits in which the patient left before being seen are increasing as well.10 Solutions to these problems, indeed, rely mostly on the implementation of primary care as well as on the prediction of admission demand when patients arrive to the ED.11–14 Thus, there is a clear need to quantify various aspects of ED activity to rationalize and optimize emergency care activities.15–17
The aim of the present study was to analyze the daily workload at the ED of a large university hospital, with special regard to patients admitted because of AAP.
Methods
Patient selection
The study included all the admissions at the ED of the Sant’Orsola, Malpighi University Hospital of Bologna, Italy, on 12 days of the first semester in 2013.
The group of patients younger than 18 years was left out of the analysis since pediatric patients present with different symptoms due to different disorders.
In order to minimize selection bias, the study days were a priori selected as follows:
January: a working day (Thursday, 3rd) in the first week and a holiday (Saturday, 19th) in the third week; February: a working day (Wednesday, 13th) in the second week and a working day (Tuesday, 19th) in the third week; March: a holiday (Sunday, 3rd) in the first week and a working day (Monday, 25th) in the last week; April: a working day (Friday, 5th) in the first week and a holiday (Saturday, 13th) in the second week; May: a working day (Wednesday, 8th) in the second week and a working day (Thursday, 16th) in the third week; June: a holiday (Sunday, 2nd) in the first week and a working day (Tuesday, 25th) in the last week.
Study setting
The ED is part of Sant’Orsola, Malpighi University Hospital of Bologna. It is a large medical center that every year handles approximately 72,000 admitted cases and 400,000 outpatient visits by medical specialists.
The ED is divided into three units: 1) a higher intensity unit, in which it is possible to simultaneously manage eight patients with a high degree of severity/risk and four with an extreme degree of severity/risk; 2) a lower intensity unit, where it is possible to manage 10 patients with a mild degree of severity/risk, as well as patients with a moderate degree of severity/risk; and 3) a short-stay observation unit, with nine beds for patients who do not need to be hospitalized, but require some observation time before discharge. The ED staff consists of 31 physicians, 58 nurses and 25 health care support workers, with rotating shifts.
Methods
A standard Excel table was developed to retrospectively collect, on the study days, general data for each ED admission, and specific data for the patients who arrived in the ED with AAP as one of the complaints prompting a search for medical care. Both generic and specific data were obtained from the ED clinical record stored in the ED’s computerized databases. General Data included gender, nationality, year of birth, severity admission code, ambulance arrival and chief complaint for admission. To collect the chief complaints for admission, 28 causes were listed, according to the National Hospital Ambulatory Medical Care Survey (NHAMCS) table,3 the International Classification of Diseases (ICD-10) and a previously established international coding system.18 Specific data included 192 clinical attributes that were grouped as follows: vital signs, past and recent history, physical examination, imaging, consultation, blood and urine tests, diagnosis (operative diagnosis of ED physicians), duration of stay and discharge, onsite and prescribed treatments. In this article all the data presented have been sufficiently anonymized and do not contain any personal information about an identifiable living individual. The study was carried out in accordance with the Helsinki Declaration and all patients gave their consent to the handling of their clinical data at entry.
Statistical analysis
Absolute and relative frequencies were reported as descriptive statistics of discrete data. Mean and standard deviation (SD) of daily admission rate was computed as well as median and range of age and duration of hospital stay. The Pearson and the linear-by-linear chi-squared tests and the Fisher’s exact test were applied to nominal, ordinal and dichotomous discrete variables, respectively. The odds ratios (ORs) related to the prevalence of AAP were also calculated together with their 95% confidence intervals (CIs). Scale variables were analyzed by means of the Kruskal-Wallis test. The IBM SPSS package (version 21, IBM Co., Armonk, NY, USA) was used to analyze the data. Two-tailed p values less than 0.05 were considered significant.
Results
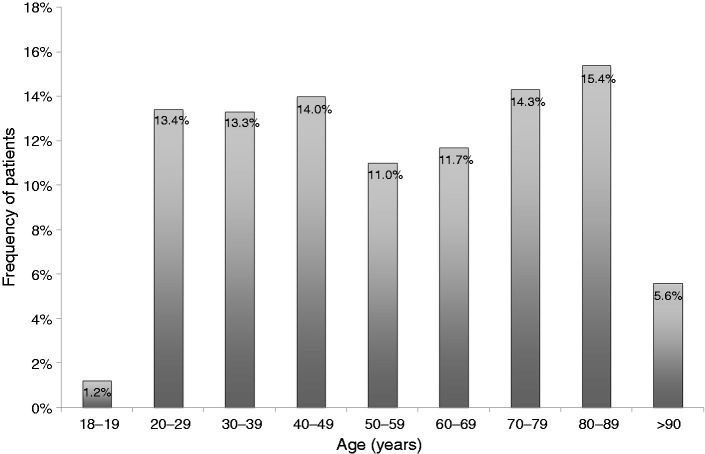
During the 12 days of observation between January and June 2013, the ED of the Sant’Orsola, Malpighi University Hospital of Bologna assisted 2623 patients, with a mean ± SD daily admission rate of 219 ± 20. Among those patients, 1296 were males and 1327 females (49.4% vs. 50.6%). The median age of the 2623 available patients was 57 years (range 18–104 years). The two largest age groups were the 70–79 (n = 375) and the 80–89 (n = 405) decades (Figure 1).
Figure 1.
Age distribution of 2623 patients admitted in the emergency department (ED) of the Sant’Orsola, Malpighi University Hospital of Bologna during 12 selected days between January and June 2013.
The majority of included individuals were native Italians: 2274 patients (86.7%), while the 349 foreign patients (13.2%) were from 50 different nations, with more than half of them (n = 190, 54.4%) originating from Morocco (n = 60, 17.2%), Romania (n = 46, 13.2%), Moldova (n = 26, 7.4%), Pakistan (n = 25, 7.2%), Ukraine (n = 17, 4.9%) and Albania (n = 16, 4.6%).
Upon arrival at the ED, the majority of patients were given a moderate degree of severity/risk: (n = 1526, 58.2%), the second largest group received a high degree of severity/risk (770, 29.4%), whereas a minority received either a mild (250, 9.5%) or an extreme degree of severity/risk: (77, 2.9%). Only a third of the patients (938, 35.8%) were referred at ED by ambulance. Of these, 496 (52.9%) were attributed a high or extreme degree of severity/risk.
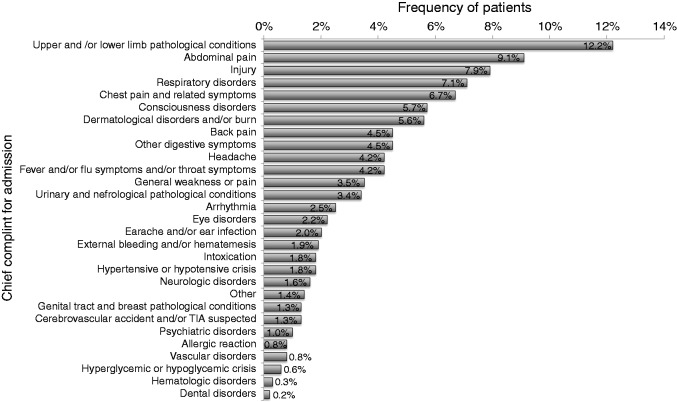
Figure 2 shows the prevalence of the chief complaints at admission during the observation period. Injury was the most frequent pathological condition (n = 526, 20.1%, including limb and other injuries). The second most common cause of referral to ED is represented by thoracic conditions (n = 363, 13.8%, including chest pain and respiratory problems) followed by gastrointestinal (GI) problems (n = 356, 13.6%, including abdominal pain and other digestive symptoms).
Figure 2.
Chief complaints at admission in 2623 patients selected among those seen in the emergency department (ED) of the Sant’Orsola, Malpighi University Hospital of Bologna between January and June 2013.
A total of 239 patients reported AAP as their chief complaint at admission (9.1%). AAP did not present a significantly greater prevalence on holidays than on working days (9.9% vs. 8.8%, p = 0.379) and during the first quarter (January through March) of the year as compared to the second quarter (April through June) (9.8% vs. 8.4%, p = 0.222).
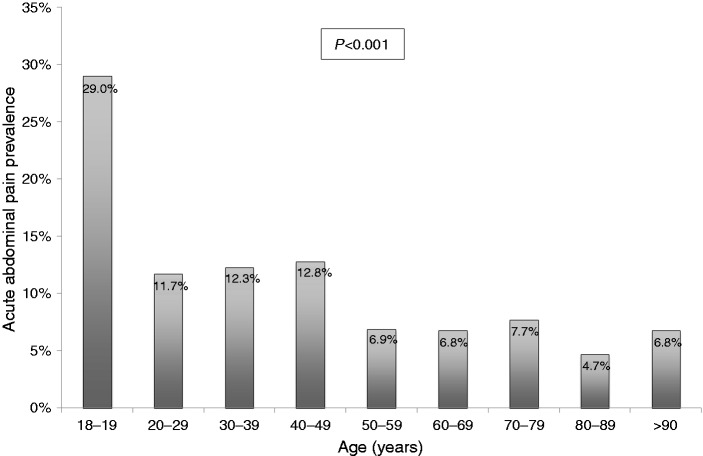
AAP patients were generally younger than those with other complaints with a median age of 44 years (range 18–97 years) vs. 58 years (range 18–104 years) (p < 0.001). In fact the prevalence of AAP significantly decreased with age (Figure 3; p < 0.001).
Figure 3.
Prevalence of acute abdominal pain (AAP) according to the age of 2623 patients selected among those seen in the emergency department (ED) of the Sant’Orsola, Malpighi University Hospital of Bologna between January and June 2013 (linear-by-linear chi-squared test).
The prevalence of AAP was significantly higher in females than in males (10.4% vs. 7.8%; OR = 1.37, 95% CI: 1.05–1.80; p = 0.021) as well as in foreign over Italian patients (13.2% vs. 8.5%; OR = 1.64, 95% CI: 1.16–2.31; p = 0.007).
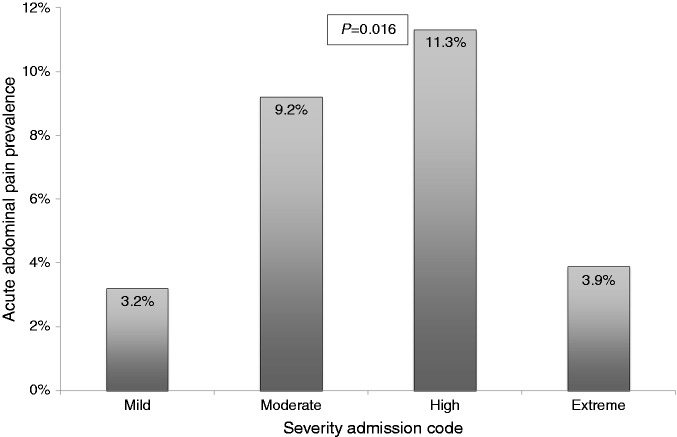
Figure 4 shows a positive trend of prevalence of AAP with the severity codes at entry (p = 0.016), although the value is particularly low in the extreme degree of severity/risk admission code.
Figure 4.
Prevalence of acute abdominal pain (AAP) according to the severity admission code of 2623 patients selected among those seen in the emergency department (ED) of the Sant’Orsola, Malpighi University Hospital of Bologna between January and June 2013 (linear-by-linear chi-squared test).
As for diagnostic management, abdominal X-ray was performed for 84 AAP patients (35.1%), an abdominal ultrasound (US) was performed in 105 patients (43.9%) and a computer tomography (CT) in 39 patients (16.3%), 20 of which (51.3%) were performed with contrast medium (intravenous iodinated radiocontrast). In addition, 88 AAP patients (36.8%) underwent other imaging techniques, 216 patients (90.4%) underwent blood analysis whereas 43 patients (18.0%) urine analysis.
Specific results of imaging procedures were analyzed and summarized in Table 1.
Table 1.
Imaging procedures performed by the emergency department physicians for the diagnostic management of 239 patients who reported acute abdominal pain as their chief complaint at admission
| Imaging procedure performed | Frequency of patients | Frequency of NSA as final operative diagnosis |
|---|---|---|
| X-ray | 83 (35.1%) | 24 (28.6%) |
| Ultrasound | 105 (43.9%) | 33 (31.4%) |
| Computer tomography | 39 (16.3%) | 11 (28.2%) |
| X-ray and ultrasound | 27 (11.3%) | 10 (37.0%) |
| X-ray and computer tomography | 8 (3.3%) | 1 (12.5%) |
| Ultrasound and computer tomography | 14 (5.9%) | 5 (35.7%) |
| X-ray and ultrasound and computer tomography | 4 (1.7%) | 1 (25.0%) |
NSA: non-specific abdominal pain.
The patients who underwent abdominal X-ray turned out to show a pathological alteration in 53 cases (63.1%), the majority of which were represented by ileal loop distension. Nevertheless, 27 cases had to also undergo an abdominal US, and eight cases a CT.
The CT performed showed a pathological alteration in 34 cases (87.2%) that significantly contributed to the diagnosis. As a matter of fact, among the patients who underwent CT, only 11 cases (28.2%) received an unspecific diagnosis.
As for abdominal US, it revealed an organic disease potentially responsible for AAP in 57 cases (52.8%), and 33 patients (31.4%) who underwent US received an unspecific diagnosis.
Among the patients who underwent other imaging techniques, the vast majority (n = 83, 94.3%) had chest X-rays, and in 71 cases (86.5%) no new findings were discovered.
Table 2 shows the distribution of the final diagnosis made at the ED.
Table 2.
Frequency of the operative diagnosis made by emergency department (ED) physicians on 239 patients who reported acute abdominal pain as their chief complaint at admission
| Operative diagnosis of ED physicians | Frequency of patients |
|---|---|
| Non-specific abdominal pain | 86 (36.0%) |
| GERD | 1 (0.4%) |
| Gastrointestinal (sub)occlusion | 24 (10.0%) |
| Gastroenteritis, enterocolitis | 13 (5.4%) |
| Appendicitis | 3 (1.3%) |
| Diverticulitis | 8 (3.3%) |
| Gastrointestinal hemorrhage | 2 (0.8%) |
| Gastrointestinal ischemia | 1 (0.4%) |
| Biliary colic | 14 (5.9%) |
| Liver disease | 3 (1.3%) |
| Pancreatic disease | 6 (2.5%) |
| Renal urinary tract disease | 45 (18.8%) |
| Genital tract disease | 6 (2.5%) |
| Other diagnosis | 27 (11.3%) |
GERD: gastroesophageal reflux disease.
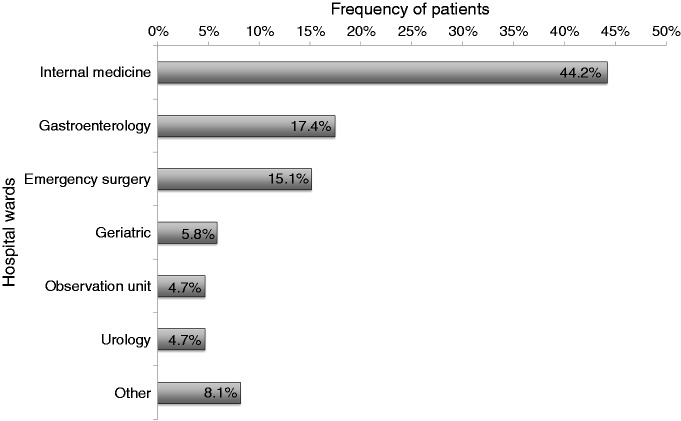
The majority of AAP patients (n = 153, 64.0%) were discharged to a general practitioner’s care, whereas 86 patients were hospitalized. The most frequent hospital wards to which patients were sent were internal medicine (n = 38, 44.2%), gastroenterology (n = 15, 17.4%) and emergency surgery (n = 13, 15.1%) (Figure 5).
Figure 5.
Hospital wards where the hospitalized patients were assigned by the physicians of the emergency department (ED) of the Sant’Orsola, Malpighi University Hospital of Bologna.
AAP sub-groups
The 239 patients with AAP were classified into four main groups based on the diagnosis made at the ED: non-specific abdominal pain (NSA), digestive tract-related pain (DIG), hepatopancreatic-related pain (HBP) and urogenital-related pain (URO).
The largest group was represented by NSA with 86 patients (36.0%), followed by DIG with 79 patients (33.1%), 19 of whom had upper GI disorders and 60 had lower GI disorders. The third largest group was URO diagnosed in 51 patients (21.3%), while the smallest group was represented by HBP, diagnosed in 23 patients (9.6%).
Table 3 shows that the DIG and HBP groups had a higher rate of nausea and vomiting at arrival, whereas URO group patients had a higher rate of dysuria. Almost-one half of patients in the HBP group had heartburn and/or regurgitation at arrival. Fullness and/or anorexia, hematemesis, constipation, diarrhea, fever, bloody stool and cough and/or dyspnea were not significantly different among the four groups.
Table 3.
Differences in clinical presentation, imaging procedures and treatment among the four diagnostic subgroups of 239 patients who reported acute abdominal pain as their chief complaint at admission
| Characteristics | Overall (n = 239) | Group NSA (n = 86) | Group DIG (n = 79) | Group HBP (n = 23) | Group URO (n = 51) | p-valuesa |
|---|---|---|---|---|---|---|
| Nausea/vomiting | 86 (36.0%) | 20 (23.3%) | 40 (50.6%) | 13 (56.5%) | 13 (25.5%) | <0.001 |
| Dysuria | 31 (13.0%) | 7 (8.1%) | 2 (2.5%) | 1 (4.3%) | 21 (41.2%) | <0.001 |
| Heartburn/regurgitation | 43 (18.0%) | 11 (12.8%) | 19 (24.1%) | 10 (43.5%) | 3 (5.9%) | <0.001 |
| Right upper quadrant pain | 166 (69.5%) | 58 (67.4%) | 61 (77.2%) | 23 (100%) | 24 (47.1%) | <0.001 |
| Left upper quadrant pain | 138 (57.7%) | 44 (51.2%) | 59 (74.7%) | 14 (60.9%) | 21 (41.2%) | 0.001 |
| Right lower quadrant pain | 151 (63.3%) | 60 (69.8%) | 52 (65.8%) | 6 (26.1%) | 33 (64.7%) | 0.001 |
| Left lower quadrant pain | 128 (53.6%) | 43 (50.0%) | 53 (67.1%) | 2 (8.7%) | 30 (58.8%) | <0.001 |
| Murphy’s sign | 62 (25.9%) | 18 (20.9%) | 18 (22.8%) | 14 (60.9%) | 12 (23.5%) | 0.001 |
| Giordano’s sign | 91 (38.1%) | 27 (31.4%) | 18 (22.8%) | 5 (21.7%) | 41 (80.4%) | <0.001 |
| Blumberg’s sign | 156 (65.3%) | 52 (60.5%) | 58 (73.4%) | 17 (73.9%) | 29 (56.9%) | 0.136 |
| Colonic diverticula | 11 (4.6%) | 2 (2.3%) | 9 (11.4%) | 0 | 0 | 0.005 |
| Cholelithiasis | 20 (8.4%) | 4 (4.7%) | 7 (8.9%) | 8 (34.8%) | 1 (2.0%) | <0.001 |
| Abdominal X-ray | 84 (35.1%) | 26 (30.2%) | 44 (55.7%) | 8 (34.8%) | 6 (11.8%) | <0.001 |
| Abdominal US | 105 (43.9%) | 36 (41.9%) | 22 (27.8%) | 13 (56.5) | 34 (66.7%) | <0.001 |
| NSAIDs in ED | 50 (20.9%) | 9 (10.5%) | 8 (10.1%) | 9 (39.1%) | 24 (47.1%) | <0.001 |
| Antiemetics/prokinetics in ED | 47 (19.7%) | 14 (16.3%) | 19 (24.1%) | 8 (34.8%) | 6 (11.8%) | 0.074 |
| Antibiotics in ED | 5 (2.1%) | 0 | 3 (3.8%) | 0 | 2 (3.9%) | 0.232 |
| Prescribed antibiotics | 43 (18.0%) | 8 (9.3%) | 11 (13.9%) | 1 (4.3%) | 23 (45.1%) | <0.001 |
NSA: non-specific abdominal pain; DIG: digestive tract-related pain; HBP: hepatopancreatic-related pain; URO: urogenital-related pain; US: ultrasound; ED: emergency department; NSAIDs: nonsteroidal anti-inflammatory drugs. Pearson chi-squared test.
Pain was more frequently located in the right upper quadrant in HBP patients and in the left upper quadrant in DIG patients. Both the right lower quadrant and the left lower quadrant were less painful in the HBP group.
Murphy’s sign (a maneuver to test positivity for cholecystitis), Giordano’s sign (to test costovertebral angle tenderness during renal disorders) and Blumberg’s sign (to test rebound tenderness during peritonitis) were evaluated. There were significant differences among the AAP patient sub-groups as far as Murphy’s and Giordano’s signs were concerned; these signs were detected higher respectively in the HBP and URO groups, while Blumberg’s sign was not significantly higher in the DIG group.
As expected, colonic diverticula were more frequently reported in the clinical history of patients in the DIG group than in all other groups, whereas cholelithiasis was more common in the HBP group.
Significant differences were also detected in imaging testing: abdominal X-ray was performed more frequently in DIG patients, while HBP and URO patients underwent abdominal US more frequently than the others.
Onsite and prescribed treatments showed differences among the four groups. In particular, nonsteroidal anti-inflammatory drugs (NSAIDs) were more frequently administered in the ED in HBP and URO patients than in NSA and DIG patients.
Antiemetics/prokinetics were more frequently administered in the ED in the DIG and HBP groups than in the NSA and URO groups.
Antibiotics were rarely administered in the ED, but they were prescribed at discharge more frequently in the URO group.
Finally, the median duration of stay for AAP patients at the ED was 4.2 hours, ranging from 17 minutes to 24.1 hours. Notably, the duration of stay was not significantly (p = 0.709) different among patients with different operative diagnoses.
Discussion and conclusion
AAP is one of the most frequent causes of referral to the ED of a large university hospital in Italy. The observed prevalence of 9.1% is consistent with previously published data. A lower prevalence was reported in previous studies in which patients with urinary symptoms or flank pain were excluded from the diagnosis of acute abdominal pain.3
Other results of our study describing clinical activities of our ED are consistent with data from other countries. Patients older than 70 years represent the largest referred group in Italy as well as in other countries.19–21 Also, the majority of AAP patients were given a moderate or high degree of severity/risk at our ED similarly to patients seen in other hospitals.19–21 Demographics data reveal that age and gender distribution among AAP patients is similar worldwide. They tend to be relatively young patients, with a prevalence of females, ranging from 51%20 to 65%19 and with a high hospital admission rate, ranging from 25%19 to 35%.21
A large proportion of cases of AAP remain classified as non-specified abdominal pain, in all published series ranging from 15.5% at the Institute of Surgery of La Sapienza, Roma, Italy, 21.1% at the Virginia Hospital, United States, 36.0% in our ED and up to 39.9% at the Department of Surgery, Royal Devon, United Kingdom.20–24
Our data about resource utilization deserve some further considerations: the rates of abdominal X-ray, US and CT performed poorly reflect current international guidelines indications:3 In our ED X-ray still remains more frequently (35.1%) used than CT (16.3%) despite a lower diagnostic yield. Chest X-ray appears to be overprescribed, since a large number of AAP patients had undergone this procedure without new findings being discovered. On the other hand, the treatment management at our ED seems to reflect current international guidelines given the significant difference of specific drug use among the different diagnostic groups and the little use of antibiotics that probably started after admission on the ward. Despite technological advances, AAP diagnosis and treatment still represents a major clinical challenge for ED doctors. It would be a good practice, for future research works, to keep collecting data about AAP patients.25
This may provide the opportunity to find more correlations between the patient’s presentation, imaging data, laboratory test results and the actual diagnosis, in order to define a less invasive and less expensive workup for AAP patients seen in EDs.
Funding
This research received no specific grant from any funding agency in the public, commercial, or not-for-profit sectors.
Conflict of interest
None declared.
References
- 1.Gans SL, Pols MA, Stoker J, et al. Guideline for the diagnostic pathway in patients with acute abdominal pain. Dig Surg 2015; 32: 23–31. [DOI] [PubMed] [Google Scholar]
- 2.Trentzsch H, Werner J, Jauch KW. Acute abdominal pain in the emergency department—a clinical algorithm for adult patients [article in German]. Zentralbl Chir 2011; 136: 118–128. [DOI] [PubMed] [Google Scholar]
- 3.Macaluso CR, McNamara RM. Evaluation and management of acute abdominal pain in the emergency department. Int J Gen Med 2012; 5: 789–797. [DOI] [PMC free article] [PubMed] [Google Scholar]
- 4.National Center for Health Statistics (NCHS). National Hospital Ambulatory Medical Care Survey: 2010 Emergency Department Summary Table. Centers for Disease Control and Prevention, http://www.cdc.gov/nchs/data/ahcd/nhamcs_emergency/2010_ed_web_tables.pdf (2010, accessed 15 May 2015).
- 5.Centro Nazionale di Epidemiologia, Sorveglianza e Promozione della Salute. Sistema di sorveglianza sindromica degli accessi ai Pronto soccorso. Epicentro, http://www.epicentro.iss.it/focus/sorveglianza/ProntoSoccorso.asp (2015, accessed 15 May 2015).
- 6.Ministero della Salute, Sistema Informativo Sanitario. Distribuzione dei dimessi per grandi gruppi di cause, Strutture pubbliche e Case di cura accreditate, Ricoveri per acuti, regime ordinario, Anno 2008, http://www.salute.gov.it/salaStampa/documenti/AA_3.pdf (2008, accessed 15 May 2015).
- 7.Olshaker JS. Managing emergency department overcrowding. Emerg Med Clin North Am 2009; 27: 593–603, viii. [DOI] [PubMed] [Google Scholar]
- 8.Di Somma S, Paladino L, Vaughan L, et al. Overcrowding in emergency department: An international issue. Intern Emerg Med 2015; 10: 171–175. [DOI] [PubMed] [Google Scholar]
- 9.Pitts SR, Carrier ER, Rich EC, et al. Where Americans get acute care: Increasingly, it’s not at their doctor’s office. Health Aff (Millwood) 2010; 29: 1620–1629. [DOI] [PubMed] [Google Scholar]
- 10.Pitts SR, Vaughns FL, Gautreau MA, et al. A cross-sectional study of emergency department boarding practices in the United States. Acad Emerg Med 2014; 21: 497–503. [DOI] [PubMed] [Google Scholar]
- 11.D’Arcy LP, Stearns SC, Domino ME, et al. Is geriatric care associated with less emergency department use? J Am Geriatr Soc 2013; 61: 4–11. [DOI] [PMC free article] [PubMed] [Google Scholar]
- 12.Khangura JK, Flodgren G, Perera R, et al. Primary care professionals providing non-urgent care in hospital emergency departments. Cochrane Database Syst Rev 2012; 11: CD002097–CD002097. [DOI] [PMC free article] [PubMed] [Google Scholar]
- 13.Finn JC, Fatovich DM, Arendts G, et al. Evidence-based paramedic models of care to reduce unnecessary emergency department attendance—feasibility and safety. BMC Emerg Med 2013; 13: 13–13. [DOI] [PMC free article] [PubMed] [Google Scholar]
- 14.Yen K, Gorelick MH. Strategies to improve flow in the pediatric emergency department. Pediatr Emerg Care 2007; 23: 745–749; quiz 750-751. [DOI] [PubMed] [Google Scholar]
- 15.Ruger JP, Richter CJ, Spitznagel EL, et al. Analysis of costs, length of stay, and utilization of emergency department services by frequent users: Implications for health policy. Acad Emerg Med 2004; 11: 1311–1317. [DOI] [PubMed] [Google Scholar]
- 16.Cairns CB, Glickman SW. Time makes a difference to everyone, everywhere: The need for effective regionalization of emergency and critical care. Ann Emerg Med 2012; 60: 638–640. [DOI] [PubMed] [Google Scholar]
- 17.Peck JS, Benneyan JC, Nightingale DJ, et al. Predicting emergency department inpatient admissions to improve same-day patient flow. Acad Emerg Med 2012; 19: E1045–E1054. [DOI] [PubMed] [Google Scholar]
- 18.Aronsky D, Kendall D, Merkley K, et al. A comprehensive set of coded chief complaints for the emergency department. Acad Emerg Med 2001; 8: 980–989. [DOI] [PubMed] [Google Scholar]
- 19.Hastings RS, Powers RD. Abdominal pain in the ED: A 35 year retrospective. Am J Emerg Med 2011; 29: 711–716. [DOI] [PubMed] [Google Scholar]
- 20.Caterino S, Cavallini M, Meli C, et al. Acute abdominal pain in emergency surgery. Clinical epidemiologic study of 450 patients [article in Italian]. Ann Ital Chir 1997; 68: 807–817; discussion 817-818. [PubMed] [Google Scholar]
- 21.Irvin TT. Abdominal pain: A surgical audit of 1190 emergency admissions. Br J Surg 1989; 76: 1121–1125. [DOI] [PubMed] [Google Scholar]
- 22.Brewer BJ, Golden GT, Hitch DC, et al. Abdominal pain. An analysis of 1,000 consecutive cases in a University Hospital emergency room. Am J Surg 1976; 131: 219–223. [DOI] [PubMed] [Google Scholar]
- 23.Flasar MH, Cross R, Goldberg E. Acute abdominal pain. Prim Care 2006; 33: 659–684, vi. [DOI] [PubMed] [Google Scholar]
- 24.Powers RD, Guertler AT. Abdominal pain in the ED: Stability and change over 20 years. Am J Emerg Med 1995; 13: 301–303. [DOI] [PubMed] [Google Scholar]
- 25.Lavelle SM, Kanagaratnam B. The information value of clinical data. Int J Biomed Comput 1990; 26: 203–209. [DOI] [PubMed] [Google Scholar]


