

Abstract
Background:
Population-based cancer registry collects the data on cancer incidence and mortality deaths from covered population to describe and survey the epidemics in certain areas. The aim of this study was to estimate the cancer incidence and mortality in Wuwei, Gansu province, Northwestern China from 2003 to 2012. The goal is to better understand cancer distribution and long-term development of cancer prevention and treatment in Wuwei.
Methods:
Data were collected from the Wuwei Cancer Registry between 2003 and 2012. In this registry, data from 46 cancer report centers were included in this analysis. Incidence/mortality rates, age-specific incidence/mortality rates, age-standardized incidence/mortality rates, and cumulative incidence/mortality rates were calculated. Totally, 9,836,740 person-years (5,110,342 for males and 4,726,398 for females) had been monitored over this time period. The gender ratio of male/female was 1.08:1. The number of new cancer cases and related deaths was 24,705 and 17,287 from 2003 to 2012, respectively.
Results:
The proportion of morphological verification was 74.43%. The incidence of cases identified through death certification only was 1.21%, and the mortality to incidence ratio was 0.70. The average crude incidence was 251.15/100,000 persons (310.61 and 186.87 for males and females per 100,000 persons, respectively). The age-standardized rates by Chinese standard population (ASR-China) and by world standard population (ASR-world) were 207.76 and 245.42 per 100,000 persons, respectively. The crude cancer mortality was 175.74/100,000 persons (228.34 and 118.86 for males and females per 100,000 persons). ASR for China and the world was 149.57 and 175.13/100,000 persons, respectively. The most common cancers and leading causes of cancer-related deaths in Wuwei were as follows: cancers of stomach, esophagus, liver, lung, colorectum, breast, cervix, lymphoma, blood (leukemia), brain, and central nervous system. In Wuwei, during 2003 and 2012, cancer incidence and mortality rates increased by 1.32% and 1.31%/year, respectively. During this time, colorectum cancer incidence and mortality rates increased by 2.69% and 7.54%/year, respectively, in Wuwei. The incidence and mortality of other gastric, esophageal, liver, and lung cancers also all increased.
Conclusions:
The results of this study report a more accurate cancer burden among the population of Wuwei, China. Active research of cancers etiology and effective prevention should be established to reduce the incidence and mortality associated with cancers.
Keywords: Cancer Registry, China, Incidence, Mortality
INTRODUCTION
Cancer has become the leading cause of death worldwide, which has caused a great burden on public health. According to several studies, cancer incidence and mortality have been gradually rising. In 2012, it was reported that over 12 million new cancer cases and 8 million cancer-related deaths occurred worldwide.[1,2] In China, 3 million new cancer cases and 2 million cancer-related deaths occur every year.[3] Epidemiological studies have found that an increase in cancer cases in developing countries is a result of population aging and growth, smoking, physical inactivity, and westernized diets.[4,5] With the globalization of the economy, unprecedented social and environmental changes, and aging of the populations in many countries, conspicuous trends are being seen in the cancer incidence. The estimates for new cases and deaths were added to reflect the tumor burdens in different areas in a more direct way. The control of cancer has become a global and strategic point of governments, and to master the situation of cancer is the fundamental basis for make plans to control cancer. Population-based cancer registries that have provided cancers incidence and mortality statistics since the 1960s in European countries.[6] In China, the limited population coverage of cancer registry that has provided inadequate cancer information. Some of the cancer registries have existed for more than 40 years, but the development of cancer registration was very slow before the year 2000. In China, the National Central Cancer Registry (NCCR) was established in 2002, since then, the population coverage and quality of cancer registry have noticeably improving.
Wuwei is located in the Eastern region of the Hexi Corridor in Gansu province, China, at approximately 37°23′ and 38°12′ North latitude and 101°59′ and l03°23′ East longitude.[7] In 2012, the population was approximately 1,020,274 including 710,634 individual's associated with rural environments and 309,640 associated with urban environments. Although Wuwei is located in Northwestern China, it is one of the earliest areas to implement tumor monitoring and control China.[8] As the representative area of the Northwestern China, Wuwei has experienced remarkable changes in its environment and lifestyle as a result of recent economic development. Wuwei is located in an agriculture region, so the local population is relatively stable and suitable for cancer registration and follow-up. In 2002, the Ministry of Health established the “National Cancer Registration Center” requested cancer registration in Wuwei, Gansu province to promote and accelerate cancer registration within China. To date, Wuwei has been tracking the incidence and mortality of local residents for more than 10 years, which has provided the basic data that has contributed to cancer research, clinical trials, and cancer control strategies. At present, there are 46 cancer report centers covering more than 1 million people.
The aim of this study was to determine the incidence and mortality of Wuwei cancer patients between 2003 and 2012, using standard quality control and analytical methods. In this study, a systematic examination of cancer incidence and mortality of Wuwei residents was performed using data from a population-based cancer registry over the course of 10 years. The results of this study provide a basis for future studies to compare and assess the overall effective of cancer health care in Wuwei. In addition, this study provides insight into the most common types of cancer and cancer-related deaths, which can shed light on the cancer incidence and mortality rates in this city of China.
METHODS
Sources of data
The Wuwei Cancer Registry has collected cancer data and information from the local population including cancer incidence, survival, related deaths, and population demographics. From 2003 to 2012, we collected Wuwei incidence/mortality data, with the International Classification of Diseases (ICD)-10 codes of C00–C97. In addition, population coverage data were also collected. New cancer cases were followed-up and their personal information including detailed cancer data were recorded. Mortality information was retrieved from the local population-based death database. Population data were collected from Wuwei statistics and the public security census data department. The registered population consisted of 9,836,740 person-years (5,110,342 and 4,726,398 for males and females, respectively) from 2003 to 2012 [Table 1]. The covered population accounted for 60% of the whole population in Wuwei. The Wuwei Cancer Registry collects and analyzes cancer incidence, mortality, and survival data, including data for cancers with ICD-10 codes of C00–C97. Total cancer incidence was 24,705 (15,873 and 8832 male and female, respectively) and total cancer-related deaths were 17,287 (11,669 and 5618 male and female, respectively) during this period.
Table 1.
Population coverage in Wuwei city from 2003 to 2012 (n)
| Gender | 2003 | 2004 | 2005 | 2006 | 2007 | 2008 | 2009 | 2010 | 2011 | 2012 | Total |
|---|---|---|---|---|---|---|---|---|---|---|---|
| Male | 483,105 | 488,418 | 491,225 | 509,872 | 520,994 | 515,190 | 521,276 | 526,202 | 523,472 | 530,588 | 5,110,342 |
| Female | 446,901 | 451,620 | 458,797 | 460,169 | 465,412 | 476,265 | 481,055 | 486,487 | 510,031 | 489,661 | 4,726,398 |
| Total | 930,006 | 940,038 | 950,022 | 970,041 | 986,406 | 991,455 | 1,002,331 | 1,012,689 | 1,033,503 | 1,020,249 | 9,836,740 |
Data quality control
Wuwei Cancer Registry is a population-based cancer registry that collects information on total cancer cases and related deaths in this city. The registry uses both active and passive methods of data collection. All data files received from lower-level registries and hospitals are checked with cancer report lists and death certificate notifications to identify missing cases and to exclude duplicate registrations. The comparability, completeness, validity, and timeliness were used to address data quality. Proportion of morphological verification (MV%), percentage of cancer cases identified with death certification only (DCO%), mortality to incidence ratio (M/I), and the percentage of cancers with undefined or unknown primary sites (O and U%) were used to evaluate the completeness, validity, and reliability of gastric cancer statistics. According to the International Association of Cancer Registries (IACR) and NCCR requirements of cancer registration data,[9,10,11] our data evaluation was as follows: 74.43% MV%, 1.21% DCO%, 0.70 M/I, 0.23% O and U% [Table 2].
Table 2.
Quality evaluation of cancers in Wuwei cancer registration from 2003 to 2012
| Year | Incidence case | Deaths (n) | M/I | MV% | DCO% | O and U% |
|---|---|---|---|---|---|---|
| 2003 | 1951 | 1431 | 0.73 | 59.18 | 1.51 | 0.39 |
| 2004 | 2271 | 1331 | 0.59 | 62.41 | 1.95 | 0.27 |
| 2005 | 2245 | 1515 | 0.67 | 63.21 | 1.68 | 0.17 |
| 2006 | 2151 | 1810 | 0.84 | 77.86 | 1.17 | 0.3 |
| 2007 | 2353 | 1814 | 0.77 | 79.08 | 0.91 | 0.2 |
| 2008 | 2671 | 1810 | 0.68 | 78.75 | 1.18 | 0.17 |
| 2009 | 2532 | 1720 | 0.68 | 83.11 | 0.92 | 0.19 |
| 2010 | 2721 | 1692 | 0.62 | 80.19 | 0.91 | 0.28 |
| 2011 | 2804 | 2073 | 0.74 | 78.62 | 0.98 | 0.16 |
| 2012 | 3005 | 2091 | 0.70 | 81.84 | 0.87 | 0.21 |
| Total | 24,705 | 17,287 | 0.70 | 74.43 | 1.21 | 0.23 |
M/I: Mortality to incidence ratio; MV%: Proportion of morphological verification; DCO%: Percentage of cancer case identified with death certification only; O and U%: Percentage of cancer with undefined or unknown primary site.
Statistical analysis
Cancers were classified according to the ICD-X.[12] The qualified data were assessed based on the “guideline of Chinese cancer registration” and referred to the criteria listed under the “cancer incidence in five continents volume” outlined by IACR. The data were stratified by years, gender, and age (age groups as shown in the Table 3), and crude incidence/mortality rates were calculated. Age-standardized incidence rates (ASIRs) were calculated according to the 1982 Chinese population. In addition, the world Segi's population was also calculated. MS Excel 2010 (Microsoft Corporation, USA), SAS 9.2 (SAS Institute Inc, USA), and CanReg4 (IARC, France) were used for data analysis.[13] We calculated the ASIR and then analyzed gender, age, and site-specific trends among these standardized rates. In addition, we estimated the average annual percent change (EAPC) to assess trends with regard to changes in cancer incidence/mortality rates over time.[14] The EAPC calculation included the independent variable, years, and a logarithmic transformation on the incidence/mortality rates. We fit the EAPC to a straight line, Y = b + aX and Y = Ln (incidence/mortality rate), where X represents the year. With the final equation being EAPC = (10a− 1) ×100%. Finally, we performed a hypothesis-based test for the EAPC, in which the EAPC was tested for accidental variation. The results from this test explained any observed annual variation/stability trends.[15]
Table 3.
Gender- and age-specific incidence characteristics of all cancer cases registered in Wuwei during 2003–2012
| Age groups (years) | Cumulative population | Age-specific incidence rate (1/105) | Male | Female | ||||
|---|---|---|---|---|---|---|---|---|
| Population | Incidence cases | Incidence rate (1/105) | Population | Incidence cases | Incidence rate (1/105) | |||
| 0–0.9 | 79,609 | 0.00 | 42,374 | 0 | 0.00 | 37,235 | 0 | 0.00 |
| 1.0–4.9 | 343,658 | 1.12 | 192,922 | 0 | 0.00 | 150,736 | 4 | 2.56 |
| 5.0–9.9 | 508,743 | 0.00 | 307,010 | 0 | 0.00 | 201,733 | 0 | 0.00 |
| 10.0–14.9 | 809,074 | 0.55 | 470,108 | 4 | 0.95 | 338,966 | 0 | 0.00 |
| 15.0–19.9 | 996,442 | 2.06 | 530,213 | 9 | 1.68 | 466,229 | 12 | 2.48 |
| 20.0–24.9 | 947,340 | 4.09 | 470,148 | 16 | 3.32 | 477,192 | 23 | 4.85 |
| 25.0–29.9 | 701,556 | 8.94 | 369,277 | 36 | 9.67 | 332,279 | 27 | 8.12 |
| 30.0–34.9 | 701,119 | 34.33 | 363,383 | 125 | 34.41 | 337,736 | 116 | 34.24 |
| 35.0–39.9 | 1,154,848 | 45.53 | 581,725 | 237 | 40.69 | 573,123 | 289 | 50.45 |
| 40.0–44.9 | 1,062,112 | 127.71 | 521,988 | 701 | 134.31 | 540,124 | 655 | 121.34 |
| 45.0–49.9 | 565,215 | 342.62 | 272,592 | 1123 | 412.01 | 292,623 | 813 | 277.98 |
| 50.0–54.9 | 614,585 | 541.78 | 313,697 | 2219 | 707.50 | 300,888 | 1110 | 369.00 |
| 55.0–59.9 | 433,379 | 949.97 | 219,691 | 2818 | 1282.62 | 213,688 | 1299 | 607.97 |
| 60.0–64.9 | 341,773 | 1330.29 | 163,624 | 2985 | 1824.46 | 178,149 | 1561 | 876.41 |
| 65.0–69.9 | 255,527 | 1445.78 | 130,626 | 2434 | 1863.15 | 124,901 | 1261 | 1009.29 |
| 70.0–74.9 | 194,420 | 1603.94 | 95,791 | 2027 | 2116.47 | 98,629 | 1091 | 1106.15 |
| 75.0–79.9 | 87,100 | 1399.25 | 44,666 | 822 | 1839.59 | 42,434 | 397 | 935.74 |
| 80.0–84.9 | 28,206 | 1427.55 | 14,654 | 252 | 1721.76 | 13,552 | 150 | 1109.42 |
| 85.0 or older | 12,034 | 730.28 | 5853 | 65 | 1106.29 | 6181 | 23 | 374.22 |
| Total | 9,836,740 | 251.15 | 5,110,342 | 15,873 | 310.61 | 4,726,398 | 8832 | 186.87 |
RESULTS
Gender- and age-specific incidence/mortality characteristics
Between 2003 and 2012, a total of 24,705 cancer incidence cases and 17,287 mortality cases were reported to the Wuwei Cancer Registry, with 65.54% being male. The mean age at diagnosis was 58.2 years, and the mean age of male and female patients were 59.9 and 56.4 years, respectively. More than half of the cancers were diagnosed on the basis of histopathology findings, with 1.18% of diagnosis was obtained from death certificates [Table 2]. From 2003 to 2012 in Wuwei, the cancer incidence and mortality were relatively low for individuals <44.9 years old, but increased dramatically for individuals >45.0 years. Incidence was highest for individuals from 55.0–69.9 years and decreased for ages >80.0 years. The incidence rate in the males was higher than females in the age group >40.0 years. The disparity of incidence rates between males and the females was striking in the age group >45.0 years [Tables 3 and 4].
Table 4.
Gender– and age–specific mortality characteristics of all cancer cases registered in Wuwei during 2003–2012
| Age groups | Cumulative population | Age-specific mortality rate (1/105) | Male | Female | ||||
|---|---|---|---|---|---|---|---|---|
| Population | Mortality cases | Mortality rate (1/105) | Population | Mortality cases | Mortality rate (1/105) | |||
| 0–0.9 | 79,609 | 0.00 | 42,374 | 0 | 0.00 | 37,235 | 0 | 0.00 |
| 1.0–4.9 | 343,658 | 0.00 | 192,922 | 0 | 0.00 | 150,736 | 0 | 0.00 |
| 5.0–9.9 | 508,743 | 0.00 | 307,010 | 0 | 0.00 | 201,733 | 0 | 0.00 |
| 10.0–14.9 | 809,074 | 0.29 | 470,108 | 2 | 0.50 | 338,966 | 0 | 0.00 |
| 15.0–19.9 | 996,442 | 0.73 | 530,213 | 0 | 0.00 | 466,229 | 7 | 1.55 |
| 20.0–24.9 | 947,340 | 1.01 | 470,148 | 2 | 0.50 | 477,192 | 7 | 1.52 |
| 25.0–29.9 | 701,556 | 3.40 | 369,277 | 9 | 2.54 | 332,279 | 14 | 4.35 |
| 30.0–34.9 | 701,119 | 10.00 | 363,383 | 38 | 10.33 | 337,736 | 33 | 9.64 |
| 35.0–39.9 | 1,154,848 | 22.13 | 581,725 | 129 | 22.17 | 573,123 | 127 | 22.09 |
| 40.0–44.9 | 1,062,112 | 56.21 | 521,988 | 293 | 56.16 | 540,124 | 304 | 56.26 |
| 45.0–49.9 | 565,215 | 163.46 | 272,592 | 544 | 199.59 | 292,623 | 380 | 129.80 |
| 50.0–54.9 | 614,585 | 265.08 | 313,697 | 1144 | 364.81 | 300,888 | 485 | 161.11 |
| 55.0–59.9 | 433,379 | 554.51 | 219,691 | 1745 | 794.17 | 213,688 | 658 | 308.11 |
| 60.0–64.9 | 341,773 | 848.52 | 163,624 | 1996 | 1219.65 | 178,149 | 904 | 507.65 |
| 65.0–69.9 | 255,527 | 1177.99 | 130,626 | 1899 | 1454.15 | 124,901 | 1111 | 889.17 |
| 70.0–74.9 | 194,420 | 1461.37 | 95,791 | 1944 | 2029.47 | 98,629 | 897 | 909.61 |
| 75.0–79.9 | 87,100 | 2118.35 | 44,666 | 1353 | 3029.37 | 42,434 | 492 | 1159.41 |
| 80.0–84.9 | 28,206 | 1928.78 | 14,654 | 417 | 2848.51 | 13,552 | 127 | 934.28 |
| 85.0 or older | 12,034 | 1867.87 | 5853 | 152 | 2604.28 | 6181 | 72 | 1170.53 |
| Total | 9,836,740 | 175.74 | 5,110,342 | 11,669 | 228.34 | 4,726,398 | 5618 | 118.86 |
Incidence and mortality rates
The crude incidence of all cancers in the registry was 251.15/100,000 persons (310.61 and 186.87 in males and females per 100,000 persons). The age-standardized rates by Chinese standard population (ASR-China) and age-standardized rates by world standard population (ASR-world) was 207.76 and 245.42/100,000 persons, respectively. Among the patients aged 0–74.9 years, the cumulative incidence was 32.22%. The crude mortality among the cancer cases in the registry was 175.74/100,000 persons (228.34 and 118.86 in males and females, respectively). The ASR-China and ASR-world were 149.57 and 175.13/100,000, respectively. The cumulative mortality (0–74.9 years) was 20.59% [Table 5].
Table 5.
The incidence and mortality rates of cancers (ICD-10:C00–C97) registered in Wuwei during 2003–2012
| Gender | Cases number | Crude rate (1/105) | ASR-China (1/105) | ASR-world (1/105) | Cumulative rate 0–74.9 years (%) |
|---|---|---|---|---|---|
| Incidence | |||||
| Both genders | 24,705 | 251.15 | 207.76 | 245.42 | 32.22 |
| Male | 15,873 | 310.61 | 248.30 | 308.91 | 41.00 |
| Female | 8832 | 186.87 | 169.52 | 184.85 | 23.77 |
| Mortality | |||||
| Both genders | 17,287 | 175.74 | 149.57 | 175.13 | 20.59 |
| Male | 11,669 | 228.34 | 185.09 | 230.31 | 26.40 |
| Female | 5618 | 118.86 | 115.22 | 121.95 | 15.38 |
ASR-China: Age-standardized rate for the incidence/mortality based on the Chinese standard population; ASR-world: Age-standardized rate for the incidence/mortality based on the world standard population; cumulative rate refers to the rate for all patients aged 0–74.9 years. ICD: International Classification of Diseases.
Gender and age distribution of major cancers
Table 6 shows the age distribution of major cancers in Wuwei between 2003 and 2012. Over the same period, cancer incidence and mortality were observed primarily in the age group of 45.0–64.9 years (>50%), followed by the age group >65.0 years (~30%). Similarly, for some of the major cancers that caused morbidity and mortality including liver, lung, gastric, and nasopharyngeal cancers, the age at morbidity and mortality was observed at higher age. Leukemia, which occurs more often in teenagers, peaked in the age group of 0–44.9 years. Data also suggested that in the age group of 0–44.9 years, the cancer incidence and mortality in males was lower than that in females. With increasing age, the incidence and mortality for males and females significantly increased in the age groups of 45.0–64.9 years.
Table 6.
Constituent ratio of age distribution of major cancers in Wuwei during 2003–2012
| ICD | 0–44.9 years (%) | 45.0–64.9 years (%) | 65.0 years or older (%) | Total (%) | ||||
|---|---|---|---|---|---|---|---|---|
| Male | Female | Male | Female | Male | Female | Male | Female | |
| Incidence (2003–2012) | ||||||||
| Stomach, C16 | 6.78 | 12.22 | 57.72 | 54.16 | 35.50 | 33.62 | 100.00 | 100.00 |
| Esophagus, C15 | 3.41 | 5.16 | 55.49 | 52.67 | 41.10 | 42.17 | 100.00 | 100.00 |
| Liver, C22 | 18.14 | 17.83 | 54.21 | 48.97 | 27.65 | 33.2 | 100.00 | 100.00 |
| Lung, C33–C34 | 6.52 | 13.71 | 46.99 | 50.61 | 46.49 | 35.68 | 100.00 | 100.00 |
| Colon, rectum, C18–C21 | 12.49 | 15.95 | 47.89 | 54.42 | 39.62 | 29.63 | 100.00 | 100.00 |
| Breast, C50 | – | 35.47 | – | 55.31 | – | 9.22 | – | 100.00 |
| Lymphoma, C77 | 30.29 | 36.34 | 47.89 | 47.77 | 21.82 | 15.89 | 100.00 | 100.00 |
| Leukemia, C42 | 55.01 | 47.33 | 30.68 | 37.39 | 14.31 | 15.28 | 100.00 | 100.00 |
| Cervix, C53 | – | 31.35 | – | 55.75 | – | 12.90 | – | 100.00 |
| Nervous system, C70–C72 | 37.42 | 40.67 | 41.71 | 42.24 | 20.87 | 17.09 | 100.00 | 100.00 |
| All cancers | 9.87 | 18.30 | 53.61 | 54.58 | 36.52 | 27.12 | 100.00 | 100.00 |
| Mortality (2003–2012) | ||||||||
| Stomach, C16 | 6.09 | 11.11 | 55.34 | 50.56 | 38.57 | 38.33 | 100.00 | 100.00 |
| Esophagus, C15 | 2.77 | 3.82 | 55.22 | 53.55 | 42.01 | 42.63 | 100.00 | 100.00 |
| Liver, C22 | 17.95 | 19.93 | 53.38 | 48.03 | 28.67 | 32.04 | 100.00 | 100.00 |
| Lung, C33–C34 | 6.40 | 13.44 | 46.58 | 46.50 | 47.02 | 40.06 | 100.00 | 100.00 |
| Colon, rectum, C18–C21 | 12.00 | 17.38 | 45.33 | 49.50 | 42.67 | 33.12 | 100.00 | 100.00 |
| Breast, C50 | – | 36.56 | – | 51.45 | – | 11.99 | – | 100.00 |
| Lymphoma, C77 | 31.98 | 39.36 | 47.15 | 45.01 | 20.87 | 15.63 | 100.00 | 100.00 |
| Leukemia, C42 | 64.37 | 53.08 | 19.49 | 34.96 | 16.14 | 11.96 | 100.00 | 100.00 |
| Cervix, C53 | – | 31.36 | – | 49.29 | – | 19.35 | – | 100.00 |
| Nervous system, C70–C72 | 40.39 | 50.55 | 35.23 | 30.59 | 24.38 | 18.86 | 100.00 | 100.00 |
| All cancers | 9.70 | 19.48 | 51.85 | 49.07 | 38.45 | 31.45 | 100.00 | 100.00 |
ICD: International Classification of Diseases.
Incidence and mortality of major cancers
The ten most common cancers accounted for 85.45% of all cancer incidences. In term of cancer sites, the stomach was the leading site, followed by the esophagus, liver, lung, colorectum, breast, cervix, blood (e.g., lymphoma and leukemia), brain, and central nervous system. For males, stomach cancer was the most common cancer followed by cancers of the esophagus, liver, lung, colorectum, lymphoma, bladder, brain and central nervous system, blood (leukemia), and kidney. The ten most common cancers in males accounted for 90.97% of all cancers. For females, stomach cancer was the most common cancer followed by cancers of the esophagus, lung, breast, liver, colorectum, cervix, uterus, blood (leukemia), and lymphoma. The ten most common cancers in females accounted for 77.90% of all cancers [Table 7, Figures 1 and 2].
Table 7.
Incidence of the top 10 cancers in Wuwei, 2003–2012
| Rank | Both genders | Male | Female | |||||||||
|---|---|---|---|---|---|---|---|---|---|---|---|---|
| Site | Number | Incidence (1/105) | Proportion (%) | Site | Number | Incidence (1/105) | Proportion (%) | Site | Number | Incidence (1/105) | Proportion (%) | |
| 1 | Stomach | 9400 | 95.56 | 35.28 | Stomach | 7109 | 139.11 | 41.53 | Stomach | 2291 | 48.47 | 24.05 |
| 2 | Esophagus | 4486 | 45.60 | 16.84 | Esophagus | 3391 | 66.35 | 19.81 | Esophagus | 1095 | 23.17 | 11.50 |
| 3 | Liver | 2680 | 27.24 | 10.06 | Liver | 1954 | 38.23 | 11.41 | Lung | 836 | 17.68 | 8.77 |
| 4 | Lung | 2392 | 24.32 | 8.98 | Lung | 1556 | 30.44 | 9.09 | Breast | 827 | 17.50 | 8.68 |
| 5 | Colorectum | 1438 | 14.62 | 5.40 | Colorectum | 773 | 15.13 | 4.52 | Liver | 726 | 15.37 | 7.63 |
| 6 | Breast | 827 | 8.41 | 3.10 | Lymphoma | 255 | 4.99 | 1.49 | Colorectum | 665 | 14.06 | 6.98 |
| 7 | Cervix | 413 | 4.20 | 1.55 | Bladder | 205 | 4.01 | 1.20 | Cervix | 413 | 8.74 | 4.34 |
| 8 | Lymphoma | 402 | 4.09 | 1.51 | Nervous system | 203 | 3.98 | 1.19 | Uterus | 220 | 4.66 | 2.31 |
| 9 | Leukemia | 378 | 3.84 | 1.42 | Leukemia | 179 | 3.51 | 1.05 | Leukemia | 199 | 4.20 | 2.08 |
| 10 | Nervous system | 349 | 3.55 | 1.31 | Kidney | 147 | 2.88 | 0.86 | Lymphoma | 147 | 3.11 | 1.54 |
| Total | 22,765 | 231.43 | 85.45 | 15,772 | 304.72 | 90.97 | 7419 | 156.97 | 77.90 | |||
Figure 1.

Incidence of the commonest cancers. (a) Both genders. (b) Male. (c) Female.
Figure 2.
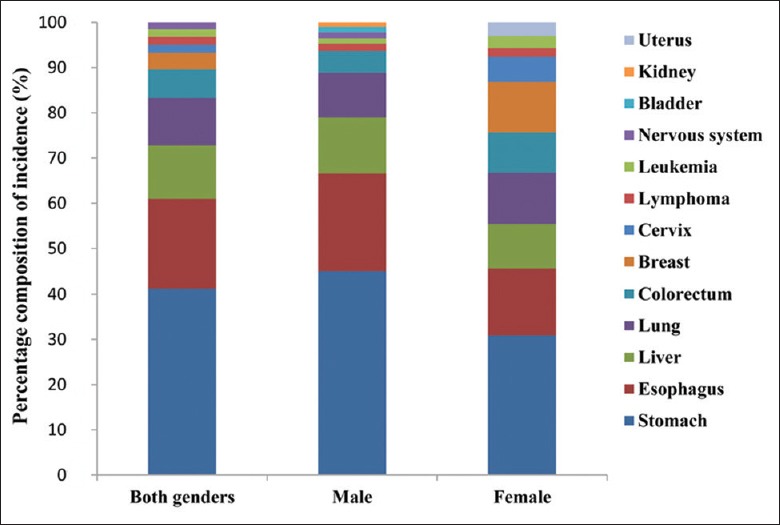
The proportion of the commonest cancers incidence.
With regard to mortality, the ten most common cancers accounted for 89.82% of all cancer-related deaths. In term of cancers sites, the stomach was the leading site, followed by the esophagus, liver, lung, colorectum, breast, cervix, blood (e.g., lymphoma and leukemia), brain, and central nervous system. For males, stomach cancer was the most common cancer followed by cancers of the liver, esophagus, lung, colorectum, brain, central nervous system, bone, blood (leukemia), bladder, and lymphoma. The ten most common cancers in males accounted for 95.68% of all cancers. For females, stomach cancer was the most common cancer followed by cancers of the esophagus, lung, liver, breast, cervix, uterus, unspecified, ovary, colorectum, brain, and central nervous system. The ten most common cancers in females accounted for 85.70% of all cancers [Table 8, Figures 3 and 4].
Table 8.
Mortality of the top 10 cancers in Wuwei, 2003–2012
| Rank | Both genders | Male | Female | |||||||||
|---|---|---|---|---|---|---|---|---|---|---|---|---|
| Site | Number | Mortality (1/105) | Proportion (%) | Site | Number | Mortality (1/105) | Proportion (%) | Site | Number | Mortality (1/105) | Proportion (%) | |
| 1 | Stomach | 6753 | 68.65 | 38.35 | Stomach | 5200 | 101.75 | 43.76 | Stomach | 1553 | 32.86 | 27.12 |
| 2 | Esophagus | 2732 | 27.77 | 15.52 | Liver | 2072 | 40.55 | 17.44 | Esophagus | 751 | 15.89 | 13.12 |
| 3 | Liver | 2701 | 27.46 | 15.34 | Esophagus | 1981 | 38.76 | 16.67 | Lung | 688 | 14.56 | 12.02 |
| 4 | Lung | 1872 | 19.03 | 10.63 | Lung | 1184 | 23.17 | 9.97 | Liver | 629 | 13.30 | 10.98 |
| 5 | Colorectum | 433 | 4.40 | 2.46 | Colorectum | 323 | 6.33 | 2.72 | Breast | 389 | 8.24 | 6.80 |
| 6 | Breast | 389 | 3.95 | 2.21 | Nervous system | 174 | 3.40 | 1.46 | Cervix | 311 | 6.59 | 5.44 |
| 7 | Cervix | 311 | 3.16 | 1.77 | Bone | 115 | 2.26 | 0.97 | Uterus | 250 | 5.28 | 4.36 |
| 8 | Nervous system | 260 | 2.64 | 1.48 | Leukemia | 109 | 2.14 | 0.92 | Ovary | 140 | 2.97 | 2.45 |
| 9 | Uterus | 250 | 2.54 | 1.42 | Bladder | 107 | 2.09 | 0.90 | Colorectum | 110 | 2.33 | 1.92 |
| 10 | Bone | 115 | 1.17 | 0.65 | Lymphoma | 103 | 2.01 | 0.86 | Nervous system | 86 | 1.81 | 1.49 |
| Total | 15,816 | 160.78 | 89.82 | 11,368 | 222.46 | 95.68 | 4907 | 103.83 | 85.70 | |||
Figure 3.

Mortality of the commonest cancers. (a) Both genders. (b) Male. (c) Female.
Figure 4.
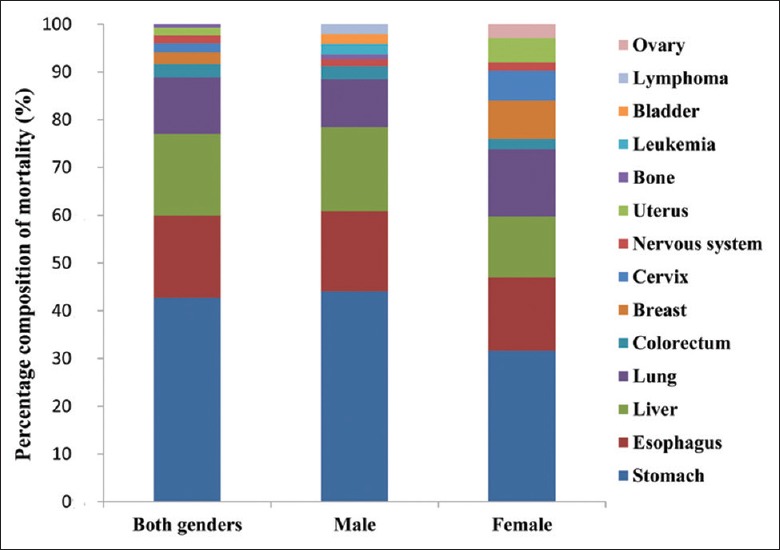
The proportion of the most common cancers mortality.
Analysis of cancer trends in Wuwei, 2003–2012
The EAPC (%) [Table 9, Figures 5 and 6] estimated the value reflecting the trends associated with changes in cancer incidence and mortality rates in Wuwei from 2003 to 2012. We calculated trends with regard to changes over time of all malignant tumor incidence and mortality rates, as well as five kinds of cancers including gastric, esophageal, liver, lung, and colorectum cancers, which are the biggest threat to local residents’ health. Results showed that during 2003 and 2012, malignant tumor incidence and mortality rates increased 1.32% and 1.31%/year, respectively, in Wuwei. During this decade, colorectum cancer incidence and mortality rates increased by 2.69% and 7.54%/year, respectively. In addition, the incidence and mortality rates for several cancers including gastric, esophageal, liver, and lung cancers all increased.
Table 9.
Trend change analysis of cancers incidence/mortality rates in Wuwei, EAPC estimate (2003–2012)
| Groups | 2003 | 2004 | 2005 | 2006 | 2007 | 2008 | 2009 | 2010 | 2011 | 2012 | EAPC (%) | P |
|---|---|---|---|---|---|---|---|---|---|---|---|---|
| Incidence (1/105) | ||||||||||||
| All cancers | 209.79 | 241.59 | 236.31 | 221.74 | 238.54 | 269.41 | 252.61 | 268.69 | 271.31 | 294.53 | 1.32 | 0.001 |
| Stomach | 84.41 | 92.87 | 90.63 | 102.46 | 96.31 | 103.99 | 89.49 | 98.35 | 98.79 | 97.23 | 0.47 | 0.135 |
| Esophagus | 48.71 | 38.99 | 42.3 | 49.7 | 44.78 | 41.87 | 46.69 | 45.61 | 50.91 | 46.07 | 0.39 | 0.354 |
| Liver | 26.12 | 23.28 | 22.65 | 29.38 | 27.12 | 29.57 | 32.37 | 26.71 | 30.83 | 23.92 | 0.63 | 0.312 |
| Lung | 24.30 | 22.89 | 23.69 | 22.13 | 25.91 | 24.08 | 23.65 | 25.77 | 26.99 | 23.52 | 0.37 | 0.222 |
| Colorectum | 11.34 | 16.40 | 11.07 | 10.85 | 13.01 | 14.97 | 19.48 | 18.66 | 15.43 | 22.45 | 2.69 | 0.015 |
| Mortality (1/105) | ||||||||||||
| All cancers | 153.87 | 141.59 | 159.47 | 186.59 | 183.90 | 182.56 | 171.60 | 167.08 | 200.58 | 204.95 | 1.31 | 0.008 |
| Stomach | 63.44 | 57.45 | 63.68 | 69.68 | 71.61 | 74.44 | 61.99 | 64.68 | 72.01 | 63.51 | 0.36 | 0.390 |
| Esophagus | 25.27 | 26.28 | 25.38 | 30.23 | 29.17 | 24.03 | 24.12 | 30.42 | 33.69 | 28.55 | 0.76 | 0.177 |
| Liver | 25.16 | 25.98 | 29.91 | 26.57 | 27.46 | 20.37 | 22.25 | 32.16 | 33.86 | 30.29 | 0.80 | 0.319 |
| Lung | 15.91 | 20.33 | 19.21 | 14.99 | 16.32 | 18.89 | 24.96 | 19.87 | 18.01 | 21.47 | 0.97 | 0.197 |
| Colorectum | 1.18 | 3.00 | 2.66 | 2.86 | 4.33 | 3.23 | 5.29 | 4.79 | 6.17 | 9.90 | 7.54 | 0.000 |
EAPC: Estimated the average annual percent change.
Figure 5.
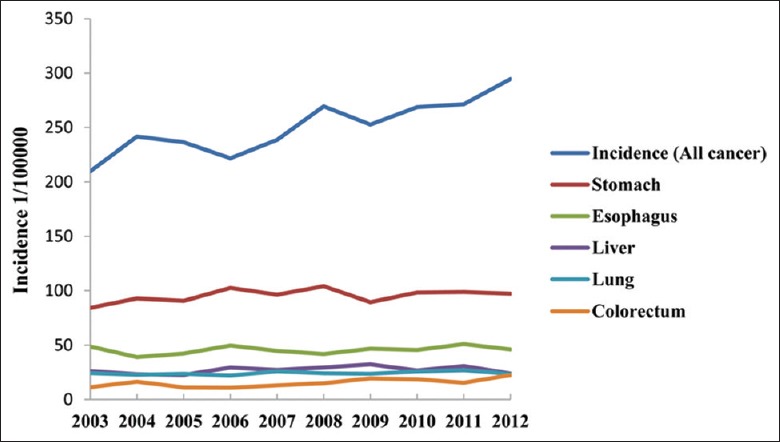
Time trends change of cancers incidence rate in Wuwei during 2003–2012.
Figure 6.
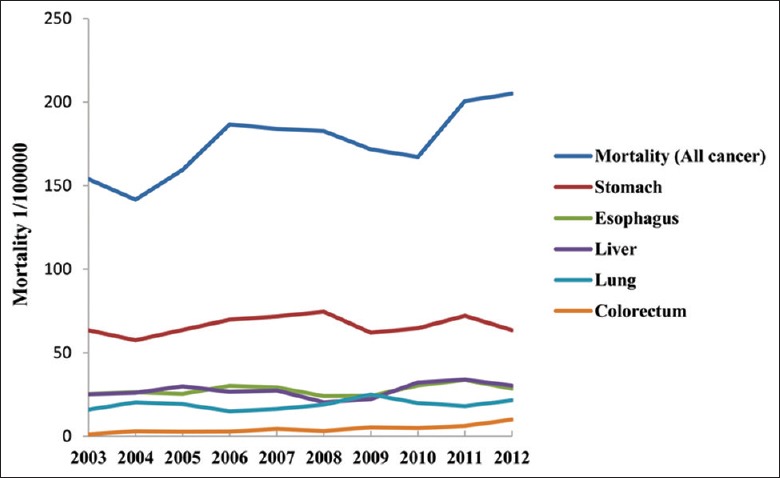
Time trends change of cancers mortality rate in Wuwei during 2003–2012.
DISCUSSION
The systematic analysis explored the population-based cancer incidence and mortality in Wuwei between 2003 and 2012, with a standardized protocol for data collection, quality control, and analysis. Although the population covered was approximately 3% of the Gansu province population, this still represents a base population of 1 million people. Reliable information on cancer incidence and mortality in this area is critical for understanding the effectiveness of diagnosis and treatment management for cancer, which is necessary information for health care planners and professionals. In this study, person-year was calculated, which represent survival time composite unit, and it is the sum of product of people number and survival years. From 2003 to 2012, person-years were 9,836,740 (5,110,342 and 4,726,398 male and female, respectively) in Wuwei, and the gender ratio of male/female was 1.08:1. In our data analyses, we found that the gender- and age-specific incidence and mortality was relatively low in the age group of 0–44.9 years and was dramatically increased in ages >20.0 years. Incidence and mortality reached a peak in the age groups of 55.0–64.9 years. The increase in age-specific incidence and mortality of males was similar to that observed for females. The male cancer incidence and mortality were 17,117 and 11,882, respectively, and the female incidence and mortality cancers cases were 9524 and 5726, respectively. The approximate age for females and males who had the highest incidence of cancer was 64 years. This was found to be related to lifestyle, environmental pollution, population, and aging. The reasons for the high incidence and mortality in males were due to their habits including smoking and drinking. The population epidemiological survey showed that Wuwei males liked to drink and therefore, gastric, esophageal, and other malignant cancers of the digestive system were common.[16,17]
During 2003–2012 there were 24,705 new cancers (15,873 and 8832 male and female, respectively) according to the Wuwei cancer registries. Among all new cases, the proportion of males and females were 64.25% and 35.75%, respectively. In 2009, the national average incidence of cancer was 195.67/100,000 persons,[18] and Wuwei was 44.85% higher than the national average. There were 17,287 cancer-related deaths (11,669 and 5618 male and female, respectively) between 2003 and 2012, and the proportion of male and female deaths were 67.48% and 32.52%, respectively. In 2008, the national average incidence of cancer was 140.88/100,000 persons,[18] and Wuwei was 25.91% higher than the national average. There were high incidence and mortality cases of cancer among the age groups of 45.0–64.9 years, with more men than women. The main cancers among the age group under 45.0 years old included non-Hodgkin's lymphoma, Hodgkin's disease, and leukemia. Older individuals were more likely to suffer from lung, liver, nasopharyngeal carcinoma, gastric, breast, colon, skin, and bone cancers. The occurrence of cancer is associated with decreased immunity.[19] This data suggest that local residents should pay attention to their diet and exercise, form good habits, and stop drinking alcohol, and the incidence and mortality of cancer will likely decrease.
The incidence of the ten most common cancers was different between Wuwei and China national cancer registries.[18,20] Gastric and esophageal cancers were ranked first and second, respectively, in Wuwei, but the most common cancers in national cancer registration areas were lung and liver cancers. The standardized incidence of gastric and esophageal cancers in Wuwei was much higher than the national average level. Digestive system tumors, especially gastric cancers, were still the main cause of male and female malignant tumor death in Wuwei. The reasons may be due to multiple reasons including local diet habits, diet structure, and environmental factors. For one thing, Wuwei is located in Northwestern China, which is a less developed area, and the gaps exist in the diet structure and lifestyle compared to developed areas. Zhou et al.[17] found that the local residents consume less fresh vegetables, but more marinated or pickled foods. In addition, recent years, a national upper gastrointestinal tract cancer screening project was implemented in this area, and the results showed that chronic gastritis and gastric ulcer were higher in local residents. These factors combined have probably led to the high incidence of stomach and esophageal cancers in this region. Increased cancer incidence and mortality in males were also observed in this study, especially stomach, esophageal, liver, and lung cancers. Similar data have been reported in other countries.[21] It is not very clear what has caused the increase in incidence and mortality in males and the sites associated with cancer. In a recent study, they showed that genetic predisposition, smoking, and alcohol consumption are very common in males of this region and that all of these factors have been associated with the development of stomach, esophageal, liver, and lung cancers.[22,23,24] In addition, we used an estimated EAPC to assess the trends in cancer incidence and mortality rates over time.[15] Results showed that during 2003–2012, cancer incidence and mortality rates increased. In addition, we observed a steady increase in the incidence and mortality of all cancers, except colorectum cancer, which significantly increased. The recent epidemiological survey showed that baked, pickled, and increased intake of meat can lead to colorectum cancer.[25,26] All cancers appeared to be associated with aging, diet structure, and environmental factors. In addition, high cancer incidence was also associated with the development of medicine and early diagnosis.[27,28,29]
In summary, results from our study showed that (1) the incidence of stomach and esophageal cancers is high in Wuwei, (2) the main carcinoma tends to occur in elderly and is more common in males, and (3) colorectal cancer significantly increased from 2003 to 2012. In addition, the increased burden of tumors and other environmentally-related health problems have become a regional public health issue.[30] Our study showed that gastric, esophageal, and other digestive system tumors are the main cancers threating Wuwei residents. Based on these results, the local government should provide the following: (1) health education, (2) healthy living environments, and (3) screening of chronic diseases. Future population-based epidemiological studies should be conducted to further study the trends associated with cancers and to elucidate the potential risk factors for digestive system cancers in this high endemic region.
Financial support and sponsorship
Nil.
Conflicts of interest
There are no conflicts of interest.
Footnotes
Edited by: Li-Shao Guo
REFERENCES
- 1.Torre LA, Bray F, Siegel RL, Ferlay J, Lortet-Tieulent J, Jemal A. Global cancer statistics 2012. CA Cancer J Clin. 2015;65:87–108. doi: 10.3322/caac.21262. doi:10.3322/caac.21262. [DOI] [PubMed] [Google Scholar]
- 2.Jemal A, Bray F, Center MM, Ferlay J, Ward E, Forman D. Global cancer statistics. CA Cancer J Clin. 2011;61:69–90. doi: 10.3322/caac.20107. doi:10.3322/caac.20107. [DOI] [PubMed] [Google Scholar]
- 3.He Y, Wu Y, Song G, Li Y, Liang D, Jin J, et al. Incidence and mortality rate of esophageal cancer has decreased during past 40 years in Hebei Province, China (in Chinese) Chin J Cancer Res. 2015;27:562–71. doi: 10.3978/j.issn.1000-9604.2015.10.06. doi:10.3978/j.issn.1000-9604.2015.10.06. [DOI] [PMC free article] [PubMed] [Google Scholar]
- 4.Guo Y, Shan Z, Ren H, Chen W. Dairy consumption and gastric cancer risk: A meta-analysis of epidemiological studies. Nutr Cancer. 2015;67:555–68. doi: 10.1080/01635581.2015.1019634. doi:10.1080/01635581.2015.1019634. [DOI] [PubMed] [Google Scholar]
- 5.Krishnatreya M. Epidemiological research on cancers by cancer registries: A view point. South Asian J Cancer. 2015;4:50. doi: 10.4103/2278-330X.149957. doi:10.4103/2278-330X.149957. [DOI] [PMC free article] [PubMed] [Google Scholar]
- 6.Pedersen E. Some uses of the cancer registry in cancer control. Br J Prev Soc Med. 1962;16:105–110. doi: 10.1136/jech.16.2.105. [DOI] [PMC free article] [PubMed] [Google Scholar]
- 7.Bai LY, Zeng XB, Su SM, Duan R, Wang YN, Gao X. Heavy metal accumulation and source analysis in greenhouse soils of Wuwei district, Gansu province, China. Environ Sci Pollut Res Int. 2015;22:5359–69. doi: 10.1007/s11356-014-3763-1. doi:10.1007/s11356-014-3763-1. [DOI] [PubMed] [Google Scholar]
- 8.Luo HZ, Mi DH, Jing TZ, Xu Q, Yang WS, Yang GQ, et al. Risk factors of gastric cancer in Wuwei City---an endemic region of gastric cancer (in Chinese) Chin J Cancer. 2005;24:563–6. [PubMed] [Google Scholar]
- 9.Parkin DM. The evolution of the population-based cancer registry. Nat Rev Cancer. 2006;6:603–12. doi: 10.1038/nrc1948. doi:10.1038/nrc1948. [DOI] [PubMed] [Google Scholar]
- 10.Bray F, Ferlay J, Laversanne M, Brewster DH, Gombe MC, Kohler B, et al. Cancer Incidence in Five Continents: Inclusion criteria, highlights from Volume X and the global status of cancer registration. Int J Cancer. 2015;137:2060–71. doi: 10.1002/ijc.29670. doi:10.1002/ijc.29670. [DOI] [PubMed] [Google Scholar]
- 11.Matsuda T, Matsuda A. Burden of cancer incidence below the age of 40 in Asia 2002 extrapolated from the Cancer Incidence in Five Continents Vol. IX. Jpn J Clin Oncol. 2013;43:449–450. doi: 10.1093/jjco/hyt045. doi:10.1093/jjco/hyt045. [DOI] [PubMed] [Google Scholar]
- 12.Bielby JA, Comfort A, Reed A, Wiedemann LA. Clinical documentation guidance for ICD-10-CM/PCS. J AHIMA. 2014;85:52–5. [PubMed] [Google Scholar]
- 13.Rosso S, Zanetti R. Quality of information and cancer care planning in China: A commentary to the report of cancer incidence and mortality in China. Ann Transl Med. 2014;2:66. doi: 10.3978/j.issn.2305-5839.2014.06.08. doi:10.3978/j.issn.2305-5839.2014.06.08. [DOI] [PMC free article] [PubMed] [Google Scholar]
- 14.Stat bite: Annual percent change in death rates for selected cancers 1992-2002. J Natl Cancer Inst. 2005;97:1567. doi: 10.1093/jnci/dji397. doi:10.1093/jnci/dji397. [DOI] [PubMed] [Google Scholar]
- 15.Fay MP, Tiwari RC, Feuer EJ, Zou Z. Estimating average annual percent change for disease rates without assuming constant change. Biometrics. 2006;62:847–54. doi: 10.1111/j.1541-0420.2006.00528.x. doi:10.1111/j.1541-0420.2006.00528.x. [DOI] [PubMed] [Google Scholar]
- 16.Jing JJ, Liu HY, Hao JK, Wang LN, Wang YP, Sun LH, et al. Gastric cancer incidence and mortality in Zhuanghe, China, between 2005 and 2010. World J Gastroenterol. 2012;18:1262–9. doi: 10.3748/wjg.v18.i11.1262. doi:10.3748/wjg.v18.i11.1262. [DOI] [PMC free article] [PubMed] [Google Scholar]
- 17.Zhou Y, Zhang Z, Zhang Z, Wu J, Ren D, Yan X, et al. A rising trend of gastric cardia cancer in Gansu province of China. Cancer Lett. 2008;269:18–25. doi: 10.1016/j.canlet.2008.04.013. doi:10.1016/j.canlet.2008.04.013. [DOI] [PubMed] [Google Scholar]
- 18.Chen W, Zheng R, Zeng H, Zhang S. The updated incidences and mortalities of major cancers in China, 2011 (in Chinese) Chin J Cancer. 2015;34:53. doi: 10.1186/s40880-015-0042-6. doi:10.1186/s40880-015-0042-6. [DOI] [PMC free article] [PubMed] [Google Scholar]
- 19.Zheng R, Zeng H, Zhang S, Chen T, Chen W. National estimates of cancer prevalence in China 2011. Cancer Letters. 2016;370:33–8. doi: 10.1016/j.canlet.2015.10.003. doi:10.1016/j.canlet.2015.10.003. [DOI] [PubMed] [Google Scholar]
- 20.Chen W, Zheng R, Zhang S, Zhao P, Li G, Wu L, et al. The incidences and mortalities of major cancers in China, 2009 (in Chinese) Chin J Cancer. 2013;32:106–12. doi: 10.5732/cjc.013.10018. doi:10.5732/cjc.013.10018. [DOI] [PMC free article] [PubMed] [Google Scholar]
- 21.Tsugane S, Sasazuki S, Kobayashi M, Sasaki S. Salt and salted food intake and subsequent risk of gastric cancer among middle-aged Japanese men and women. Br J Cancer. 2004;90:128–34. doi: 10.1038/sj.bjc.6601511. doi:10.1038/sj.bjc.6601511. [DOI] [PMC free article] [PubMed] [Google Scholar]
- 22.Mi DH, Chen XP, Luo HZ. Research on hereditability of gastric cancer in wuwei city. Int J Biomed Sci. 2006;2:59–63. [PMC free article] [PubMed] [Google Scholar]
- 23.Peleteiro B, Castro C, Morais S, Ferro A, Lunet N. Worldwide burden of gastric cancer attributable to tobacco smoking in 2012 and predictions for 2020. Dig Dis Sci. 2015;60:2470–6. doi: 10.1007/s10620-015-3624-x. doi:10.1007/s10620-015-3624-x. [DOI] [PubMed] [Google Scholar]
- 24.Tramacere I, Negri E, Pelucchi C, Bagnardi V, Rota M, Scotti L, et al. A meta-analysis on alcohol drinking and gastric cancer risk. Ann Oncol. 2012;23:28–36. doi: 10.1093/annonc/mdr135. doi:10.1093/annonc/mdr135. [DOI] [PubMed] [Google Scholar]
- 25.Squires J, Roebothan B, Buehler S, Sun Z, Cotterchio M, Younghusband B, et al. Pickled meat consumption and colorectal cancer (CRC): A case-control study in Newfoundland and Labrador, Canada. Cancer Causes Control. 2010;21:1513–21. doi: 10.1007/s10552-010-9580-z. doi:10.1007/s10552-010-9580-z. [DOI] [PubMed] [Google Scholar]
- 26.Islami F, Ren JS, Taylor PR, Kamangar F. Pickled vegetables and the risk of oesophageal cancer: A meta-analysis. Br J Cancer. 2009;101:1641–7. doi: 10.1038/sj.bjc.6605372. doi:10.1038/sj.bjc.6605372. [DOI] [PMC free article] [PubMed] [Google Scholar]
- 27.Nimptsch K, Pischon T. Body fatness, related biomarkers and cancer risk: An epidemiological perspective. Horm Mol Biol Clin Investig. 2015;22:39–51. doi: 10.1515/hmbci-2014-0043. doi:10.1515/hmbci-2014-0043. [DOI] [PubMed] [Google Scholar]
- 28.Yan S, Li B, Bai ZZ, Wu JQ, Xie DW, Ma YC, et al. Clinical epidemiology of gastric cancer in Hehuang Valley of China: A 10-year epidemiological study of gastric cancer. World J Gastroenterol. 2014;20:10486–94. doi: 10.3748/wjg.v20.i30.10486. doi:10.3748/wjg.v20.i30.10486. [DOI] [PMC free article] [PubMed] [Google Scholar]
- 29.Wang AH, Liu Y, Wang B, He YX, Fang YX, Yan YP. Epidemiological studies of esophageal cancer in the era of genome-wide association studies. World J Gastrointest Pathophysiol. 2014;5:335–43. doi: 10.4291/wjgp.v5.i3.335. doi:10.4291/wjgp.v5.i3.335. [DOI] [PMC free article] [PubMed] [Google Scholar]
- 30.McCarthy M. Cancer survivors face substantial financial burdens, US report says. BMJ. 2014;348:g4017. doi: 10.1136/bmj.g4017. doi: 10.1136/bmj.g4017. [DOI] [PubMed] [Google Scholar]