Abstract
A new standardized immunohistochemistry (IHC) control for breast cancer testing comprises formalin-fixed human epidermal growth factor receptor 2, estrogen receptor, or progesterone receptor peptide antigens covalently attached to 8-µm glass beads. The antigen-coated beads are suspended in a liquid matrix that hardens upon pipetting onto a glass microscope slide. The antigen-coated beads remain in place through deparaffinization, antigen retrieval, and immunostaining. The intensity of the beads’ stain provides feedback regarding the efficacy of both antigen retrieval and immunostaining. As a first report, we tested the sensitivity and specificity of the new IHC controls (“IHControls”). To evaluate sensitivity, various staining problems were simulated. IHControls detected primary and secondary reagent degradation similarly to tissue controls. This first group of IHControls behaved similarly to tissue controls expressing high concentrations of the antigen. The IHControls were also able to detect aberrations in antigen retrieval, as simulated by sub-optimal times or temperatures. Specificity testing revealed that each antigen-coated bead was specific for its cognate IHC test antibody. The data support the conclusion that, like tissue controls, IHControls are capable of verifying the analytic components of an immunohistochemical stain. Unlike tissue controls, IHControls are prepared in large bulk lots, fostering day-to-day reproducibility that can be standardized across laboratories.
Keywords: bead, IHControl, immunohistochemistry, peptide, quality control, validation
Introduction
The use of test controls is an important facet of a quality assurance program for maintaining reproducible laboratory testing. Test controls verify the analytic components of a laboratory test. For example, a glucose test control might comprise a 100 mg/dL glucose solution with preservatives and stabilizers. Similar standardized test controls are well established in most types of clinical laboratories, such as clinical chemistry, hematology, microbiology, and blood banking. By contrast, current practice in clinical immunohistochemistry teaches the use of non-standardized controls. Each histopathology laboratory typically procures test controls from leftover tissue samples in its own paraffin block archives. This is a strikingly different practice from clinical blood laboratories, where standardized and validated controls are produced in large quantities and sold through commercial vendors. Since each human tissue is a limited resource, present practice is inherently non-standardized.
In this report, we evaluate a novel system of standardized immunohistochemistry test controls that can be manufactured in bulk, for commercial distribution. The test controls are designed to verify the analytical components of an immunohistochemical test, including the proper performance of antigen retrieval. As a first example, we have developed a breast cancer panel for human epidermal growth factor receptor 2 (HER-2), estrogen receptor (ER), and progesterone receptor (PR) tests.
These controls are an evolution of a previously published technology for generating on-slide IHC controls (Bogen et al. 2009a; Sompuram et al. 2002; Vani et al. 2008). Previously, we developed a system of depositing spots of antigens (linear peptide epitopes of HER-2, ER, and PR) onto glass microscope slides. After immunostaining, a 3-mm diameter spot appeared that was visible even without a microscope. The test controls could detect immunostaining and antigen retrieval problems. Commercialization by a corporate partner was frustrated by difficulties that were encountered in manufacturing scale-up. Moreover, the fact that the (macroscopic) readout was different than the tissue samples, measured microscopically, created regulatory challenges.
We now have developed a new system of IHC controls that overcomes these impediments to commercialization. As before, the antigen is in the form of peptide epitopes. Unlike the previous system, HER-2, ER, and PR antigens are covalently linked to 8-µm diameter glass beads. The beads approximate the size of cells and are amenable to visual inspection as well as image quantification. The beads are suspended in a liquid matrix that retains them to glass microscope slides. We combined the beads, each bearing a different antigen, so as to create a multiplex test control with built-in specificity checks. As before, antigen retrieval is required for proper staining. We have identified the appropriate peptide antigens for all major commercial HER-2, ER, and PR antibody clones used in clinical practice. By combining several, we create a multiplex test control for HER-2, ER, and PR, named “IHControls”.
In this report, we compare IHControls to conventional tissue controls in their ability to detect problems with immunostaining and antigen retrieval. We also evaluate their IHC staining specificity.
Materials & Methods
Image Analysis
Images were acquired with a Nikon Eclipse E400 microscope fitted with a Spot Imaging Solutions RT CCD-cooled color camera, Model 2.3.0 (Diagnostic Instruments Inc.; Sterling Heights, MI). Prior to photomicroscopy, the microscope optics were first set for Köhler illumination. The contrast and gamma adjustments in the camera software were left in the default setting (gamma = 1; contrast control off). Whole-slide imaging was not used. Instead, each data point is the mean from 3–5 separate brightfield images. Stain intensity of tissue sections was measured using Image J (NIH; Bethesda, MD), with the ImmunoRatio plugin (for ER/PR analysis) and ImmunoMembrane plugin (for HER-2 analysis) (Tuominen et al. 2010, 2012). The programs are freely available. In both Immunomembrane and Immunoratio, the algorithms include color segmentation for distinguishing the brown color associated with DAB from the blue color associated with the hematoxylin counterstain. A similar color segmentation was performed for quantifying the IHControls stain intensity using a custom algorithm embedded in MatLab.
HER-2 Image Quantification
HER-2 scoring in the Immunomembrane plugin (running in Image J) is based on both image intensity and “completeness” of staining around the circumference of tumor cells. These two independent scores are then summed, to create the conventional 0 to 3+ score. Of these three parameters (intensity, completeness, and final score), we used the image intensity score because it was most relevant for QC evaluation.
ER and PR Image Quantification
The ImmunoRatio plugin (running in Image J) for ER and PR does not directly quantify image intensity. Rather, it measures the percentage of positively stained nuclei. Image intensity is (indirectly) measured insofar as a cell needs to have a sufficient image intensity to be considered stained.
IHControls Image Quantification
We developed a custom algorithm embedded in MatLab that directly measures image intensity of the test beads and an internal color intensity standard bead. The color intensity standard is a brown-colored bead that is approximately half the size of the test beads. Because of its smaller size, it can be easily distinguished from a test bead. The color standard bead is brown regardless of IHC staining, thereby serving as a brown color intensity standard to normalize image intensity regardless of the settings for taking the photograph. Image intensity is expressed as a ratio of the image intensity of test beads divided by the internal color standard bead intensity.
To calculate bead color intensity in MatLab, as an initial step, images were converted from RGB color format to grayscale intensity. Images were then segmented to identify beads using Hough transform methods for segmentation of circles that are available in the MatLab Image Processing toolbox. The segmentation was performed so as to separately identify both circles with a lighter exterior and dark interior (which delineated the border between the image background and the bead), and circles with a darker exterior and lighter interior (which delineated the border between the dark rim apparent around each bead and the bead interior). Because all images were acquired at a known magnification, parameters were used for establishing an allowable range of bead radii. After individual beads were segmented, additional logic was used to remove segmentation errors, such as where overlapping beads were found.
After beads were segmented, further processing was used to sort the beads according to type and quantify stain values in each bead. Stain concentration was estimated as the dot product of the measured RGB values at each point with the known RGB profile of the stain. Smaller calibration beads were sorted by size. The (larger) test beads were sub-classified as stained or unstained beads on the basis of the stain intensity in the bead. Unstained beads were separated from strained beads using Otsu’s method to determine a threshold for converting a gray-level image into a binary image. A method was provided in the user interface for reviewing classification results and manually adjusting thresholds, if needed. Finally, the stain intensity statistics were computed for all segmented and classified beads.
Immunohistochemistry Staining
IHC staining was performed on a Dako Autostainer (Dako Corporation; Carpinteria, CA) using the Dako HER-2 Herceptest (catalog #K5207) or ER/PR PharmDx (catalog #K4071) kits. Slides were baked at 57–59°C for 2 hr and then de-paraffinized in xylene. The slides were then hydrated in decreasing grades of ethanol. Antigen retrieval (HER-2) was performed in a 95–97°C water bath for 40 min, as per the manufacturer’s instructions. For ER/PR antigen retrieval, the slides were processed for 40 min in a pressure cooker. Antigen retrieval was performed using Dako’s antigen retrieval solutions provided with the HER-2 or ER/PR kit. For all subsequent steps, the manufacturer’s reagents, buffers, and instructions were followed for staining. The slides were then counterstained in hematoxylin, dehydrated, and coverslipped. The IHControls and the tissue arrays (described below) were always on the same slide during IHC staining.
Tissue Controls
Archival formalin-fixed, paraffin-embedded (FFPE) tissue blocks were obtained from the Tissue Biorepository of the Department of Pathology & Laboratory Medicine, Tufts Medical Center, under an approved IRB protocol. For ER and PR, we used sections of either breast carcinoma or uterine endometrium/myometrium. The endometrial glands were typically strongly positive for ER and PR (designated as “high”), whereas the myometrium stained at a lower level (“low”). We created tissue arrays comprising HER-2, ER, or PR tissues that were strongly positive, intermediate or low, and negative for the analyte in question (as a control).
IHControls
IHControls comprised beads of two different sizes: test beads and color standard beads. The test beads are approximately 8 µm in diameter and coated with portions of antigen (peptides). Each test bead has only one type of peptide. The IHControls product comprised a mixture of beads, each having one antigen combined together in suspension. For these experiments, we combined four different antigen-coated beads together in suspension in approximately equal proportions. These antigen-coated beads included peptides for the Herceptest HER-2, ER 1D5, PR 1294, and PR 636 antibodies. Thus, the IHControls product being evaluated in this study have a multiplex capability; HER-2, ER, and PR antibody-immunoreactive beads are all found in the same mixture. The color standard beads are approximately 3 µm in diameter and permanently colored dark brown, regardless of the IHC staining procedure. The small size of these beads distinguishes them from the test beads. The color standard beads served as a color intensity reference for standardizing color intensity measurements, regardless of the camera and microscope optical settings.
After coupling the peptide antigens to glass beads, the IHControls were formalin-fixed in the presence of casein. The fixation conditions caused the formation of cross-links between casein and the peptide antigens on the bead surface. These protein cross-links are similar to the protein cross-links in tissues and cells after formalin fixation. In the studies described in this study, we compared the efficacy of various antigen retrieval conditions on the formalin-fixed IHControls and the formalin-fixed tissue controls.
After formalin-fixation, the peptide antigen-coated beads were suspended in a proprietary liquid matrix that hardens after dispensing onto a glass microscope slide. Before dispensing, the matrix has the consistency of water. The bead concentration is adjusted to approximately 4000 to 6000 beads/µl. In normal use, 1 µl is dispensed onto the glass slide where it forms a thin fluid layer with an even monolayer of beads. After a few minutes, the droplet dries and adheres the beads to the glass slide surface. The matrix components result is a permeable but resilient shell that retains the beads on the glass surface, resists deparaffinization and antigen retrieval, and allows immunostaining reagents to readily diffuse. Although the sample beads are several microns thicker than tissue sections (approximately 8 µm for beads versus 4–5 µm for tissue), this difference has presented no problems with coverslipping. The coverslip normally rests on a thin layer of mounting medium that is far thicker than these micron-scale objects.
Statistical Analysis
Sensitivity of the controls was defined as their ability to identify aberrations in staining, which we simulated in the various experiments. The minimum sensitivity is defined as the minimum alteration (in reagent concentration or staining conditions) that generates a mean stain intensity that is statistically significantly different (lower) than the baseline mean stain intensity. To assess statistical significance, a two-tailed Student’s t-test was used, adjusted for multiple testing (Bonferroni correction). The null hypothesis was that there was no difference between the baseline staining condition and the condition being tested. For example, we simulated reagent degradation by diluting out the various reagents. In that experiment, the baseline condition was using undiluted reagent. The mean stain intensity of the baseline group was compared to the mean stain intensity of a diluted antibody group. The two groups are treated as separate groups with equal variances.
To allay concerns about multiple comparisons, we conducted pairwise Student’s t-tests using the following sequential strategy (see Figs. 4 and 5). For each condition, we first compared the undiluted (baseline) group with the maximum dilution group. If there was no significant difference between these two groups, we stopped, as lower dilutions would also not be significantly different than the undiluted (baseline) group. If there was a significant difference, however, we then proceeded to test progressively lower dilutions against the undiluted group. Ultimately, we identified the lowest dilution that was statistically different from the baseline. For antigen retrieval experiments (see Figs. 6 and 7), the same approach was used but substituting the “no antigen retrieval” group instead of the maximum dilution group. A Bonferroni correction was then applied to correct for multiple testing.
Figure 4.
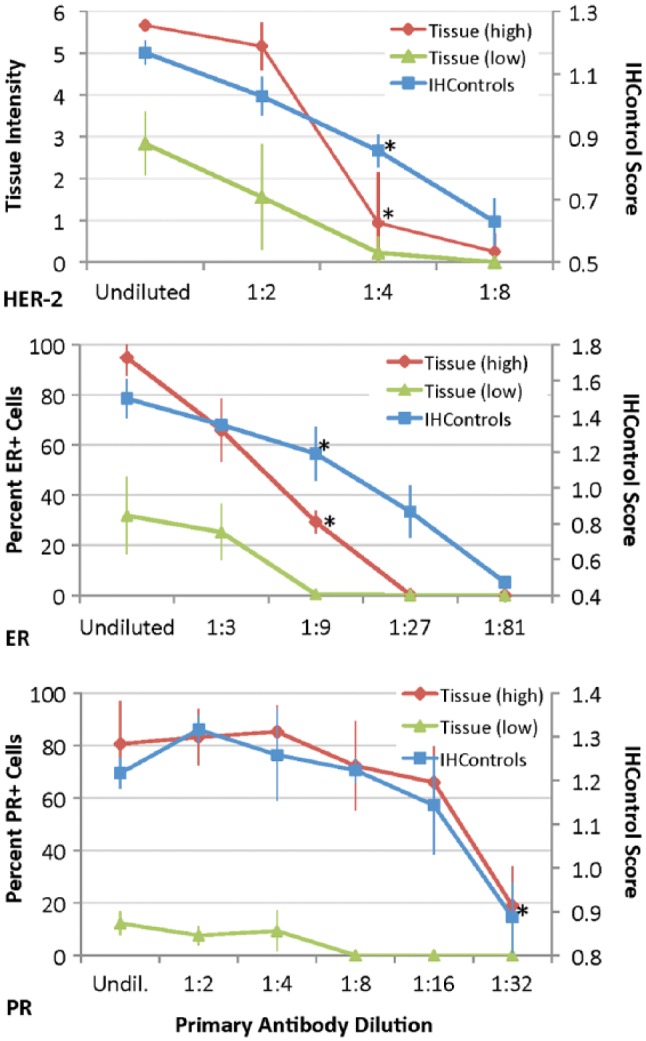
Graph demonstrating the relationship between the primary antibody dilution (x-axis) versus stain intensity (y-axis) for HER-2 (top), ER (middle), and PR (bottom), as measured with both tissue controls and IHControls. The undiluted (undil.) group uses the primary antibody concentration as supplied by the manufacturer. Tissue staining, as quantified by either stain intensity or percent positive cells, is represented on the left-hand vertical axis in each graph. Stain intensity of IHControls is represented on the right-hand axis. For each data point, samples were tested in triplicate. The triplicate tissue controls are serial sections from the same paraffin tissue block. The graphs depict the mean ± SD. The “tissue (high)” and “tissue (low)” controls represent the data from tissue sections expressing high or intermediate/low levels of the antigen. The asterisks identify the dilution that results in a statistically significantly lower level of staining as compared to the baseline condition.
Figure 5.
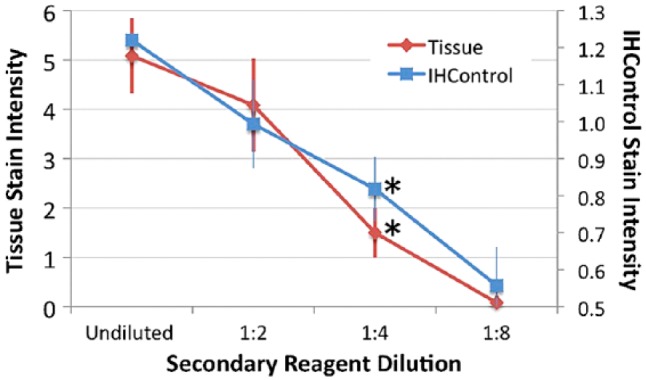
Secondary antibody dilution (x-axis) versus stain intensity (y-axis) for HER-2, as measured using both tissue controls (antigen-high) and IHControls. Stain intensity for HER-2 tissue staining is represented on the left-hand vertical axis. Stain intensity of the IHControls is represented on the right-hand axis. For each data point, samples were tested in triplicates. The triplicate tissue controls are serial sections from the same paraffin tissue block. The graphs depict the mean +/- SD. The asterisks identify the dilution that results in a statistically significantly lower level of staining as compared to the baseline condition.
Figure 6.
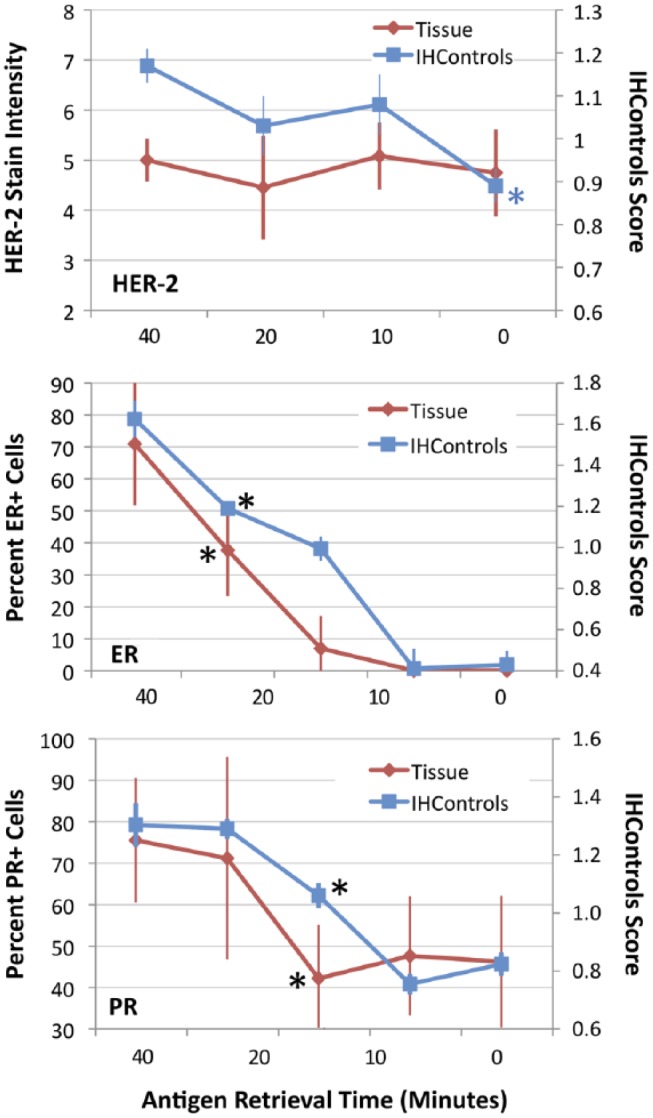
Graphs illustrating IHC stain intensity (y-axes) for HER-2 (top), ER (middle), and PR (bottom) after various times for antigen retrieval (x-axis). In each graph, staining of (antigen-high) tissue controls is compared to IHControls. Tissue staining measures are represented on the left-hand vertical axis. IHControls stain intensity is represented on the right-hand vertical axis. For each data point, samples were tested in triplicate. The triplicate tissue controls are serial sections from the same paraffin tissue block. The graphs depict the mean ± SD. The asterisks identify the time point that produces a statistically significant decrement from the baseline level of stain intensity.
Figure 7.
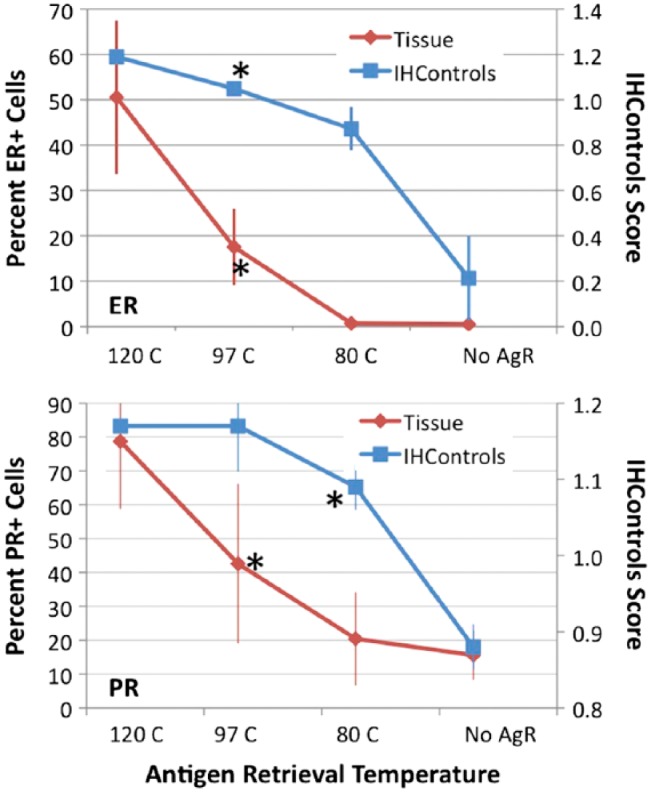
Graphs of IHC staining for ER (top) and PR (bottom), as represented on the y-axes, when various antigen retrieval temperatures (x-axis) are used. The percentage of positively stained nuclei (for ER and PR) is represented on the left-hand vertical axis. IHControls stain intensity is represented on the right-hand vertical axis. For each data point, samples were tested in triplicate. The triplicate tissue controls are serial sections from the same paraffin tissue block. The groups on the x-axis are no antigen retrieval (No AgR), or antigen retrieval at 80°C, 90°C, and 120°C. The graphs depict the mean ± SD. Asterisks identify the group achieving statistical significance as compared to the baseline condition (120°C).
Results
In all experiments, the tissue comparator and IHControls were mounted on the same slides so that the same reagents contacted both, for the exact same duration and temperature. This is illustrated in Fig. 1, showing a HER-2 tissue control adjacent to an IHControl spot on a glass microscope slide. Figure 1 illustrates the macroscopic appearance of the IHControls stained for HER-2. A difference between the tissue section and the IHControls is that the tissue section is mounted after microtome-sectioning. The IHControls, on the other hand, are pipetted onto the slide and the fluid suspension of beads is allowed to harden and adhere to the slide.
Figure 1.
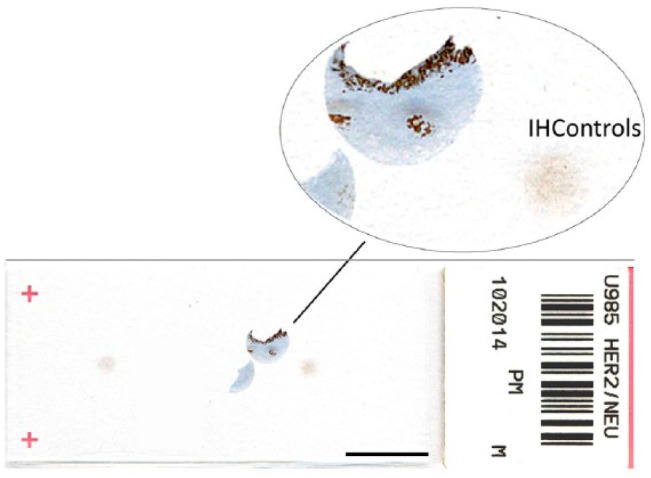
A microscope slide bearing a HER-2 tissue control and 2 IHControls spots. Scale, 1 cm.
Microscopic examination of the IHControls illustrates two different types of beads (Fig. 2) that differ in size. The test beads are larger; the color standard beads are smaller. The stained-positive test beads bear the HER-2 antigen peptide to which the IHC staining antibody binds. The unstained test beads bear different antigens corresponding to ER and PR. The combination of multiple different peptide antigen-coated beads automatically provides for a built-in negative control for every immunostain; there is always an antigenically irrelevant peptide antigen-coated bead. There is also a distinct set of smaller beads called “color standard beads”. They are colored brown regardless of the immunohistochemical stain and serve to help standardize optical measurements (see Materials & Methods).
Figure 2.
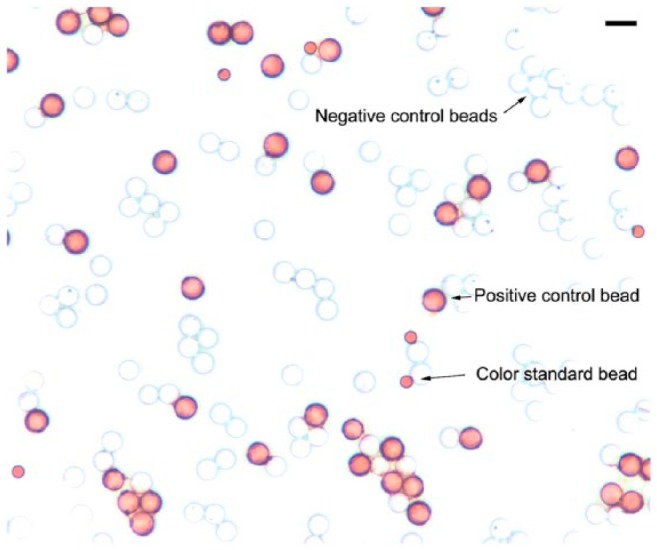
Stained IHControls after HER-2 immunostaining showing three types of beads. The 8-µm stained (“positive control”) test beads bear the HER-2 peptide antigen. The unstained (“negative control”) test beads bear either ER or PR peptide antigens. The 3-µm color standard beads are permanently colored dark brown. Scale, 10 µm.
After staining, test beads bearing the cognate antigen were colored by the same immunological reaction as occurs for cells and tissues that express the relevant antigen in the patient sample. Since the IHControls contain a cocktail of beads, each coated with different antigen, only a minority of beads are relevant for any single test analyte. The other (unstained) beads, bearing antigenically unrelated peptides, serve as a specificity control. A custom algorithm was developed and embedded in MatLab for test bead color quantification (Materials & Methods).
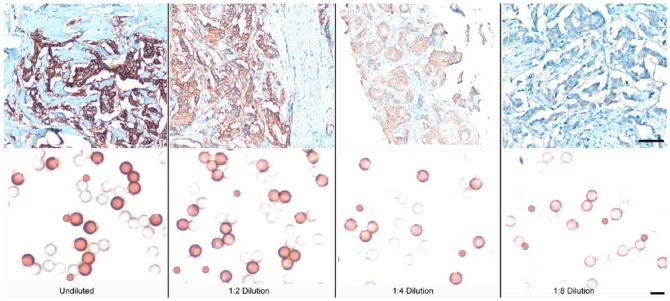
As a first test, the ability of the IHControls to detect staining anomalies (their “sensitivity”) was evaluated in an experiment simulating primary antibody degradation. The comparator in this study is pathological discard, de-identified, patient tissue sections that contain varying concentrations of the relevant analyte. The goal is to compare the IHControls to conventional tissue controls in their ability to detect decrements in stain performance. We use the term “sensitivity” to describe this parameter. To simulate a decrement in stain performance, the primary antibody was diluted out. Figure 3 illustrates representative images of HER-2-stained tissues (top panel) and IHControls (lower panel). The photomicrographs illustrate that, with each serial dilution, the stain intensity of both the IHControls and the tissue controls progressively decrease. For the IHControls, they can be most easily evaluated by comparison to the smaller color standard beads. As the primary antibody is initially diluted out, the central portion of the beads becomes clear (uncolored). With further dilutions, edge staining also fades.
Figure 3.
Photomicroscopy images of HER-2-stained tissue controls and IHControls at various primary antibody dilutions. The image intensities of both the tissue controls and the IHControls diminish proportionately as the primary antibody is diluted. Scale, top panels: 80 µm; lower panels: 10 µm.
We quantified the stain intensity using the Image J software program (for tissue staining) and a custom algorithm running in MatLab, developed for quantification of IHControls beads. Each group was performed in triplicate. Figure 4 illustrates the primary antibody dilution curves for HER-2 (top panel), ER (middle panel), and PR (lower panel) controls. For HER-2, the Image J software program quantified HER-2 staining on a 1 to 10 scale. It also quantified stain contiguity and provided the conventional score from 0 to 3+. However, tissue staining intensity is the most relevant direct comparison to bead intensity; so, that parameter was used throughout. For ER and PR analysis, Image J measured the percentage of stained nuclei. In each experiment, the dilution curves for the antigen-high tissues were approximately similar to that of the IHControls. For HER-2 (Fig. 4, top panel), both the IHControls and tissue controls detected a 1:4 dilution of primary antibody (p<0.01 for both). For ER (Fig. 4, middle panel), both the IHControls and tissue controls detected a 1:9 dilution (p<0.01 for both). For PR (Fig. 4, lower panel), both the IHControls and the (antigen-high) tissue control detected a 1:32 dilution (p<0.01 for both). In each instance, the IHControls and tissue controls demonstrated a similar ability to detect a decreased concentration of the primary antibody. The specific dilutions varied from assay to assay, depending on the starting concentration of the primary antibody as formulated by the manufacturer (Dako Corp.)
This experiment (using both high and low tissue controls) also illustrates the importance of antigen concentration in immunohistochemical controls. For example, the PR-low tissue control was better than the PR-high control in detecting antibody dilution (simulating antibody deterioration). With the PR-low tissue control, decreased staining was detected at a 1:8 dilution whereas the PR-high control required a 1:32 dilution before there was a statistically significant decrease in staining. Presumably, the manufacturer configured the test with a high sensitivity so as to detect low concentrations of PR. Consequently, the antigen-high controls are easy to detect, such that much more degradation in the assay must occur before the consequences will be noticed.
We also tested the ability of the two types of controls to detect secondary (detection) reagent degradation. Since the secondary reagent is the same (or highly similar) amongst the three assays, we performed the test with only one, using the HER-2 kit. Figure 5 illustrates a similar rate of decline in staining intensity for the tissue section as for the IHControls. Both the IHControls and tissue controls yielded a statistically significant decrement in staining, with a 1:4 reagent dilution (p<0.01 for both). In summary, the sensitivity analysis indicated that the IHControls appear to have a comparable ability as antigen-high tissue controls in detecting primary or secondary reagent failure. The data also suggest that creating IHControls with lower levels of antigen may be useful for some IHC assays.
A second aim of this study was to evaluate the ability of IHControls to detect changes in antigen retrieval. The antigen on IHControls is formalin fixed. If formalin-fixed tissue sections require antigen retrieval, so do the IHControls. We previously described the immunochemical mechanism for formalin fixation and antigen retrieval using purified peptide antigens (Bogen et al. 2009b; Sompuram et al. 2006a, 2006b). Therefore, it is useful to know whether the IHControls will be equivalently sensitive as formalin-fixed tissue controls in detecting abnormalities in antigen retrieval. We evaluated two different types of antigen retrieval abnormalities: (a) shortening the antigen retrieval time, or (b) lowering the temperature at which antigen retrieval is performed.
Figure 6 depicts our data for antigen retrieval failure as simulated by an abnormally shortened time. Our default time is 40 min for HER-2 and ER/PR. Shorter times would be expected to yield lower stain intensities. Surprisingly, HER-2 staining on tissue sections (using the Herceptest reagents) did not require antigen retrieval (top panel, Fig. 6). There was strong staining in the tissue sections regardless of antigen retrieval. This result was unexpected because most immunostaining on formalin-fixed, paraffin-embedded tissues requires antigen retrieval. The explanation for this surprising result is that the polyclonal nature of the HER-2 (primary) antibody identifies multiple different epitopes. Consequently, formalin fixation does not block all of the binding sites. This is not a new finding. Polyclonal HER-2 antibodies are less sensitive to steric interference after formalin-induced cross-linking (Pauletti et al. 2000; Thomson et al. 2001). In fact, the manufacturer (Dako) initially did not even recommend antigen retrieval for their A0485 polyclonal HER-2 antibody when it was first commercialized (Thomson et al. 2001). In contrast to tissue controls, the HER-2 IHControls demonstrated a mild increase in staining intensity with antigen retrieval. There is a statistically significant difference for the IHControls at the zero time point as compared to 40 min (Fig. 6, top panel, blue asterisk, p<0.01). By contrast, there is no decrement in stain intensity of the HER-2 tissue control at any time point. These data indicate that IHControls are mildly more sensitive in detecting abnormalities in antigen retrieval for HER-2 than the tissue control.
For ER and PR immunohistochemical staining, both the IHControls and the tissue controls showed increased staining with increasing time for antigen retrieval. Both appeared equally capable of detecting an abnormally shortened antigen retrieval time. For the PR test, the PR 1294 antibody demonstrated a lower but nonetheless detectable level of binding to PR antigen, even without antigen retrieval. Namely, the zero antigen retrieval time point for PR still detected 40% to 50% of cells in this particular tissue block.
We also simulated antigen retrieval failure by using variable temperatures (Fig. 7). Since HER-2 stained even without antigen retrieval, we did not include HER-2 in this next study. Our default antigen retrieval procedure for ER and PR is in a pressure cooker, which reaches temperatures above the boiling point of water, reportedly up to 120°C. The other experimental groups comprised incubation in a water bath, either at 80°C or 97°C, or no antigen retrieval at all.
Stain intensity increased with increasing temperatures, both for the IHControls and tissue controls. The rate of increase was not the same; the IHControls rate of increase in stain intensity was consistently higher (Fig. 7, comparing the slope/shape of the curves). This finding suggests that formalin-induced cross-links in IHControls are more readily broken than in tissue. Immunoreactivity is more readily restored at sub-optimal temperatures in IHControls as compared to tissue controls. Despite the different slopes, both IHControls and tissue controls had comparable sensitivity (for detecting antigen retrieval problems) in the ER group. In both, there was a statistically significant decrement at the 97°C temperature point (p<0.01 for both). For PR, the IHControls stain intensity was statistically significantly lower at the 80°C temperature point, whereas the tissue controls yielded a statistically significant decrement at the 97°C temperature point (p<0.01 for both). This experiment also demonstrated that the PR 1294 antibody detects some PR antigen (albeit at a lower level) even without antigen retrieval. This is in agreement with our findings illustrated in Fig. 6. In this particular tissue block, 10% to 20% of PR+ cells could be detected in the “No AgR” group.
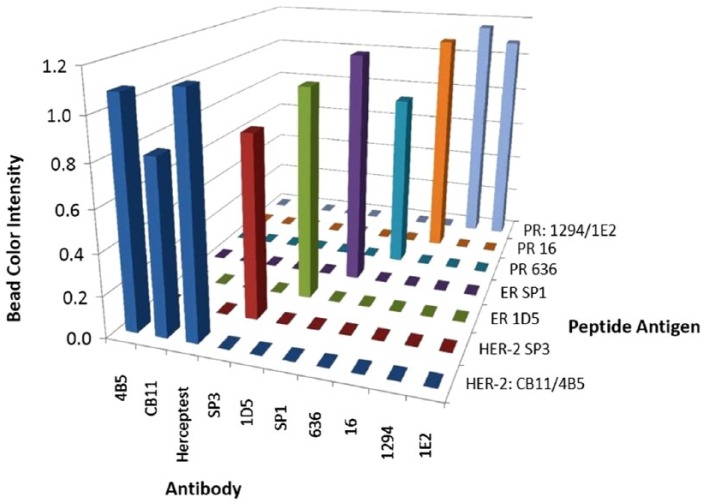
Figure 8 illustrates the specificity of the IHControls for different commercial antibodies. Each antigen-coated bead was separately tested (not in a multiplex cocktail of beads) against each commercial HER-2, ER, or PR antibody. Bead stain intensity for each group was quantified by image analysis (Fig. 8). The data show that there is no unexpected cross-reactivity amongst the IHControls. Two peptide antigens are immunoreactive with more than one antibody. A PR peptide is immunoreactive with both the 1294 and 1E2 PR-specific antibody clones. Also, a HER-2 peptide is immunoreactive with the HER-2-specific CB11 and 4B5 clones, as well as the polyclonal Herceptest. These patterns of immunoreactivity are expected based on our epitope mapping analysis. We previously mapped their epitopes to immediately adjacent positions on the same peptides.
Figure 8.
Peptide antigens on the IHControl beads bind specifically to their cognate antibodies. Data from a “criss-cross” experiment, measuring the immunostaining intensity with various HER-2, ER, and PR antibodies with their corresponding peptide antigens. The vertical bars represent the mean stain intensity, as measured using image analysis. The fact that there was no detectable color in the unstained beads made it difficult to obtain an actual number by image analysis, as the MatLab algorithm automatically located and distinguished stained beads from unstained beads by the presence of stain. Even after lowering the detection threshold, the program could not distinguish any color on the beads. Therefore, a value of “zero” was entered for unstained beads. The values are the means of triplicates.
Discussion
Ready-to-use, reproducible, commercial assay controls are a fixture in almost all types of clinical laboratory testing—except in clinical immunohistochemistry. The fact that they are absent from clinical immunohistochemistry laboratories places a higher burden on the laboratory. Finding suitable control materials from paraffin block archives and preparing sections are time-consuming tasks. Specifically, creating homebrew IHC controls requires: (a) identifying both high and low level controls, so as to test different parts of the IHC stain’s analytic measurement range; (b) ensuring that sufficient diagnostic patient material is left in the paraffin block archive, lest additional studies are someday needed; (c) verifying the control tissue’s expected stain intensity; (d) building a control tissue array; and (e) microtome-sectioning and mounting the controls. By contrast, IHControls are simply pipetted out of a vial onto the slide and allowed to dry for a few minutes. The use of standardized controls also facilitates inter-laboratory comparisons, promoting laboratory standardization. For these and other reasons, other types of clinical laboratory testing almost always use standardized commercial controls. The factor probably most responsible for the absence of commercial controls has been the difficulty in developing IHC controls that can be mass-produced in a cost-effective fashion and behave like formalin-fixed tissues. In this report, we describe our test results with a candidate for this role.
The main theme emerging from the data relates to the ability of the tissue controls and IHControls to detect aberrations in primary or secondary reagent and antigen retrieval efficacy. Regardless of whether the antigens are native (from tissue) or synthetic (peptide antigens), the immunological reactions are similar. The peptides on the IHControls are of the same amino acid sequence as those found in the native protein. Consequently, as a reagent is diluted out, the IHC signal is approximately comparably diminished.
The ability of the IHControls to be fixed with formalin, thereby requiring antigen retrieval, may initially appear puzzling. Small peptides, tethered at one end to a glass bead, might not be expected to readily cross-link to each other so as to sterically interfere with antibody binding. Our previously published data indicate that only a minority of peptides that we tested exhibited this effect after formalin fixation (Sompuram et al. 2006a). If, however, a protein is cross-linked to the peptide antigens, then antibody binding can be abrogated or significantly diminished. We previously described this observation and proposed a mechanistic model, based on steric interference to primary antibody binding (Sompuram et al. 2006a). Subsequent studies using circular dichroism spectropolarimetry support this model (Fowler et al. 2011). Antigen retrieval reverses the cross-links, exposing the linear antibody epitopes contained within the peptides.
Another study finding was that the primary antibody reagent dilution data (Fig. 4) suggest that this first batch of IHControls behaves like antigen-high controls. Based on these findings, we plan to prepare and evaluate IHControls at a lower peptide antigen concentration. Antigen-high versus antigen-low controls test the corresponding high and low parts of the analytic measurement range for an immunohistochemical assay. The optimal control will be one that has an antigen concentration in the analytic measurement (linear) range of the immunohistochemical assay. Controls with antigen concentrations beyond the linear range of measurement will be less sensitive in detecting staining problems.
IHControls offer both advantages and disadvantages relative to the present state-of-the-art. Regarding advantages, the IHControls are reproducible (day-to-day), easy to use, and offer a high level of intra- and inter-laboratory standardization. We have stored the IHControls for 8 months in the refrigerator and, so far, we do not see any diminution in their performance. The fact that the peptide antigen-coated beads are formalin-fixed probably helps foster long-term stability. A disadvantage is that, unlike tissue controls, IHControls do not provide for the opportunity to evaluate the counterstain. Counterstains do not register on the glass beads. Also, IHControls do not comprise the same matrix as the patient sample. Although the data demonstrate an approximately equivalent ability to detect degradation of reagents and aberrations in antigen retrieval, there is at least a theoretical advantage in using a control that is of the same matrix as the patient sample.
Neither tissue controls nor IHControls address pre-analytical variables such as formalin fixation and tissue processing. This limitation is inherent in any external quality control, not just in immunohistochemistry (Westgard 2010). For example, a glucose control that verifies serum glucose testing will not inform a clinical chemistry laboratory if a particular patient’s blood sample was delayed in transport, a pre-analytical error that can result in cellular consumption of glucose and an incorrect test result. Similarly, neither an archival tissue control nor the IHControls can inform about aberrations in tissue fixation or processing on a particular day.
To date, the IHControls have been used successfully on a Dako Autostainer, Dako Autostainer Link 48, and a Ventana Benchmark XT. We have not yet used the IHControls with other instruments. Moving forward, we will be conducting analytical and clinical validation on IHControls for all widely used, commercial HER-2, ER, and PR antibodies, on all commercially available instruments. All of the peptides (for HER-2, ER, and PR) have already been mapped, synthesized, and verified to be correct (Fig. 8). Beyond that, the technology is simple enough to extrapolate to any antigen, as it only requires mapping the antibody’s epitope. The ease of use for IHControls may recommend them as on-slide controls as a supplement to tissue batch controls. They may be especially helpful in cases where there is no internal positive control. As on-slide controls, they would help build confidence that a negative patient test result is true. Moreover, they may foster greater reproducibility and accuracy of measurement.
Acknowledgments
The authors thank Dr. Ron Zeheb, Dr. Farzad Noubary (Tufts University School of Medicine, Boston MA), Dr. Stephen Naber (Tufts Medical Center, Boston MA), and Dr. Jeffrey Goldsmith (Beth Israel Deaconess Hospital, Boston MA) for their advice regarding experimental design and statistical analysis.
Footnotes
Declaration of Competing Interests: The authors declared the following potential competing interests with respect to the research, authorship, and/or publication of this article: Three of the authors (SRS, KV, and SAB) have a patent (ownership) interest in the technology. The other two authors (DK, BT) declare they have no competing interests.
Author Contributions: SRS contributed to the conception of the technology, manufacture of the IHControls, and execution of experiments. KV executed most of the failure simulation experiments and image analysis for ER, PR. BT developed the MatLab algorithm that was used for quantifying the IHControls. DK performed image analysis for HER-2 tissue sections. SAB contributed to the conception of the technology, experimental design, data review, and drafting of the manuscript. All authors have read and approved the manuscript.
Funding: Research reported in this publication was supported by the National Cancer Institute of the National Institutes of Health under award number 1R44CA183203-1 and the National Center for Advancing Translational Sciences, National Institutes of Health, award number UL1TR001064.
References
- Bogen S, Vani K, McGraw B, Federico V, Habib I, Zeheb R, Luther E, Tristram C, Sompuram S. (2009a). Experimental Validation Of Peptide Immunohistochemistry Controls. Appl Immunohistochem & Mol Morphol 17:239-246. [DOI] [PMC free article] [PubMed] [Google Scholar]
- Bogen S, Vani K, Sompuram S. (2009b). Molecular Mechanisms of Antigen Retrieval: Antigen Retrieval Reverses Steric Interference Caused By Formalin-Induced Crosslinks. Biotechnic & Histochem 84:207-215. [DOI] [PMC free article] [PubMed] [Google Scholar]
- Fowler C, Evers D, O’Leary T, Mason J. (2011). Antigen retrieval causes protein unfolding: Evidence for a linear epitope model of recovered immunoreactivity. J Histochem Cytochem 59:366-381. [DOI] [PMC free article] [PubMed] [Google Scholar]
- Pauletti G, Dandekar S, Rong H, Ramos L, Peng H, Seshadri R, Slamon D. (2000). Assessment of Methods for Tissue-Based Detection of the HER-2/neu Alteration in Human Breast Cancer: A Direct Comparison of Fluorescence In Situ Hybridization and Immunohistochemistry. J Clin Oncol 18:3651-3664. [DOI] [PubMed] [Google Scholar]
- Sompuram S, Kodela V, Zhang K, Ramanathan H, Radcliffe G, Falb P, Bogen S. (2002). A novel quality control slide for quantitative immunohistochemistry testing. J Histochem Cytochem 50:1425-1434. [DOI] [PubMed] [Google Scholar]
- Sompuram S, Vani K, Bogen S. (2006a). A Molecular Model of Antigen Retrieval Using a Peptide Array. Am J Clin Pathol 125:91-98. [PubMed] [Google Scholar]
- Sompuram S, Vani K, Hafer L, Bogen S. (2006b). Antibodies Immunoreactive With Formalin-Fixed Tissue Antigens Recognize Linear Protein Epitopes. Am J Clin Pathol 125:82-90. [PubMed] [Google Scholar]
- Thomson T, Hayes M, Spinelli J, Hilland E, Sawrenko C, Phillips D, Dupuis B, Parker R. (2001). HER-2/neu in Breast Cancer: Interobserver Variability and Performance of Immunohistochemistry with 4 Antibodies Compared with Fluorescent In Situ Hybridization. Mod Pathol 14:1079-1086. [DOI] [PubMed] [Google Scholar]
- Tuominen V, Ruotoistenmaki S, Viitanen A, Jumppanen M, Isola J. (2010). ImmunoRatio: A publicly available web application for quantitative image analysis of estrogen receptor (ER), progesterone receptor (PR), and Ki-67. Breast Cancer Research 12:R56. [DOI] [PMC free article] [PubMed] [Google Scholar]
- Tuominen V, Tolonen T, Isola J. (2012). Immunomembrane: A publicly available web application for digital image analysis of HER2 immunohistochemistry. Histopathology 60:758-767. [DOI] [PubMed] [Google Scholar]
- Vani K, Sompuram S, Bogen S. (2008). National HER-2 Proficiency Test Findings Using Standardized Quantitative Controls: Characterization of Laboratory Failures. Arch Pathol Lab Med 132:211-216. [DOI] [PubMed] [Google Scholar]
- Westgard JO. (2010). Basic QC Practices, 3rd ed, Madison: Westgard Quality Corporation. [Google Scholar]


