Abstract
Many recreational beaches suffer from elevated levels of microorganisms, resulting in beach advisories and closures due to lack of compliance with Environmental Protection Agency guidelines. We conducted the first statewide beach water quality assessment by analyzing decadal records of fecal indicator bacteria (enterococci and fecal coliform) levels at 262 Florida beaches. The objectives were to depict synoptic patterns of beach water quality exceedance along the entire Florida shoreline and to evaluate their relationships with wave condition and geographic location. Percent exceedances based on enterococci and fecal coliform were negatively correlated with both long-term mean wave energy and beach slope. Also, Gulf of Mexico beaches exceeded the thresholds significantly more than Atlantic Ocean ones, perhaps partially due to the lower wave energy. A possible linkage between wave energy level and water quality is beach sand, a pervasive nonpoint source that tends to harbor more bacteria in the low-wave-energy environment.
Keywords: water quality, enterococci, fecal coliform, exceedance, wave energy level, recreational beaches
Graphical abstract
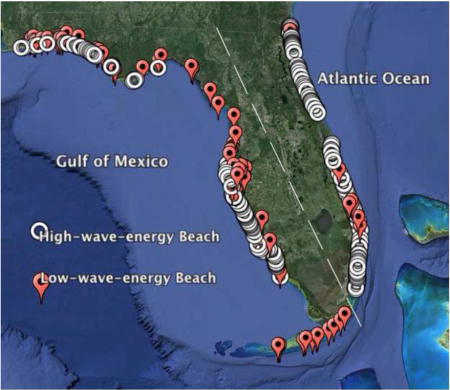
1. Introduction
In order to reduce waterborne diseases and protect human health at recreational beaches, water quality is routinely monitored through measurements of fecal indicator bacteria (FIB), as epidemiological studies have shown relationships between FIB levels and illness (e.g., Wade et al., 2003; Fleisher et al., 2010; Colford et al., 2012). In addition to traditionally known point sources of FIB such as sewage outfalls (e.g., Cabelli et al., 1982), many studies have identified beach sand as a ubiquitous and diffuse nonpoint source of FIB (e.g., Whitman et al., 2003; Shibata et al., 2004; Yamahara et al., 2007; Halliday and Gast, 2011; Byappanahalli et al., 2012). Among many environmental factors, waves are prevailing physical factors that influence the presence, transport, and distribution of contaminants in the beach environment (Boehm, 2003; Grant et al., 2005; Ge et al., 2012; Feng et al., 2013). At typical open-coast beaches, waves dominate the energetics of the nearshore environment (Komar, 1998). Wave breaking dissipates tremendous amount of energy in the relatively narrow surf zone (Inman et al., 1971), generates eddies (Clark et al., 2012; Feddersen, 2014), drives alongshore currents (Longuet-Higgins, 1970), and significantly increases eddy diffusivity and material mixing (Spydell et al., 2007; Brown et al., 2009). These processes may further affect the transport and dispersion of sediments (e.g., Reniers et al. 2013), pollutants (e.g., Grant et al., 2005), and larvae (e.g., Fujimura et al., 2014). Waves may also induce through-beach transport of bacteria via swash uprush and infiltration into the sand (Russell et al., 2012; Gast et al., 2015).
Florida, known as the Sunshine State, has hundreds of miles of sandy beaches along both Atlantic Ocean and Gulf of Mexico (GoM) coasts. These recreational beaches are important tourism and recreational resources. In 2012, coastal tourism and recreation generated approximately a third million jobs and also contributed $16.4 billion to the state’s economy (National Ocean Economics Program, 2014). The Florida Healthy Beaches Program (FHBP), a statewide program administrated by the Florida Department of Health, routinely monitors beach water quality in order to comply with U.S. Environmental Protection Agency (USEPA) regulations (USEPA, 1986 and 2012). All 34 coastal counties joined this program in 2000 and began to collect water samples every other week, transitioning in 2002 to sampling on a weekly basis. As a result, a decade-long dataset of continuous FIB observations has been produced across the entire Florida coast.
The unique FHBP water quality dataset allows us, for the first time, to study water quality patterns from a broad perspective, which cannot be achieved by traditional site-specific water quality assessments. To our knowledge, no prior study has analyzed this many beaches (262 beaches in this study), consisting of a variety of hydrologic and geographic features and spanning such a long coastline (approximately 2,000 km). The specific objectives of this study are: (1) to provide a synoptic and baseline assessment of beach water quality exceedance in the entire state of Florida; and (2) to evaluate relationships between water quality exceedance and two major environmental factors (i.e., wave energy level and geographic distribution).
2. Material and Methods
2.1 Fecal Indicator Bacteria Monitoring Data
FIB data were compiled from the archives of the Florida Department of Health. The datasets used in this study spanned nearly a decade, from August 2000 to December 2009, when both enterococci and fecal coliform were monitored. The original database included over 300 beaches; however, only 262 beaches with a minimum of 409 sampling events each (i.e., less than 10% missing samples) were retained for further analyses (see Figure 1 for beach locations). The same time frame was chosen to collect wave information for corresponding beaches (see Section 2.3).
Figure 1.
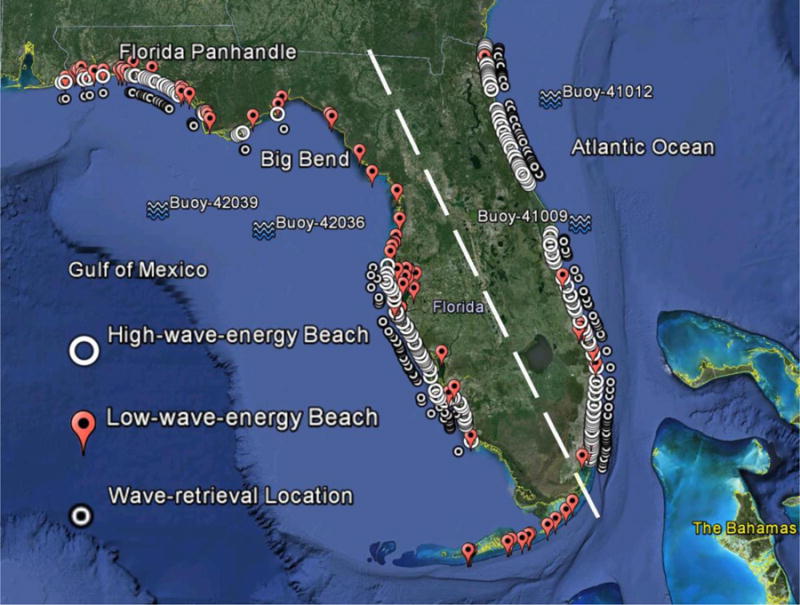
All 262 Florida recreational beaches in this study. Four National Data Buoy Center (NDBC) buoys (for wave observations) are illustrated by wave symbols. Locations of high- and low-wave-energy beaches and wave-retrieval locations (for high-wave-energy beaches) are demonstrated using white circles, red balloons, and black dots. The white dashed line separates Atlantic Ocean and GoM beaches. Big Bend and western Florida Panhandle are identified as water quality hotspots where some recreational beaches frequently exceed enterococci or fecal coliform thresholds. Base map is outputted from Google Earth Pro.
According to the sampling protocol of the Florida Department of Health, trained personnel from county health departments sampled beach water at waist depth in the morning. Samples were then processed by the standard membrane filtration method and FIB levels were expressed in colony-forming unit per 100 milliliters (CFU/100 mL). Samples below the detection limit were assigned a value of 0.5 CFU/100 mL, half of the detection limit of 1.0 CFU/100 mL.
The Florida county health departments issue health warnings or advisories when FIB levels exceed a set threshold level based on either geometric mean or single sample analyses (Table 1). Warnings are issued based on fecal coliform measures whereas advisories are issued based on enterococci measures. Given the high variability of the FIB levels observed at Florida beaches, in practice, health advisories and warnings are issued only when two consecutive water samples exceed corresponding single-sample thresholds. However, these resamples after exceedances were excluded from our analyses to eliminate bias towards exceedance events with multiple high FIB levels (Phillips et al., 2011).
Table 1.
Thresholds for beach warnings and advisories based on fecal coliform and enterococci levels, respectively. The single-sample thresholds are utilized in this study.
| Fecal Coliforma (CFU/100 ml) |
Enterococcib (CFU/100 ml) |
|
|---|---|---|
| Monthly Geometric Mean | ≥ 200 | ≥ 35 |
| Single-sample Threshold | ≥ 400 | ≥ 104 |
Source: the Florida Department of Environmental Protection surface water quality criteria;
Source: the USEPA Ambient Water Quality Criteria for Bacteria (1986).
In order to evaluate beach warnings or advisories, each measured FIB level (in CFU/100 mL) was converted to a binary value (either “exceedance” or “non-exceedance”) based on the single-sample thresholds (Table 1). The results for the whole decadal period were then reported as a percent exceedance, representing the percentage of the sampling points within that period exceeding 104 CFU/100 mL for enterococci or 400 CFU/100 mL for fecal coliform. Percent exceedance based on long-term monitoring records is a good metric to evaluate overall water health and water quality of recreational beaches and to conduct statistical comparisons among different groups of beaches.
2.2 Beach Classifications
The first beach classification is based on the geographic distribution (Figure 1). The Atlantic beaches are those along the Florida Atlantic coast, from northernmost Nassau County at the Florida-Georgia border through Miami-Dade County. The GoM beaches start from southernmost Monroe County (i.e., Florida Keys), along the concave GoM coastline, and end at Escambia County at the Florida-Alabama border. Note that all beaches of the Florida Keys were categorized under the GoM, consistent with the defined geographic boundary of the GoM (International Hydrographic Organization, 1953).
The second beach classification is based on the wave energy level, depending on the beach location relative to large water bodies and degree of sheltering from ocean waves (Figure 1). This approach utilized similar concepts that have been developed in the coastal or beach classification systems (Tanner, 1960; Davis and Hayes, 1984; Jackson et al., 2002; Nordstrom and Jackson, 2012). For simplicity, we divided Florida beaches into two types: high- versus low-wave-energy beaches. On one hand, high-wave-energy (exposed) beaches are directly open to the ocean or sea. They are frequently exposed to the offshore waves, and are typically more energetic with relatively high turbulence and material mixing. These beaches are located on the ocean side of barrier islands along the Florida Atlantic coast and some parts of the GoM coast. The wave climate of high-wave- energy beaches can be readily estimated from a global wave model (see Section 2.3). On the other hand, low-wave-energy (sheltered or fetch-limited) beaches are partially or fully sheltered from large wave action, and have short wind fetch distances. They hence have relatively calm water and low mixing rates. These beaches can be found in a variety of environments, including coastal bays and sounds, estuaries, straits, canals, lagoons protected by barrier islands, manmade structures (such as marinas), surrounded by salt marshes, and in the lee of islands or broad coral reefs (Jackson et al., 2002). Due to the complex environmental setting and geomorphic characteristics, the wave climate of this type cannot be directly estimated from a global wave model, but their wave heights are mostly small under non-storm conditions (Jackson et al., 2002). Google Earth images of typical high- and low-wave-energy Florida beaches are shown in the Supplement.
Combining the geography- and wave-energy-based classifications, four subclasses can be further defined as: Atlantic high-wave-energy (n = 96), Atlantic low-wave-energy (n = 10), GoM high-wave-energy (n = 80), and GoM low-wave-energy (n = 76).
2.3 Wave Statistics
Wave information was obtained through National Oceanic and Atmospheric Administration (NOAA) National Center for Environmental Prediction (NCEP) WAVEWATCH III global wave model hindcast using the Climate Forecast System Reanalysis Winds (Chawla et al., 2013). Along the U.S. east coast and GoM, this product provides a 1/15° (6–7 km) grid resolution wave hindcast every 3 hours. Modeled significant wave heights (hs) agree well with observations at four National Data Buoy Center (NDBC) stations (see Figure 1 for buoy locations), with the correlation coefficients all above 0.9 (See Supplement). Since wave energy is linearly proportional to the squared significant wave height, hs2 (Dean and Dalrymple, 1991), we calculated hs2 at an offshore location ~20 km (i.e., 3 model grid points) away from the high-wave-energy beach sites using a 2-dimensional bilinear interpolation (see Figure 1 for wave-retrieval locations). Finally, the mean wave energy of each beach was achieved by averaging time series of squared wave heights over the decadal study period. The offshore squared wave heights were used to represent beach wave climate due to model limitations in spatial resolution and underrepresentation of processes in the beach nearshore zone that is dominated by wave breaking and associated energy dissipation (Chawla et al., 2013). Because the global wave model cannot resolve low-wave-energy beaches, long-term mean wave energy levels were assumed to be zero. In relatively large bays or long waterways, although local winds (especially storm winds) or boat traffic may sometimes generate waves, such wave events are either small or sporadic, and their influence on long-term mean wave energy would be negligible.
2.4 Beach Slope
Wave breaking processes in the surf zone are strongly related to wave properties and also the beach profile (Komar, 1974). These processes can be scaled by a non-dimensional surf similarity parameter (also known as the Iribarren Number), which is the ratio of beach slope and deep-water wave steepness (Battjes, 1974). In this study, we calculated mean beach slope using an endpoint method and 3 arc-second (~90 m) bathymetric data of the NOAA National Geophysical Data Center U.S. Coastal Relief Model (http://www.ngdc.noaa.gov/mgg/coastal/crm.html). The slope was calculated from the elevation difference between two beach points. The landward starting point is located at the mean sea level waterline, and then extended normally offshore by a distance of 3 grid points (~270 m) to reach the seaward endpoint. The elevations of these two points were linearly interpolated from the bathymetry. Finally, we divided the elevation difference by the distance to obtain the dimensionless beach slope (α). In this study, α was assumed to be stable throughout the study period.
2.5 Statistical Analyses
Non-parametric Kruskal-Wallis analyses of variance (ANOVA) were conducted using the Matlab Statistical Toolbox (Mathworks, Natick, MA) to determine whether enterococci (or fecal coliform) percent exceedances are different, and whether percent exceedances based on two fecal indicators are different among different beach classes or subclasses. Non-parametric Spearman’s rank correlation coefficients (r) between percent exceedance, mean wave energy, and beach slope were calculated. All statistical results and relationships were deemed significant when p values were less than 0.01.
3. Results
3.1 Overall Patterns of Water Quality Exceedance
The majority of 262 Florida beaches have good water quality. About one third of the beaches (n = 86) exceed the enterococci threshold less than 1% and another one third (n = 92) are within the range of 1–3% exceedance (Figure 2a). The number of beaches in a particular exceedance range generally decreases with higher percent exceedances, except at the highest range where 10 beaches are grouped together as one category of more than 19% exceedance. Those beaches exceeding the enterococci (or fecal coliform) threshold more than 15% of the time are “hotspot” beaches with most frequent exceedances and consequently worst water quality ratings in the state. The hotspot beaches cluster at two geographic regions, Big Bend and western Florida Panhandle, along the northern GoM coast (Figure 1 and Figure 3a).
Figure 2.
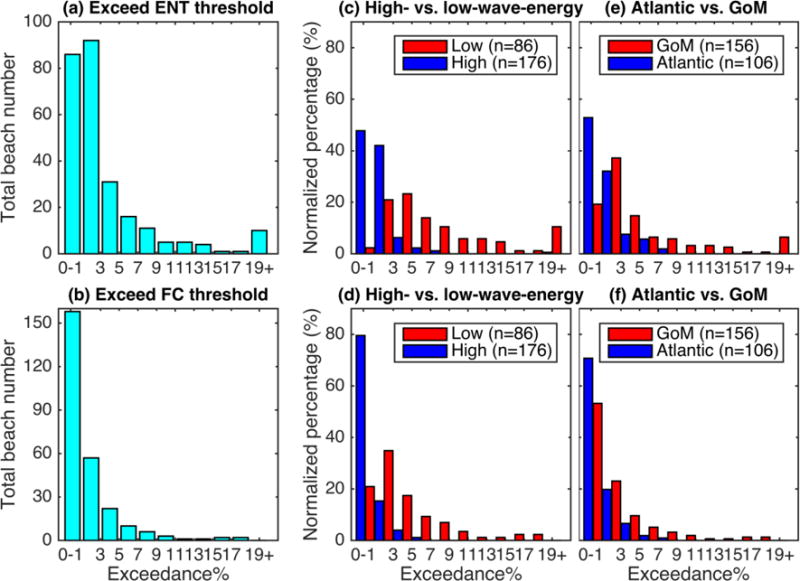
Beaches exceeding the enterococci (upper panels) and fecal coliform (lower panels) thresholds grouped by the percent exceedance range. Panel (a) and (b) illustrate beach number histograms for all 262 beaches. Panels (c) and (d) compare the percentages of low- (red bars) versus high-wave-energy (blue bars) beaches normalized by the total beach number within each group. Panels (e) and (f) compare the normalized percentages of GoM (red bars) versus Atlantic (blue bars) beaches.
Figure 3.
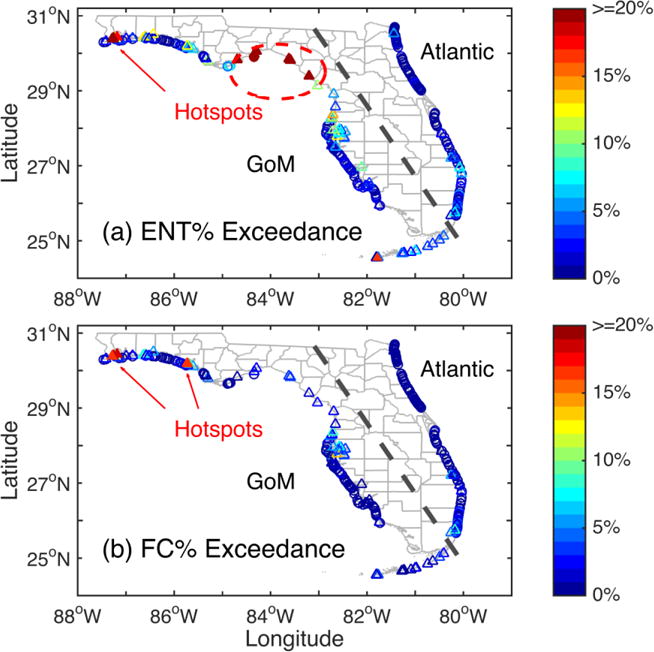
Percentage of water samples exceeding regulatory thresholds at 262 Florida beaches based on (a) enterococci and (b) fecal coliform levels observed between August 2000 and December 2009. The circles and triangles indicate high- and low-wave-energy beaches, respectively. The color bars illustrate percent exceedances. The dashed line separates Atlantic and GoM beaches. Hotspots of persistent water quality exceedances (> 15%) are highlighted with filled markers.
The histogram for fecal coliform exceedance shows similar trends as enterococci (Figure 2b). About 60% (n = 158) and 22% (n = 57) of the beaches have 0–1% and 1–3% exceedances, respectively. However, none exceeds more than 19% of the time, and interestingly, the Big Bend beaches do not emerge as hotspots based on fecal coliform (Figure 3b).
3.2 Comparison of Exceedance: High- versus Low-wave-energy Beaches
The vast majority of the high-wave-energy beaches (n = 176) exceed less than 3% of the time based on enterococci (n = 157) and fecal coliform (n = 167), respectively (combining first two blue bars in Figure 2c and 2d). For high-wave-energy beaches, only 3 beaches exceed the enterococci threshold more than 7% of the time (Figure 2c) and none is above 7% exceedance using fecal coliform (Figure 2d). On the contrary, only 2 low-wave-energy beaches exceed the enterococci threshold less than 1% of the time, whereas 9 beaches exceed more than 19% (Figure 2c). ANOVA tests show that low-wave-energy beaches have significantly higher percent exceedances than high-wave-energy ones using both fecal indicators (Table 2). The trend that low-wave-energy beaches tend to have higher exceedances also holds among the Atlantic beaches, as well as those in the GoM (Table 2; Figure 4).
Table 2.
Mean (± standard deviation, STD) enterococci (ENT) and fecal coliform (FC) percent exceedances and Kruskal-Wallis ANOVA of high-wave-energy (HWE), low-wave-energy (LWE), Atlantic, and GoM beaches, and four beach subclasses: Atlantic high-wave-energy (AH), Atlantic low-wave-energy (AL), GoM high-wave-energy (GH), and GoM low-wave-energy (GL).
| Beach class or subclass | ENT% | FC% | ANOVA: ENT% vs. FC% |
||
|---|---|---|---|---|---|
| Mean (± STD) | ANOVA | Mean (± STD) | ANOVA | ||
| HWE (n = 176) | 1.56 (±2.05) | p < 0.01 | 0.69 (±1.13) | p < 0.01 | p < 0.01 |
| LWE (n = 86) | 8.04 (±7.50) | 3.99 (±4.14) | p < 0.01 | ||
| Atlantic (n = 106) | 1.55 (±1.74) | p < 0.01 | 0.94 (±1.50) | p < 0.01 | p < 0.01 |
| GoM (n = 156) | 5.14 (±6.63) | 2.34 (±3.54) | p < 0.01 | ||
| AH (n = 96) | 1.27 (±1.38) | p < 0.01 | 0.75 (±1.25) | p < 0.01 | p < 0.01 |
| AL (n = 10) | 4.27 (±2.52) | 2.76 (±2.42) | p = 0.16 | ||
| GH (n = 80) | 1.92 (±2.61) | p < 0.01 | 0.62 (±0.96) | p < 0.01 | p < 0.01 |
| GL (n = 76) | 8.53 (±7.80) | 4.15 (±4.30) | p < 0.01 | ||
| AH vs. GH | – | p < 0.01 | – | p = 0.19 | – |
| AL vs. GL | – | p = 0.10 | – | p = 0.40 | – |
Figure 4.
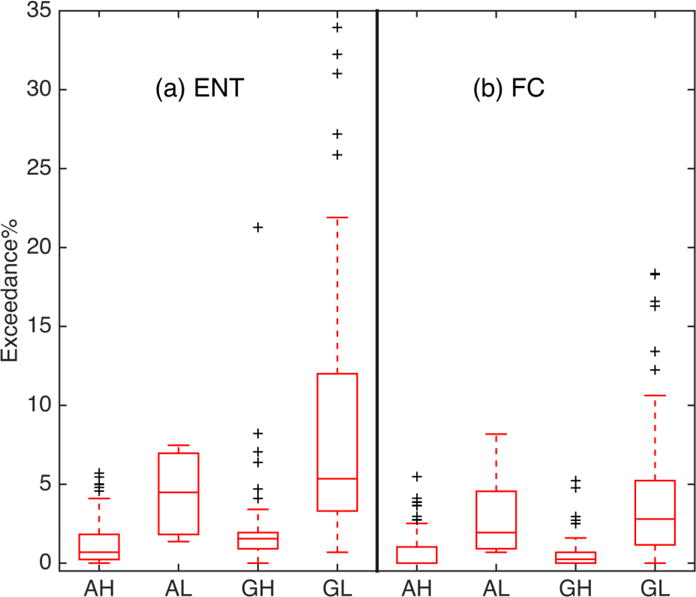
Box-whisker plot showing percent exceedances of four beach subclasses: Atlantic high-wave-energy (AH), Atlantic low-wave-energy (AL), GoM high-wave-energy (GH), and GoM low-wave-energy (GL) using (a) enterococci (ENT) and (b) fecal coliform (FC) thresholds, respectively. On each red box, the central line represents median, the lower and upper edges are 25th and 75th percentiles, the whiskers extend to the most extreme data points, and outliers are illustrated in black crosses.
3.3 Comparison of Exceedance: Atlantic versus GoM Beaches
The occurrence of FIB exceedance demonstrates geographical heterogeneities. Atlantic beaches tend to have better water quality than those in the GoM in terms of percent exceedance. The overall Atlantic beaches exceed the enterococci and fecal coliform thresholds less frequently than the GoM beaches (p < 0.01; Table 2). Notably, all 10 hotspot beaches are located in the GoM side, whereas none of the Atlantic beaches exceeds FIB thresholds more than 9% of the time (Figure 2e, 2f and 3). A significant difference is found in the enterococci percent exceedance of Atlantic versus GoM high-wave-energy beaches (p < 0.01; AH vs. GH in Table 2), but not fecal coliform (p = 0.19). There is no significant difference between Atlantic and GoM low-wave-energy beaches (AL vs. GL in Table 2).
3.4 Comparison of Exceedance: Enterococci versus Fecal Coliform
The water quality exceedance also differs in terms of fecal indicators. Mean enterococci percent exceedance of all 262 beaches is significantly higher than fecal coliform (p < 0.01). In addition, among all beach classes and subclasses, enterococci percent exceedances are all significantly higher than fecal coliform (p < 0.01; Table 2), except for the Atlantic low-wave-energy group (p = 0.16).
3.5 Relationships between Water Quality Exceedance and Mean Wave Energy
Significant negative correlations were found between enterococci percent exceedance and mean wave energy (Figure 5a) among 262 beaches (r = −0.66, p < 0.01; see Supplement Figure S4a). A similar negative correlation was found between fecal coliform percent exceedance and mean wave energy (r = −0.55, p < 0.01; Figure S4b). In addition, beach slope (Figure 5b) was negatively correlated with both enterococci (r = −0.37, p < 0.01; Figure S4c) and fecal coliform exceedances (r = −0.28, p < 0.01; Figure S4d).
Figure 5.
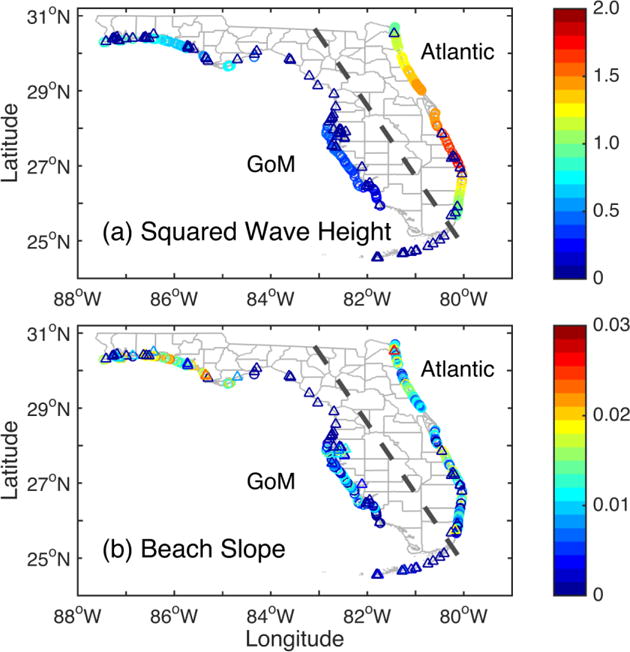
(a) Long-term mean squared wave height hs2 (m2) and (b) beach slope α. The circles and triangles indicate high- and low-wave-energy beaches, respectively. The dashed line separates Atlantic and GoM beaches.
4. Discussion
4.1 Relate Spatial Differences in Water Quality Exceedance to Wave Energy Level
The differences in water quality exceedance between Florida Atlantic and GoM beaches may be partially explained by their differences in wave energy levels. Along the Florida Atlantic coast, most are high-wave-energy beaches (n = 96), while low-wave-energy beaches are rarely seen (n = 10). On the contrary, there are 76 low-wave-energy beaches residing in the GoM, accounting for nearly half of the beaches there.
Generally speaking, low-wave-energy and mild-sloping beaches have relatively higher water quality exceedances (see Table 2 and Figure 6). In contrast, lower percent exceedances occur more often in high-wave-energy and steep-sloping beaches. More significantly, hotspot beaches of persistent enterococci exceedances in the Big Bend correspond to minimal wave energies and very flat beach profiles (See Figures 3a and 5). The Big Bend is characterized by extensive areas of salt marshes, swamps, estuaries and very limited beach development, and was previously described as a “zero energy” shoreline (Tanner, 1960). Interestingly, the same area is not characterized by persistent fecal coliform exceedances (Figure 3b), suggesting that the local physical, chemical, or biological characteristics may affect the specific FIB differently.
4.2 Beach Sand: A Possible Link between Wave Energy Level and Water Quality Exceedance
A possible link between wave energy level and water quality exceedance is beach sand, widely known as a diffusive nonpoint source and also a habitat for bacteria (Yamahara et al. 2007; Whitman et al., 2014). Phillips et al. (2011) showed that bacterial levels in sand correlated with bacterial levels in water for eight beaches in Florida. For these eight beaches, supratidal sands were observed to have higher bacterial levels as compared to intertidal and subtidal sands, suggesting that the sand zone just outside the area of direct tide and/or wave actions was characterized by relatively high bacterial levels. The settlement and regrowth capability of bacteria in the sand reservoir is presumably restricted when sediment is frequently reworked by wave breaking and energy dissipation in the nearshore (Yamahara et al., 2007). The wave energy patterns revealed in this study are supported by a prior shoreline change study, showing that the more energetic Florida Atlantic coast has much larger longshore sediment transport rate than the less energetic GoM coast (Absalonsen and Dean, 2011). At high-wave-energy beaches, even if microbial pollution may occur in the nearshore zone, it is unlikely that the pollutants accumulate or deposit due to vigorous nearshore mixing and/or strong surfzone currents (Grant et al., 2005; Rippy et al., 2013a).
In contrast, minimal wave energy and mild beach slope, particularly for the Big Bend beaches, may be conducive to bacterial settlement, aggregation, and regrowth in the sand, especially under certain favorable environmental conditions, such as tide-induced intermittent wetting and drying (Yamahara et al., 2009). The surrounding marshy and muddy shoreline and river discharge may function as bacterial sources and may also provide necessary nutrients for bacterial growth within the sand (Litton et al., 2010). Ideally, sediment samples should be analyzed from the Big Bend beach sites in order to test the hypothesis that low energy beaches are conducive to bacterial accumulation.
The above hypothesis linking wave energy level to bacterial abundance in the beach sand and water may be supported by prior multi-beach studies in California (Yamahara et al., 2007). This sand survey of 55 California beaches found that enterococci levels of the sand are highest at sheltered beaches associated with nearby bacterial sources (Yamahara et al., 2007). Nevertheless, statewide sand surveys are needed to confirm the trends for Florida beaches and to test the overarching hypothesis that low-wave-energy beaches tend to have high sand-associated bacterial levels, and in consequence recreational water may be susceptible to such diffuse sources.
4.3 Beach Management Implication
Microbial water quality exhibits extreme spatiotemporal variability (Boehm et al., 2002; Boehm, 2007; Feng et al., 2015), which significantly impact beach management decisions (Enns et al., 2012). The site-specific water quality issues may result from a combination of various interacting biotic and abiotic factors (Whitman et al., 2014) and, in most cases, cannot be explained exclusively by wave and geographic factors. Nevertheless, this study demonstrated the utilization of geographic setting and wave energy level to explain the general patterns of water quality exceedances among a large number of beaches. Additional work is needed to evaluate other factors that may also correlate with beach water quality. For instance, beach management likely plays a critical role in affecting bacterial safety and pollution in coastal waters. Beach management can influence sources of bacteria through controls on stormwater, trash disposal, presence of animals, beach grooming, and beach nourishment (Rippy et al., 2013b; Hernandez et al., 2014). Other factors to be considered in the future include the influence of rivers and canals and localized effects from nearby marinas and piers.
5. Conclusions
This study is a first attempt of baseline and synoptic microbial water quality assessment in the state of Florida, based on decadal records of weekly monitored enterococci and fecal coliform levels at 262 recreational beaches. Results show that wave energy level and geographic distribution generally correlate with water quality exceedances. Notably, we have identified hotspot beaches of persistent water quality exceedances, where more attention should be paid in regulating potential pollutant sources, implementing stringent monitoring programs, improving beach management practices, and advising the public of water quality and human health risks. Further studies are needed to evaluate the causes of persistently elevated bacterial levels at hotspot beaches and to track ultimate sources of bacteria and possibly pathogens.
Supplementary Material
Highlights.
Synoptic and baseline water quality patterns of 262 Florida beaches were assessed.
Bacterial exceedances negatively correlated with mean wave energy and beach slope.
Gulf of Mexico beaches had higher bacterial exceedances than Atlantic Ocean ones.
Big Bend and west Florida Panhandle beaches were hotspots of high exceedances.
Acknowledgments
This work is funded by the NSF-NIEHS Oceans and Human Health Program (NIEHS # P50 ES12736 and NSF #OCE0432368/0911373/1127813). We thank David Polk of Florida Department of Health and Samir Elmir of Miami-Dade County Health Department for providing historical water quality monitoring data. This work benefits from insightful discussions with John D. Wang (University of Miami) and Lora E. Fleming (University of Exeter Medical School). Comments from an anonymous reviewer help improve the quality and readability of the paper.
Footnotes
Publisher's Disclaimer: This is a PDF file of an unedited manuscript that has been accepted for publication. As a service to our customers we are providing this early version of the manuscript. The manuscript will undergo copyediting, typesetting, and review of the resulting proof before it is published in its final citable form. Please note that during the production process errors may be discovered which could affect the content, and all legal disclaimers that apply to the journal pertain.
References
- Absalonsen L, Dean R. Characteristics of the shoreline change along Florida sandy beaches with an example for Palm Beach County. J Coast Res. 2011;27:16–26. [Google Scholar]
- Battjes JA. Surf similarity. Proceedings of 14th International Conference on Coastal Engineering, American Society of Civil Engineers. 1974;1:467–479. [Google Scholar]
- Boehm AB. Model of microbial transport and inactivation in the surf zone and application to field measurements of total coliform in Northern Orange County, California. Environ Sci Technol. 2003;37:5511–5517. doi: 10.1021/es034321x. [DOI] [PubMed] [Google Scholar]
- Boehm AB. Enterococci concentrations in diverse coastal environments exhibit extreme variability. Environ Sci Technol. 2007;41:8227–8232. doi: 10.1021/es071807v. [DOI] [PubMed] [Google Scholar]
- Boehm AB, Grant SB, Kim JH, Mowbray SL, McGee CD, Clark CD, Foley DM, Wellman DE. Decadal and shorter period variability of surf zone water quality at Huntington Beach, California. Environ Sci Technol. 2002;36:3885–3892. doi: 10.1021/es020524u. [DOI] [PubMed] [Google Scholar]
- Brown J, MacMahan J, Reniers A, Thornton E. Surf zone diffusivity on a rip-channeled beach. J Geophys Res Ocean. 2009;114:C11015. doi: 10.1029/2008JC005158. 2009. [DOI] [Google Scholar]
- Byappanahalli MN, Nevers MB, Korajkic A, Staley ZR, Harwood VJ. Enterococci in the environment. Microbiol Mol Biol Rev. 2012;76:685–706. doi: 10.1128/MMBR.00023-12. [DOI] [PMC free article] [PubMed] [Google Scholar]
- Cabelli VJ, Dufour AP, McCabe LJ, Levin MA. Swimming-associated gastroenteritis and water quality. Am J Epidemiol. 1982;115:606–616. doi: 10.1093/oxfordjournals.aje.a113342. [DOI] [PubMed] [Google Scholar]
- Chawla A, Spindler DM, Tolman HL. Validation of a thirty year wave hindcast using the Climate Forecast System Reanalysis winds. Ocean Model. 2013;70:189–206. [Google Scholar]
- Clark DB, Elgar S, Raubenheimer B. Vorticity generation by short-crested wave breaking, Geophys. Res Lett. 2012;39:L24604. doi: 10.1029/2012GL054034. [DOI] [Google Scholar]
- Colford JM, Schiff KC, Griffith JF, Yau V, Arnold BF, Wright CC, Gruber JS, Wade TJ, Burns S, Hayes J, McGee C, Gold M, Cao Y, Noble RT, Haugland R, Weisberg SB. Using rapid indicators for Enterococcus to assess the risk of illness after exposure to urban runoff contaminated marine water. Water Res. 2012;46:2176–2186. doi: 10.1016/j.watres.2012.01.033. [DOI] [PMC free article] [PubMed] [Google Scholar]
- Davis RA, Hayes MO. What is a wave-dominated coast? Mar Geol. 1984;60:313–329. [Google Scholar]
- Dean RG, Dalrymple RA. Water wave mechanisms for engineers and scientists. World Sci 1991 [Google Scholar]
- Enns AA, Vogel LJ, Abdelzaher AM, Solo-Gabriele HM, Plano LRW, Gidley ML, Phillips MC, Klaus JS, Piggot AM, Feng Z, Reniers AJHM, Haus BK, Elmir SM, Zhang Y, Jimenez NH, Abdel-Mottaleb N, Schoor ME, Brown A, Khan SQ, Dameron AS, Salazar NC, Fleming LE. Spatial and temporal variation in indicator microbe sampling is influential in beach management decisions. Water Res. 2012;46:2237–2246. doi: 10.1016/j.watres.2012.01.040. [DOI] [PMC free article] [PubMed] [Google Scholar]
- Feddersen F. The Generation of Surfzone Eddies in a Strong Alongshore Current. J Phys Oceanogr. 2014;44:600–617. doi: http://dx.doi.org/10.1175/JPO-D-13-051.1. [Google Scholar]
- Feng Z, Reniers A, Haus BK, Solo-Gabriele H. Modeling sediment-related enterococci loading, transport and inactivation at an embayed non-point source beach. Water Resour Res. 2013;49:1–20. [Google Scholar]
- Feng Z, Reniers A, Haus BK, Solo-Gabriele HM, Wang JD, Fleming LE. A predictive model for microbial counts on beaches where intertidal sand is the primary source. Mar Pollut Bull. 2015;94:37–47. doi: 10.1016/j.marpolbul.2015.03.019. [DOI] [PMC free article] [PubMed] [Google Scholar]
- Fleisher JM, Fleming LE, Solo-Gabriele HM, Kish JK, Sinigalliano CD, Plano L, Elmir SM, Wang JD, Withum K, Shibata T, Gidley ML, Abdelzaher A, He G, Ortega C, Zhu X, Wright M, Hollenbeck J, Backer LC. The BEACHES Study: health effects and exposures from non-point source microbial contaminants in subtropical recreational marine waters. Int J Epidemiol. 2010;39:1291–1298. doi: 10.1093/ije/dyq084. [DOI] [PMC free article] [PubMed] [Google Scholar]
- Fujimura AG, Reniers AJHM, Paris CB, Shanks AL, MacMahan JH, Morgan SG. Numerical simulations of larval transport into a rip-channel surf zone. Limno Oceanogr. 2014;59(4):1434–1447. [Google Scholar]
- Gast RJ, Elgar S, Raubenheimer B. Observations of transport of bacteria-like microspheres through beach sand. Cont Shelf Res. 2015;97:1–6. [Google Scholar]
- Ge Z, Whitman RL, Nevers MB, Phanikumar MS. Wave-induced mass transport affects daily Escherichia coli fluctuations in nearshore water. Environ Sci Technol. 2012;46:2204–2211. doi: 10.1021/es203847n. [DOI] [PubMed] [Google Scholar]
- Grant SB, Kim JH, Jones BH, Jenkins SA, Wasyl J, Cudaback C. Surf zone entrainment, along-shore transport, and human health implications of pollution from tidal outlets. J Geophys Res. 2005;110:C10025. [Google Scholar]
- Halliday E, Gast RJ. Bacteria in beach sands: an emerging challenge in protecting coastal water quality and bather health. Environ Sci Technol. 2011;45:370–379. doi: 10.1021/es102747s. [DOI] [PMC free article] [PubMed] [Google Scholar]
- Hernandez RJ, Hernandez Y, Jimenez NH, Piggot AM, Klaus JS, Feng Z, Reniers A, Solo-Gabriele HM. Effects of full-scale beach renovation on fecal indicator levels in shoreline sand and water. Water Res. 2014;48:579–591. doi: 10.1016/j.watres.2013.10.020. [DOI] [PMC free article] [PubMed] [Google Scholar]
- Inman DL, Tait RJ, Nordstrom CE. Mixing in the Surf Zone. J Geophys Res Ocean. 1971;76:3493–3514. [Google Scholar]
- International Hydrographic Organization. Limits of Oceans and Seas. (3rd) 1953 [Google Scholar]
- Jackson NL, Nordstrom KF, Eliot I, Masselink G. “Low energy” sandy beaches in marine and estuarine environments: a review. Geomorphology. 2002;48:147–162. [Google Scholar]
- Komar PD. Beach processes and sedimentation. second. Prentice-Hall; New Jersey, USA: 1998. p. 544. [Google Scholar]
- Litton RM, Ahn JH, Sercu B, Holden PA, Sedlak DL, Grant SB. Evaluation of chemical, molecular, and traditional markers of fecal contamination in an effluent dominated urban stream. Environ Sci Technol. 2010;44:7369–7375. doi: 10.1021/es101092g. [DOI] [PubMed] [Google Scholar]
- Longuet-Higgins MS. Longshore currents generated by obliquely incident sea waves. J Geophys Res. 1970;75:6778–6789. [Google Scholar]
- National Ocean Economics Program (NOEP) Coastal and Ocean Economic Summaries of the Coastal States, in State of the US Ocean and Coastal Economies 2014. Monterey, CA: 2014. Center for the Blue Economy, Monterey Institute of International Studies. [Google Scholar]
- Phillips MC, Solo-Gabriele HM, Piggot AM, Klaus JS, Zhang Y. Relationships between sand and water quality at recreational beaches. Water Res. 2011;45:6763–6739. doi: 10.1016/j.watres.2011.10.028. [DOI] [PMC free article] [PubMed] [Google Scholar]
- Nordstrom KF, Jackson NL. Physical processes and landforms on beaches in short fetch environments in estuaries, small lakes and reservoirs: A review. Earth-Science Rev. 2012;111:232–247. [Google Scholar]
- Phillips MC, Solo-Gabriele HM, Piggot AM, Klaus JS, Zhang Y. Relationships between sand and water quality at recreational beaches. Water Res. 2011;45:6763–6739. doi: 10.1016/j.watres.2011.10.028. [DOI] [PMC free article] [PubMed] [Google Scholar]
- Reniers A, Gallagher EL, MacMahan JH, Brown JA, van Rooijen AA, van Thiel de Vries J, van Prooijen BC. Observations and modeling of steep-beach grain-size variability. J Geophys Res. 2013;118:577–591. [Google Scholar]
- Rippy MA, Franks PJS, Feddersen F, Guza RT, Moore DF. Physical dynamics controlling variability in nearshore fecal pollution: fecal indicator bacteria as passive particles. Mar Pollut Bull. 2013a;66:151–157. doi: 10.1016/j.marpolbul.2012.09.030. [DOI] [PubMed] [Google Scholar]
- Rippy MA, Franks PJS, Feddersen F, Guza RT, Warrick JA. Beach nourishment impacts on bacteriological water quality and phytoplankton bloom dynamics. Environ Sci Technol. 2013b;47:6146–6154. doi: 10.1021/es400572k. [DOI] [PubMed] [Google Scholar]
- Russell TL, Yamahara KM, Boehm AB. Mobilization and transport of naturally occurring enterococci in beach sands subject to transient infiltration of seawater. Environ Sci Technol. 2012;46:5988–5996. doi: 10.1021/es300408z. [DOI] [PubMed] [Google Scholar]
- Shibata T, Solo-Gabriele HM, Fleming LE, Elmir S. Monitoring marine recreational water quality using multiple microbial indicators in an urban tropical environment. Water Res. 2004;38:3119–3131. doi: 10.1016/j.watres.2004.04.044. [DOI] [PMC free article] [PubMed] [Google Scholar]
- Spydell M, Feddersen F, Guza RT, Schmidt WE. Observing Surf-Zone Dispersion with Drifters. J Phys Oceanogr. 2007;37:2920–2939. doi: 10.1175/2007JPO3580.1. [DOI] [Google Scholar]
- Tanner W. Florida coastal classification. Gulf Coast Assoc. Geol Soc Trans. 1960:259–266. [Google Scholar]
- Thupaki P, Phanikumar M, Schwab DJ, Nevers MB, Whitman RL. Evaluating the role of sediment bacteria interactions on Escherichia coli concentrations at beaches in Southern Lake Michigan. J Geophys Res. 2013;118:1–17. [Google Scholar]
- USEPA. Ambient water quality criteria. Washington DC: U.S. Environmental Protection Agency; 1986. (EPA 440/5-84-002). [Google Scholar]
- USEPA. Recreational water quality criteria. Washington DC: U.S. Environmental Protection Agency; 2012. [Google Scholar]
- Wade TJ, Nitika P, Eisenberg JNS, Colford JM. Do US Environmental Protection Agency water quality guidelines for recreational waters prevent gastrointestinal illness? a systematic review and meta-analysis. Environ Health Perspect. 2003;1111:1102–1109. doi: 10.1289/ehp.6241. [DOI] [PMC free article] [PubMed] [Google Scholar]
- Whitman R, Nevers M. Foreshore sand as a source of Escherichia coli in nearshore water of a Lake Michigan beach. Appl Environ Microbiol. 2003;69:5555–5562. doi: 10.1128/AEM.69.9.5555-5562.2003. [DOI] [PMC free article] [PubMed] [Google Scholar]
- Whitman RL, Harwood VJ, Edge TA, Nevers MB, Byappanahalli M, Vijayavel K, Brandão J, Sadowsky MJ, Alm EW, Crowe A, Ferguson D, Ge Z, Halliday E, Kinzelman J, Kleinheinz G, Przybyla-Kelly K, Staley C, Staley Z, Solo-Gabriele HM. Microbes in beach sands: integrating environment, ecology and public health. Rev Environ Sci Bio/Technology. 2014 doi: 10.1007/s11157-014-9340-8. [DOI] [PMC free article] [PubMed] [Google Scholar]
- Yamahara KM, Layton BA, Santoro AE, Boehm AB. Beach sands along the California coast are diffuse sources of fecal bacteria to coastal waters. Environ Sci Technol. 2007;41:4515–4521. doi: 10.1021/es062822n. [DOI] [PubMed] [Google Scholar]
- Yamahara KM, Walters SP, Boehm AB. Growth of enterococci in unaltered, unseeded beach sands subjected to tidal wetting. Appl Environ Microbiol. 2009;75:1517–1524. doi: 10.1128/AEM.02278-08. [DOI] [PMC free article] [PubMed] [Google Scholar]
Associated Data
This section collects any data citations, data availability statements, or supplementary materials included in this article.


