Abstract
Understanding the hierarchical organization of molecules and organelles within the interior of large eukaryotic cells is a challenge of fundamental interest in cell biology. We are using ion-abrasion scanning electron microscopy (IA-SEM) to visualize this hierarchical organization in an approach that combines focused ion-beam milling with scanning electron microscopy. Here, we extend our previous studies on imaging yeast cells to image subcellular architecture in human melanoma cells and melanocytes at resolutions as high as ~6 and ~20 nm in the directions parallel and perpendicular, respectively, to the direction of ion-beam milling. The 3D images demonstrate the striking spatial relationships between specific organelles such as mitochondria and membranes of the endoplasmic reticulum, and the distribution of unique cellular components such as melanosomes. We also show that 10 nm-sized gold particles and quantum dot particles with 7 nm-sized cores can be detected in single cross-sectional images. IA-SEM is thus a useful tool for imaging large mammalian cells in their entirety at resolutions in the nanometer range.
Keywords: Automated 3D imaging, Melanoma detection, Mitochondrial architecture, Dual beam microscopy, Cancer imaging
1. Introduction
A wide variety of microscopic and spectroscopic methods already exist for imaging intact cells and their components: modern fluorescence microscopic methods provide versatile tools for imaging the distributions of labeled proteins at spatial resolutions in the micrometer range, while emerging methods in electron tomography can be used to image the arrangement of protein assemblies at ~5 nm resolution in regions of cells with thicknesses <1 μm (McIntosh et al., 2005 and Subramaniam, 2005). There is, however, a genuine need for technologies that can be used for rapid 3D imaging of large mammalian cells to provide information at nanometer resolution, since the availability of such methods could revolutionize our understanding of the cell and organelle function at the molecular level. Current methods to image the interior of eukaryotic cells with thicknesses in the 5–100 μm range at spatial resolutions better than ~200 nm require preparation of thin sections for analysis by transmission electron microscopy (TEM), which can be combined with immuno-electron microscopy to obtain information on molecular localization (McIntosh, 2007 and Zhang et al., 2007). Three-dimensional images of a large eukaryotic cell can be built up by serial sectioning of this kind (Noske et al., 2008), but this is a technically tedious and slow approach, which could limit its routine application.
To overcome these limitations, we have been developing a strategy for 3D imaging of biological specimens which combines iterative removal of material from the surface of a bulk specimen using focused ion-beam milling with imaging of the newly exposed surface using scanning electron microscopy. In our first report using this approach (ion-abrasion scanning electron microcopy or IA-SEM) we were able to demonstrate imaging at resolutions of ~0.1–0.2 μm (Heymann et al., 2006) using both plastic-embedded and frozen yeast cells. Studies extending strategy for imaging fixed tissues have also been reported recently (Knott et al., 2008). While the prospect of imaging frozen cells offers, in principle, unique opportunities to investigate subcellular architecture in the absence of artifacts that may be introduced by fixatives and stains, there are still many obstacles such as specimen charging that must be overcome for this to be successful, and sublimation of ice near the surface is still required to generate useful image contrast. However, for exploring subcellular architecture at resolutions in the range of tens of nanometers, there is considerable value to using plastic-embedded, fixed and stained cells as has been done for over five decades in cell biology. An important question relevant to investigating subcellular architecture is whether IA-SEM based approaches can be extended to obtain 3D resolutions in the nanometer range, especially since the precise nature of the local damage caused by the focused ion beam at each milling step is presently unknown. Here, we show that large mammalian cells can be imaged at resolutions of ~20-nm in the z-direction (direction of section removal), and ~6 nm in the x – y plane (plane of section removal), suggesting that IA-SEM can be a very useful strategy to map the 3D distribution of membrane-bound organelles in large mammalian cells. We also show that individual gold and quantum dot particles can be localized in the images, indicating that ultrastructural information obtained by IA-SEM can be combined with molecular localization to obtain composite images at resolutions intermediate to those that can be obtained by electron tomography and confocal light microscopy.
2. Methods
2.1. Preparation of plastic-embedded melanoma and melanocyte cells
Cells from the human melanoma cell line, MNT-1, or melanocyte cultures (obtained from Dr. Vincent Hearing, NCI Bethesda, MD) were grown on 10 cm culture dishes at 37 °C, 10%o CO2 in DMEM medium (Invitrogen, Carlsbad, CA) containing 10% fetal bovine serum (Hyclone, Logan, UT), 1% l-glutamine (Invitrogen) and 1% penicillin/streptomycin (Invitrogen) to about 70% confluence. For plastic embedding, cells were fixed with 2.5% glutaraldehyde in 0.1 M cacodylate (pH 7.2) at room temperature followed by osmication using reduced, aqueous osmium tetroxide (2% osmium tetroxide, 1.5% Fe(II)(CN)6 2H2O). Cells were then mechanically dislodged and processed for conventional embedding in EMBed-812 (EMS, Hatfield, PA) following the supplier's protocol. For uptake experiments, cells were grown under standard conditions to about 70% confluence. QuantumDot conjugate (7 nm core, Invitrogen) or 15-nm BSA-gold (EMS, Hatfield, PA) was first pre-bound to cells at 4 °C for 10 min and uptake then induced by incubation for 30 min at 37 °C. Cells were processed for TEM and SEM analysis as described above. For pre-embedding immunolabeling with a polyclonal anti-Pmel17 antibody (Valencia et al., 2006) specific for the C-terminal region (αPEP13h), MNT-1 cells were grown as described above after seeding on glass chamber slides. At about 70% confluence, cells were incubated with paraformaldehyde (4% in 0.1 M cacodylate buffer) overnight. Excess aldehyde was quenched with 35 mM glycine and cells were then permeabilized with 0.5% Triton X-100 for 5 min at room temperature. Prior to antibody labeling, cells were treated with 1% fish-gelatin, 0.1%) saponin to minimize non-specific binding.
2.2. Ion-abrasion SEM procedures
Resin blocks were physically processed as described (Heymann et al., 2006). Briefly, the tops of resin blocks were trimmed to a pyramidal shape using a razor blade with block faces of about 2 square millimeters in area. The surface was smoothened by sectioning using a conventional diamond knife. The entire pyramidal block was removed and mounted with the wider base onto an SEM stub using silver paint such that the newly prepared flat surface of the resin block pointed upwards, perpendicular to the electron column. Prior to IA-SEM analysis, specimen quality was inspected routinely by TEM imaging. For this purpose, 70–100 nm sections were prepared by microtome sectioning, collected on carbon-coated 200 mesh copper grids and stained for 5 min with 2% aqueous uranyl acetate, followed by staining for 2 min with 1 mM lead citrate. Images were collected at 120 kV (Tecnai 12, FEl) using a 2k × 2k CCD camera (Gatan, Pleasanton, CA). Once it was verified that cells were properly preserved as assessed by TEM imaging, tailored block surfaces were coated with platinum–palladium and mounted on the stage of a Nova 200 Nanolab (FEI Eindhoven, NL). On a selected area, typically a ~1 μm layer of platinum was deposited using a gas injector system in the main specimen chamber to provide a smooth, conducting surface. Cross-sections were prepared using the focused ion beam (gallium source) at 30 kV and beam currents ranging between 0.5 and 7.0 nA. Secondary electron scanning images were typically recorded at accelerating voltages of 3–5 kV in the immersion lens mode, using an Everhard–Thornley detector. 2D image stacks were acquired using the ‘slice-and-view’ imaging module (FEI) and nominal inter-image distances were set to the desired values ranging from 10 to 200 nm by controlling the extent of deflection of the ion beam between successive steps.
2D SEM image stacks were registered either by using ImageJ (http://rsb.info.nih.gov/ij/) in conjunction with specific plugins (http://bigwww.epfl.ch/thevenaz/StackReg/) or aligned by using the IMOD software suite (Kremer et al., 1996). Images were bandpass-filtered (to exclude high frequency noise, typically at frequencies greater than 1/12 nm–1) to sharpen membrane contours and imported either into IMOD or Amira (Mercury Computer Systems, Inc., Chelmsford, MA) for segmentation and rendering.
3. Results and discussion
3.1. Principle of imaging
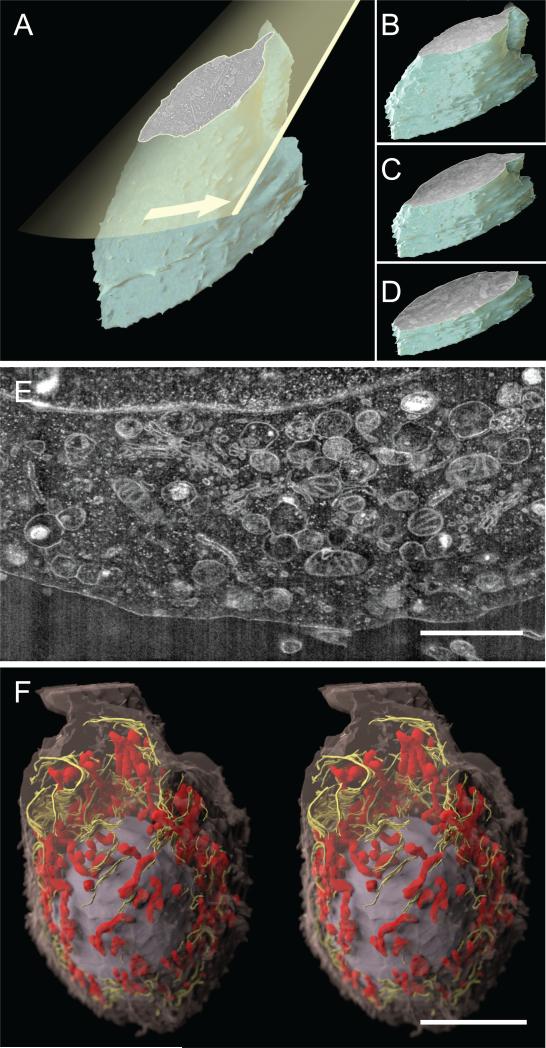
The principle of obtaining 3D images of cellular specimens by iterative application of the focused ion beam (Giannuzzi and Stevie, 2005 and Heymann et al., 2006) with imaging using a scanning electron beam is shown in Fig. 1 A to D. A focused gallium ion beam is used to abrade the surface of the block in areas typically ~40 μm × ~40 μm in step sizes of ~20 nm. The step size can be typically varied between ~10 and ~200 nm. Each newly exposed surface is imaged with the scanning electron beam, with acquisition times ranging from 60 to 160 s per image, depending on the pixel” size used (typically ~3–12 nm). Each image provides a sampling of the ultrastructure at the specific height imaged, and the stack of successive 3D images therefore provides an informative 3D map of the three-dimensional distribution of cellular organelles.
Figure 1.
Whole cell imaging and organelle visualization using IA-SEM. (A) Principle of 3D imaging using a focused ion beam (yellow plane) to expose the interior of a cell or tissue specimen, which is then imaged using scanning electron microscopy. Iteration of these steps to progress through the cell volume results in a stack of 2D surface images (B–D) that can be combined to generate a 3D representation of the cell. (E) A cross-sectional image of cell interior obtained using IA-SEM illustrating 2D organellar arrangement. The membrane structures with the bright spots likely represent rough endoplasmic reticulum studded with ribosomes on the surface. (F) 3D image of an MNT-1 melanoma cell (~20 × 35 μm wide) obtained using a series of IA-SEM images (such as the one shown in 1E, see Movie S1 for actual data stack and Movie S2 for an animation of the rendering) and segmented to show the spatial arrangement of a selection of mitochondria (red), endoplasmic reticulum (yellow), and the nucleus (gray) relative to the cell envelope (magenta). Inter-image spacing in the stack is ~30 nm, and in-plane pixel size is ~12 nm. Scale bar in (E and F) are 2 and 10 μm long, respectively.
Using this strategy, we have imaged aldehyde-fixed, osmium-stained, plastic-embedded MNT-1 melanoma cells (see Section 2). An example of the type of information about mitochondrial and endomembrane architecture that can routinely be obtained using IA-SEM in 2D is shown in Fig. 1E (and in Movie S1), which shows a cross-sectional image highlighting the region between the nucleus (top of image) and the plasma membrane (bottom of image). Membrane bound structures are easily recognized in the image. A stack of images such as those shown in Fig. 1E can be combined to generate a 3D volume; an example of a segmented volume highlighting the distribution of mitochondria and endoplasmic reticulum membranes is shown in Fig. 1F (and in Movie S2).
3.2. Comparison with transmission electron microscopy
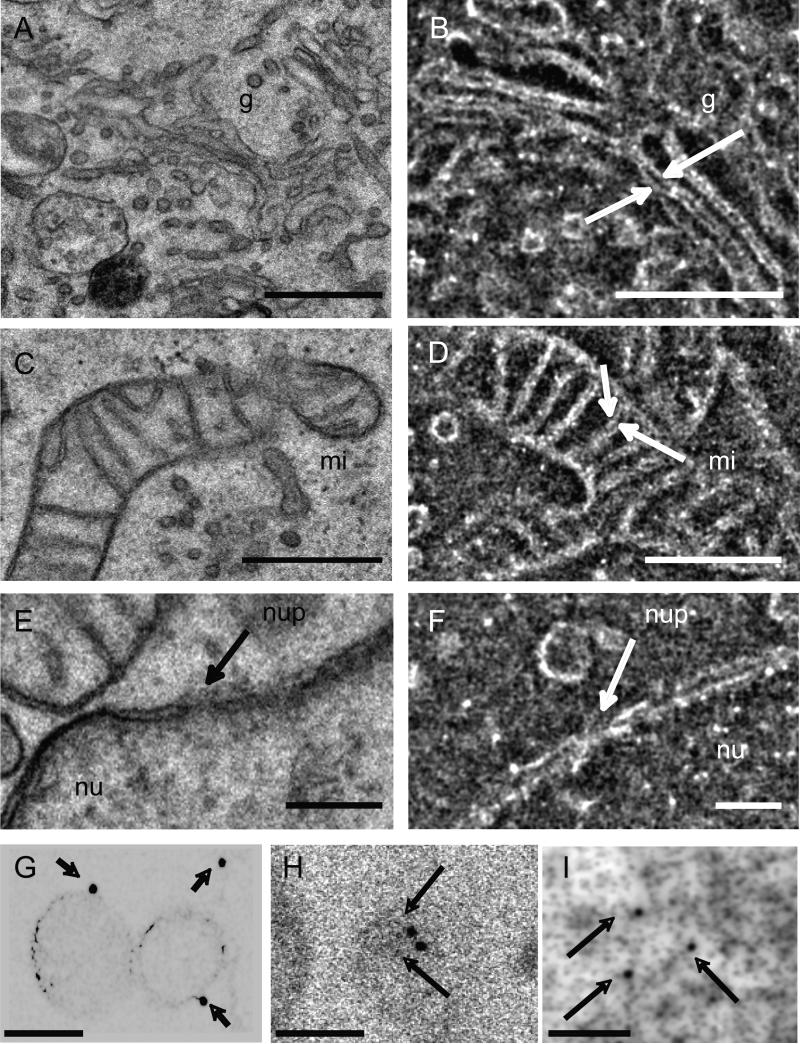
In Fig. 2A–F, we present a detailed comparison of images of the cell interior acquired using IA-SEM (Fig. 2B, D and F) with TEM imaging of ~80 nm thin sections (Fig. 2A, C and E) prepared from the same block. Key ultrastructural features such as the Golgi, mitochondria and the locations of the nuclear pore complex can be visualized in each IA-SEM image slice with clarity that is comparable to that expected in conventional TEM images. Closely apposed membranes in the Golgi stack (~20 nm apart) as well as the spacing of the invaginated mitochondrial inner membrane (~12 nm apart) are clearly resolved in single IA-SEM images (Fig. 2B and D, respectively). The image in the vicinity of the nuclear membrane shows that the spacing of the lipid bilayer membrane of inner and outer nuclear membranes (~6 nm) can also be discerned.
Figure 2.
Image quality and detection of nanoparticle labels in IA-SEM images of MNT-1 melanoma cells. (A–F) Comparative analysis of information present in images of cell interior obtained using conventional TEM (A, C and E) with single slices (B, D and F) of similar regions obtained using IA-SEM at the same pixel size. Arrows indicate details in the membrane organization in mitochondria (mi), Golgi (g) and nuclear pore (nup) in the membrane of the nucleus (nu). (G–I) Detection of 15 nm gold, 10 nm gold conjugated to protein A or quantum dots with 7 nm-size cores (marked by arrows), respectively, in individual cross-sectional images from labeled MNT-1 cells. The 15 nm gold and quantum dot particles were taken up passively by the cells, while the protein A-conjugated gold was used to label antibodies specific to the melanoma antigen Pmel17 (Valencia et al., 2006) (see also Movie S3 for larger views of quantum dot-labeled cells). The images in (G–I) are shown with inverted contrast to highlight the detection of the gold and quantum dot particles. Inter-image spacing: 20 nm, in-plane pixel size 3.1 nm. Scale bars: (A–D) 0.5 μm, (E and F) 0.2 μm, (G, H and I) 100 nm.
In addition to describing subcellular architecture at each abraded plane, IA-SEM can also be combined with pre-embedding immunolabeling, providing a powerful tool for combined 3D antigen localization and subcellular imaging at nanometer resolution. Gold particles provide a strong contrast against the background of the rest of the cellular material and can thus be easily recognized. We show three examples illustrating the detection of gold in these images; note that there is a large dynamic range in these images, and at the contrasts levels used to display gold (Fig. 2G–I), there is minimal contrast from cellular material. In Fig. 2G, we show that 15 nm-sized colloidal gold particles taken up passively can be detected at the surface of the filopodial membranes. In parallel, we show that polyclonal antibodies that recognize the C-terminal region of the melanoma antigen Pmel17 (Valencia et al., 2006) can be located using protein A conjugated with 10 nm-sized gold (Fig. 2H) to the cytoplasm. Thus, specific labeling with differently sized gold particles (for example, 10 and 15 nm) can provide an excellent tool for mapping pair-wise protein proximities in 3D. Yet another avenue for labeling is afforded by the fact that quantum dot particles with 7-nm sized cores can be recognized (Fig. 2I), suggesting novel possibilities for combining lower resolution fluorescence microscopic imaging with higher resolution IA-SEM imaging. An example of simultaneous visualization of subcellular structure with quantum dots distributed in the cellular interior is shown in Movie S3.
3.3. Insights from 3D imaging of membrane organelles
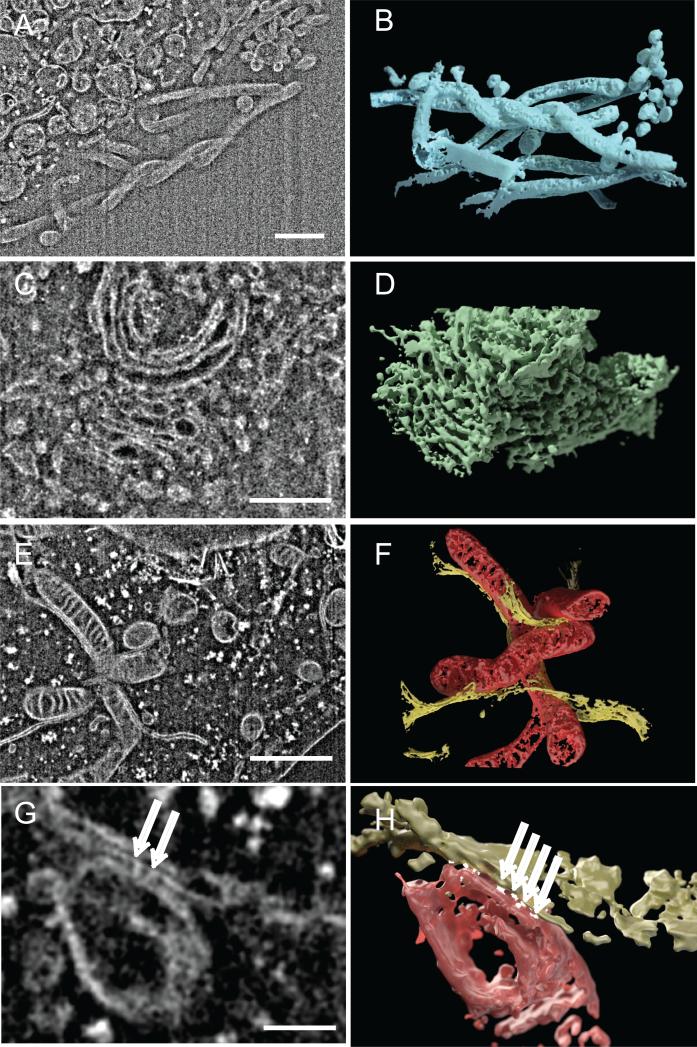
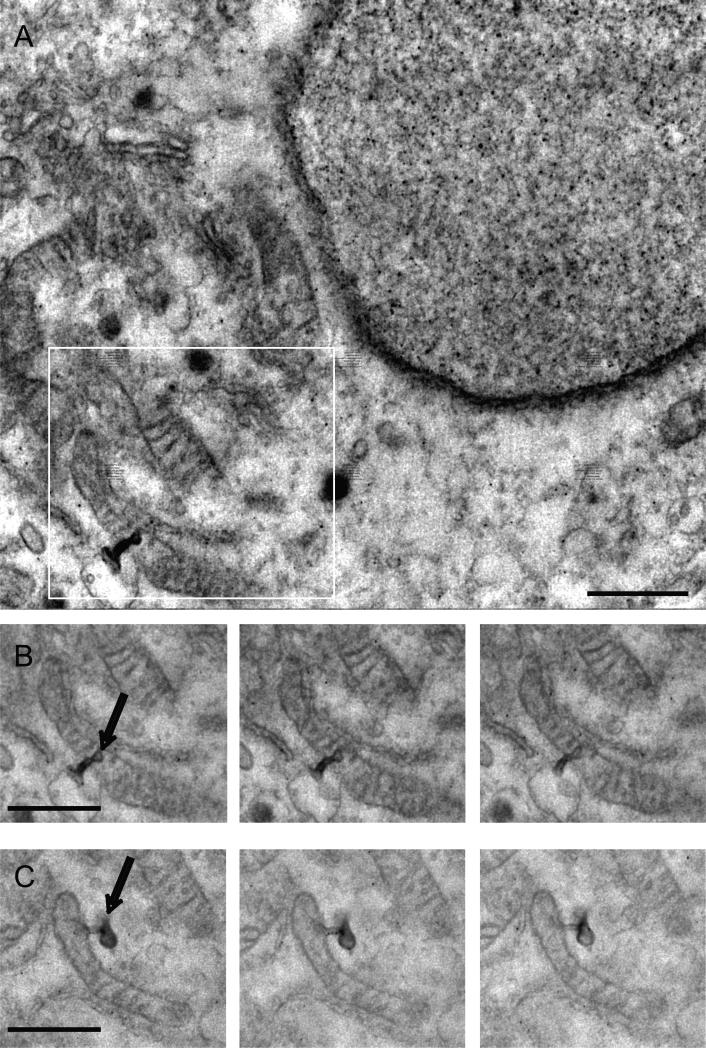
A key advantage in the use of IA-SEM is the exceptional opportunity for rapid 3D imaging of the cellular interior to reveal structural detail that cannot easily be deduced from 2D projection images alone. We present three examples in Fig. 3, illustrating how 3D imaging at 20 nm resolution (with in-plane pixel size of 3.1 nm) provides valuable information on the interdigitated architecture of filopodia at the cell surface (Fig. 3A and B), the branched structure of a Golgi body (Fig. 3C and D) and the convoluted arrangement of mitochondria (Fig. 3E and F). The ability to rapidly image these shapes in 3D provides a starting point for quantitative understanding of cell architecture. For example, automated segmentation of mitochondria in MNT-1 cells allows extraction of estimates for metrics such as the volume of cytoplasm occupied by mitochondria (~5%), difference between surface area of inner vs. outer membranes (~2-fold), and mean mitochondrial width (~450 nm) (Narasimha et al., 2009). The 3D images also reveal the unique complementarity in curvature between the mitochondria and the closely associated endoplasmic reticulum membrane (see Movie S4), and provide experimental measures of curvature that could be important information for efforts aimed at computational modeling of mitochondrial function (Balaban, 2006) and its changes over different cellular states (Birkedal et al., 2006). Yet another insight from the images is the glimpse of densities at the contact zones (Fig. 3G and H) between mitochondria and the endoplasmic reticulum. The existence of physical links or “tethers” between these two organelles has been shown in previous TEM analyses of isolated mitochondrial and endoplasmic reticulum preparations (Csordas et al., 2006 and Meier et al., 1981). The use of IA-SEM combined with immunolabeling of protein complexes such as IP3 receptors and VDAC proteins may help further elucidate the structural role of the complexes formed by association of these and other proteins (Szabadkai et al., 2006) postulated to form a Ca2+ tunnel between mitochondria and endoplasmic reticulum (Rapizzi et al., 2002). At a cellular level, the melanoma cells also show other unusual features such as protrusions of the outer mitochondrial membrane (Fig. 4) that, together with knowledge of the spatial distribution and extent of staining could begin to provide new opportunities to define structural signatures associated with normal and cancerous cells.
Figure 3.
Three-dimensional visualization of organelles in MNT-1 melanoma cells using IA-SEM. (A, C and E). Selected 2D images from an image stack obtained by IA-SEM that highlight filopodia (A), Golgi stack (C) and mitochondria with adjacent endoplasmic reticulum (ER) membrane (E). (B, D and F) Rendered 3D volumes derived from the stack of 2D images encompassing the filopodial, Golgi and mitochondrial/ER structures shown in (A, C and E), respectively. (G and H) Close-up view of mitochondria and endoplasmic reticulum bridged by punctate contact regions (shown in white), and indicated by arrows (G). Inter-image spacing: 20 nm, in-plane pixel size 3.1 nm. Scale bars are 1 μm in (A, C and E) and 100 nm in G.
Figure 4.
Localization of membrane protrusions in mitochondrial outer membranes. A group of mitochondria was located in a melanoma cell that displayed membrane structures protruding from mitochondria (A). The black dots in the image represent quantum dots taken up by the cell that was used in this experiment. The boxed area is shown in (B) as a sequence of surface images collected in the process of imaging the cellular volume. (C) Another example of a mitochondrion with membrane protrusion found in the same volume. Inter-image spacing: 30 nm, in-plane pixel size 3.1 nm. Scale bar is 1 μm.
3.4. Melanosome distribution in human melanocytes
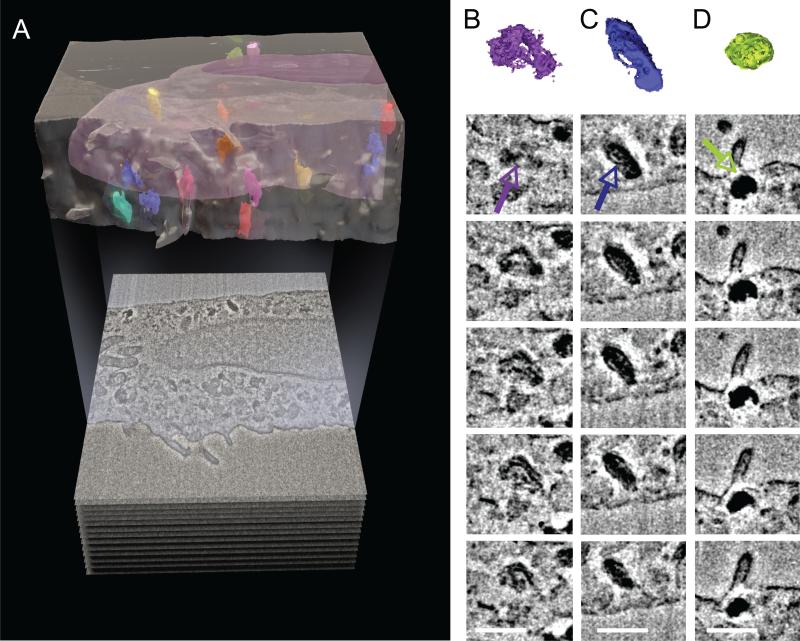
Using strategies established for investigating MNT-1 melanoma cells, we have used IA-SEM to image human melanocytes (Fig. 4) in an ongoing effort to better understand structural mechanisms underlying skin pigmentation and the potential subcellular origins of skin cancer. Recent studies have suggested that there may be intriguing connections between mitochondria and melanogenesis as it relates to cancer (Rosania, 2005). Melanin is produced in small organelles known as melanosomes that are transferred by an as yet unknown mechanism from melanocytes to the surrounding keratinocytes (Van Den Bossche et al., 2006). The arrival of melanosomes in keratinocytes is central to their normal function. Numerous diseases leading to abnormal pigmentation such as Hermansky–Pudlak syndrome, Chediak–Higashi syndrome in which patients have compromised immune system function have been documented (Van Den Bossche et al., 2006). While many of the molecules that are important for the process have been identified (Dell'Angelica, 2004), central questions that remain unanswered include knowledge of the intracellular distribution of melanosomes at different stages of biogenesis (Kushimoto et al., 2001), and the types of mechanisms that could be involved in melanin transfer. We show in Fig. 5A that the distinct staining pattern of melanosomes can be used to determine their distribution in the context of the 3D milieu of the cytoplasm. Interestingly, variations in melanosomes, presumably corresponding to variations in melanin accumulation, can be identified (Fig. 5B–D), and could represent different stages in the biogenesis of this organelle, although this is not proven.
Figure 5.
Detection of melanosome distribution in cultured human melanocytes. (A) Segmented 3D representation of image stack from a cultured melanocyte cell showing the position and distribution of melanosomes (in color) within the cell body (magenta) and outside the nucleus (purple). A single 2D image is shown below the 3D image. (B–D) Selected, serial 2D cross-sections of individual segmented melanosomes (indicated by colored arrows) from (A) showing differences in internal membrane organization and pigmentation. The melanosome in column (B) has the beginnings of internal membrane organization that is further advanced in the melanosome in column (C), and completed in the melanosome in column (D). Inter-image spacing: 30 nm, in-plane pixel size 6 nm. Scale bars are 0.5 μm in (B–D).
4. Summary and perspective
The spatial resolution we have achieved using IA-SEM is comparable to, or exceeds those reported to date by other approaches for 3D imaging of the interior of live mammalian cells such as X-ray tomography (Gu et al., 2007), optical microscopy (Egner et al., 2004), and confocal scanning transmission electron microscopy (Einspahr and Voyles, 2006) as well as approaches for imaging fixed cells such as block-face scanning electron microscopy (Denk and Horstmann, 2004), which combines the use of a microtome with scanning electron microscopy. In contrast to sectioning with a microtome, where it can be difficult to obtain reproducible specimen thicknesses, the use of a focused ion beam allows repetitive removal of material with high precision (with an overall variation of <0.5% between the predicted and actual thickness of material removed.) because of the use of electronically controlled beam-shift to step the focused ion beam. Some of the common problems associated with microtome-based sectioning such as mass loss between successive slices, or cutting artifacts induced by surface defects in the diamond or glass knives are also not present in IA-SEM. As currently implemented, IA-SEM is applicable to imaging plastic-embedded cell and tissue specimens of the kind routinely used in clinical settings, and will closely complement newly emerging tools for higher resolution fluorescence microscopic imaging that exploit photo-activatable probes (Betzig et al., 2006). Efforts are underway to use IA-SEM for localizing a variety of nanoparticles in mammalian tissue biopsies to explore drug delivery, localization and toxicity, and to discover quantitative insights into changes that may occur in mitochondrial extent and organization in cancer cells relative to normal cells. A particularly important future prospect for IA-SEM imaging is for imaging frozen cells at cryogenic temperatures in combination with 3D labeling of cellular antigens, taking advantage of emerging methods for contrast enhancement for imaging at cryogenic temperatures (Hayles et al., 2007 and Heymann et al., 2006). Another use of focused ion-beam milling is to use the gallium beam to thin thicker specimens for subsequent imaging in a transmission electron microscope (Marko et al., 2007). Taken together with the immediate opportunities for obtaining information on cellular architecture and nanoparticle distribution in clinically relevant specimens, IA-SEM imaging could become a highly effective tool for nanoscopic imaging of cells and tissues.
Supplementary Material
References
- Balaban RS. Modeling mitochondrial function. Am. J. Physiol. Cell Physiol. 2006;291:C1107–C1113. doi: 10.1152/ajpcell.00223.2006. [DOI] [PubMed] [Google Scholar]
- Betzig E, Patterson GH, Sougrat R, Lindwasser OW, Olenych S, Bonifacino JS, Davidson MW, Lippincott-Schwartz J, Hess HF. Imaging intracellular fluorescent proteins at nanometer resolution. Science. 2006;313 doi: 10.1126/science.1127344. [DOI] [PubMed] [Google Scholar]
- Birkedal R, Shiels HA, Vendelin M. Three-dimensional mitochondrial arrangement in ventricular myocytes: from chaos to order. Am. J. Physiol. Cell Physiol. 2006;291:C1148–C1158. doi: 10.1152/ajpcell.00236.2006. [DOI] [PubMed] [Google Scholar]
- Csordas G, Renken C, Varnai P, Walter L, Weaver D, Buttle KF, Balla T, Mannella CA, Hajnoczky G. Structural and functional features and significance of the physical linkage between ER and mitochondria. J. Cell Biol. 2006;174 doi: 10.1083/jcb.200604016. [DOI] [PMC free article] [PubMed] [Google Scholar]
- Dell'Angelica EC. The building BLOC(k)s of lysosomes and related organelles. Curr. Opin. Cell Biol. 2004;16 doi: 10.1016/j.ceb.2004.05.001. [DOI] [PubMed] [Google Scholar]
- Denk W, Horstmann H. Serial block-face scanning electron microscopy to reconstruct three-dimensional tissue nanostructure. PLoS Biol. 2004;2:e329. doi: 10.1371/journal.pbio.0020329. [DOI] [PMC free article] [PubMed] [Google Scholar]
- Egner A, Verrier S, Goroshkov A, Soling HD, Hell SW. 4Pi-microscopy of the Golgi apparatus in live mammalian cells. J. Struct. Biol. 2004;147 doi: 10.1016/j.jsb.2003.10.006. [DOI] [PubMed] [Google Scholar]
- Einspahr JJ, Voyles PM. Prospects for 3D, nanometer-resolution imaging by confocal STEM. Ultramicroscopy. 2006;106 doi: 10.1016/j.ultramic.2006.04.018. [DOI] [PubMed] [Google Scholar]
- Giannuzzi LA, Stevie FA. Introduction to Focused Ion Beams: Instrumentation, Theory, Techniques and Practice. Springer; 2005. [Google Scholar]
- Gu W, Etkin LD, Le Gros MA, Larabell CA. X-ray tomography of Schizosaccharomyces pombe. Differentiation. 2007;75 doi: 10.1111/j.1432-0436.2007.00180.x. [DOI] [PubMed] [Google Scholar]
- Hayles MF, Stokes DJ, Phifer D, Findlay KC. A technique for improved focused ion beam milling of cryo-prepared life science specimens. J. Microsc. 2007;226 doi: 10.1111/j.1365-2818.2007.01775.x. [DOI] [PubMed] [Google Scholar]
- Heymann JA, Hayles M, Gestmann I, Giannuzzi LA, Lich B, Subramaniam S. Site-specific 3D imaging of cells and tissues with a dual beam microscope. J. Struct. Biol. 2006;155 doi: 10.1016/j.jsb.2006.03.006. [DOI] [PMC free article] [PubMed] [Google Scholar]
- Knott G, Marchman H, Wall D, Lich B. Serial section scanning electron microscopy of adult brain tissue using focused ion beam milling. J. Neurosci. 2008;28 doi: 10.1523/JNEUROSCI.3189-07.2008. [DOI] [PMC free article] [PubMed] [Google Scholar]
- Kremer JR, Mastronarde DN, McIntosh JR. Computer visualization of three-dimensional image data using IMOD. J. Struct. Biol. 1996;116 doi: 10.1006/jsbi.1996.0013. [DOI] [PubMed] [Google Scholar]
- Kushimoto T, Basrur V, Valencia J, Matsunaga J, Vieira WD, Ferrans VJ, Muller J, Appella E, Hearing VJ. A model for melanosome biogenesis based on the purification and analysis of early melanosomes. Proc. Natl. Acad. Sci. USA. 2001;98 doi: 10.1073/pnas.191184798. [DOI] [PMC free article] [PubMed] [Google Scholar]
- Marko M, Hsieh C, Schalek R, Frank J, Mannella C. Focused-ion-beam thinning of frozen-hydrated biological specimens for cryo-electron microscopy. Nat. Methods. 2007;4 doi: 10.1038/nmeth1014. [DOI] [PubMed] [Google Scholar]
- McIntosh R. Cellular Electron Microscopy. Academic Press; 2007. [Google Scholar]
- McIntosh R, Nicastro D, Mastronarde D. New views of cells in 3D: an introduction to electron tomography. Trends Cell Biol. 2005;15 doi: 10.1016/j.tcb.2004.11.009. [DOI] [PubMed] [Google Scholar]
- Meier PJ, Spycher MA, Meyer UA. Isolation and characterization of rough endoplasmic reticulum associated with mitochondria from normal rat liver. Biochim. Biophys. Acta. 1981;646 doi: 10.1016/0005-2736(81)90335-7. [DOI] [PubMed] [Google Scholar]
- Narasimha R, Ouyang H, Gray A, McLaughlin SW, Subramaniam S. Automatic joint classification and segmentation of whole cell 3D images. Pattern Recognition. 2009;171:1067–1079. 2008. [Google Scholar]
- Noske AB, Costin AJ, Morgan GP, Marsh BJ. Expedited approaches to whole cell electron tomography and organelle mark-up in situ in high-pressure frozen pancreatic islets. J. Struct. Biol. 2008;161 doi: 10.1016/j.jsb.2007.09.015. [DOI] [PMC free article] [PubMed] [Google Scholar]
- Rapizzi E, Pinton P, Szabadkai G, Wieckowski MR, Vandecasteele G, Baird G, Tuft RA, Fogarty KE, Rizzuto R. Recombinant expression of the voltage-dependent anion channel enhances the transfer of Ca2+ microdomains to mitochondria. J. Cell Biol. 2002;159 doi: 10.1083/jcb.200205091. [DOI] [PMC free article] [PubMed] [Google Scholar]
- Rosania GR. Mitochondria give cells a tan. Chem. Biol. 2005;12 doi: 10.1016/j.chembiol.2005.04.002. [DOI] [PubMed] [Google Scholar]
- Subramaniam S. Bridging the imaging gap: visualizing subcellular architecture with electron tomography. Curr. Opin. Microbiol. 2005;8 doi: 10.1016/j.mib.2005.04.012. [DOI] [PMC free article] [PubMed] [Google Scholar]
- Szabadkai G, Bianchi K, Varnai P, De Stefani D, Wieckowski MR, Cavagna D, Nagy AI, Balla T, Rizzuto R. Chaperone-mediated coupling of endoplasmic reticulum and mitochondrial Ca2+ channels. J. Cell Biol. 2006;175 doi: 10.1083/jcb.200608073. [DOI] [PMC free article] [PubMed] [Google Scholar]
- Valencia JC, Watabe H, Chi A, Rouzaud F, Chen KG, Vieira WD, Takahashi K, Yamaguchi Y, Berens W, Nagashima K, Shabanowitz J, Hunt DF, Appella E, Hearing VJ. Sorting of Pmel17 to melanosomes through the plasma membrane by AP1 and AP2: evidence for the polarized nature of melanocytes. J. Cell Sci. 2006;119 doi: 10.1242/jcs.02804. [DOI] [PMC free article] [PubMed] [Google Scholar]
- Van Den Bossche K, Naeyaert JM, Lambert J. The quest for the mechanism of melanin transfer. Traffic. 2006;7 doi: 10.1111/j.1600-0854.2006.00425.x. [DOI] [PubMed] [Google Scholar]
- Zhang P, Khursigara CM, Hartnell LM, Subramaniam S. Direct visualization of Escherichia coli chemotaxis receptor arrays using cryo-electron microscopy. Proc. Natl. Acad. Sci. USA. 2007;104 doi: 10.1073/pnas.0610106104. [DOI] [PMC free article] [PubMed] [Google Scholar]
Associated Data
This section collects any data citations, data availability statements, or supplementary materials included in this article.


