Abstract
Diffuse ST-segment depression with ST-segment elevation in the lead augmented vector right (aVR) in 12-lead electrocardiography may indicate the possibility of coronary artery disease involving the left main coronary artery or proximal left anterior descending artery, pulmonary embolism or takotsubo cardiomyopathy. We report a 69-year-old female with severe aortic stenosis, who had similar electrocardiographic findings which indicated ischemic change and led to cardiogenic shock and ventricular tachycardia. Intubation and insertion of an intra- aortic balloon pump (IABP) were performed and the result of coronary angiography showed only less than 40% stenosis. Her blood pressure gradually stabilized, and diffuse ST-segment depression or ST-segment elevation in lead aVR was not noted in the 12-lead electrocardiography. However, we removed the IABP and after 6 hours, sudden profound shock refractory to combined vasopressors occurred. Electrocardiography again showed ST- segment elevation in aVR with and diffuse ST-segment depression. After several episodes of ventricular tachycardia, cardiopulmonary resuscitation was not successful and the patient expired in our hospital.
Keywords: Diffuse ST depression, Severe aortic stenosis, ST elevation in aVR
INTRODUCTION
Diffuse ST-segment depression with ST-segment elevation in lead augmented vector right (aVR) in 12-lead electrocardiography may indicate the possibility of coronary artery disease involving the left main coronary artery (LMCA) or the proximal left anterior descending artery. However, pulmonary embolism and takotsubo cardiomyopathy have also been reported based upon similar electrocardiographic results. We report the case of a 69-year-old female with severe aortic stenosis whose electrocardiography also showed a similar pattern, which indicated ischemic change and led to cardiogenic shock and ventricular tachycardia.
CASE REPORT
A 69-year-old female presented with end-stage renal disease for which she received regular hemodialysis, diabetes mellitus, hypertension, ischemic heart disease without prior coronary intervention, asthma, hyperlipidemia and severe aortic stenosis. The severe aortic stenosis was diagnosed by echocardiography two years earlier when she was admitted to our ward due to acute pulmonary edema. According to the formula as shown in Table 1, the calculated aortic valve area was only 0.61 cm2 at that time, which proved severe aortic stenosis. She had previously refused advanced intervention for her severe aortic stenosis with transcatheter aortic-valve implantation for personal reasons.
Table 1. The parameters of her echocardiography .
| AV | LVOT | ||
| Vmax | 433 cm/s | Vmax | 85.7 cm/s |
| Vmean | 306 cm/s | Vmean | 50.7 cm/s |
| Maximal PG | 75 mmHg | Maximal PG | 3 mmHg |
| Mean PG | 43 mmHg | Mean PG | 1 mmHg |
| VTI | 97.7 cm | VTI | 23.5 cm |
| LVOT diameter | 1.8 cm | LVOT CSA = π[(LVOT diameter) / 2]2 | |
| AVA [cm2] (by VTI) = [(LVOT CSA × LVOT VTI)] / (AV VTI) = 0.61 cm2 |
AV, aortic valve; AVA, aortic valve area; CSA, cross sectional area; LVOT, left ventricular outflow tract; PG, pressure gradient; VTI, velocity time integral.
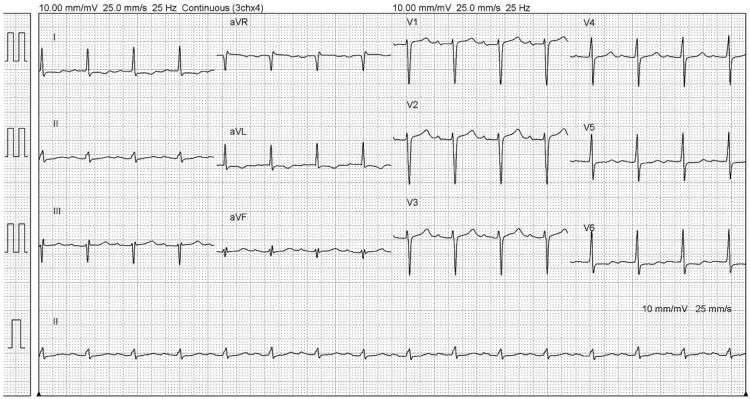
Her admission was due to a left femoral double lumen hemocatheter infection less than two weeks earlier. She complained of fever and chills for 1 day and then came to our emergency department for help. Upon arrival, she had intermittent chest pains and tachycardia (blood pressure 140/101 mmHg, pulse rate 109 beats/minute, respiration rate 18/minute and body temperature 39.3 °C). Auscultation revealed no crackles or wheezing, but a chest X-ray showed marked cardiomegaly. Laboratory tests revealed normal creatine kinase, creatine kinase-MB and elevated troponin-I levels (55 IU/L, 2.1 ng/ml, and 0.639 ng/ml, respectively). Electrocardiographic testing showed sinus tachycardia and first degree atrioventricular block initially, as indicated in Figure 1. However, 14 hours after arriving at the emergency department (on the 2nd day of admission), she complained of mild chest tightness, and the electrocardiography findings changed to ST-segment elevation in aVR with 0.5 mm and ST-segment depression in leads I, II, aVL and V2-V6. One hour later and subsequent to electrocardiographic examination, her blood pressure gradually decreased (systolic/diastolic blood pressure from 92/31 mmHg to 67/32 mmHg after 5 hours). Under shock status, hydration was provided for suspected septic shock arising from left femoral double lumen hemocatheter infection but the patient did not respond well.
Figure 1.
The electrocardiography on the 1st day of admission.
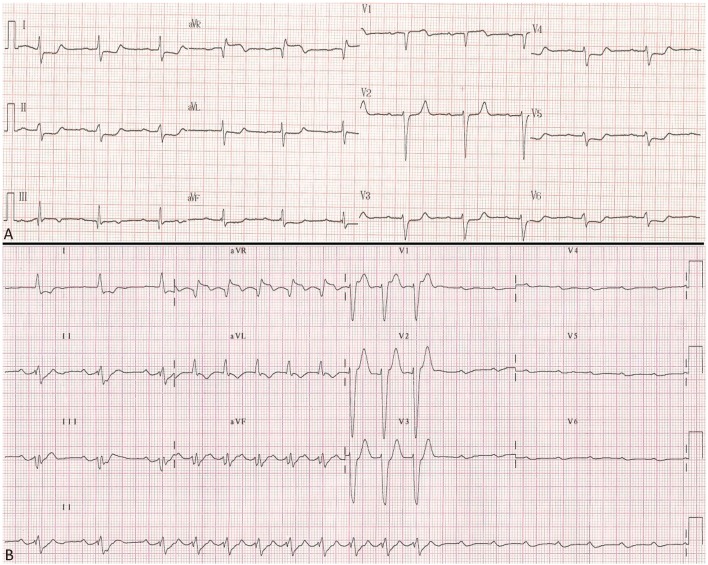
She still complained of persistent chest tightness during admission. On the 3rd day of admission, her electrocardiography showed greater ST-segment elevation in aVR (about 1.5 mm) (Figure 2A) and greater creatine kinase, creatine kinase-MB, and troponin-I levels (351 IU/L, 42.6 ng/ml, 2.239 ng/ml). Approximately 1 hour later, she experienced sudden cardiac arrest and cardiopulmonary resuscitation was performed. A subsequent chest X-ray showed acute pulmonary edema. Intubation and insertion of an intra-aortic balloon pump (IABP) were performed and coronary angiography was arranged for suspected non-ST segment elevation myocardial infarction. However, the result showed only 20% stenosis in the left anterior descending artery and 40% stenosis in the left circumflex artery, without vasospasm or other abnormal findings. Sustained ventricular tachycardia was noted twice on the 4th and 5th days of admission and cardioversion with continuous infusion of lidocaine. Thereafter, her blood pressure gradually stabilized, and diffuse ST-segment depression or ST-segment elevation in lead aVR was not noted in the 12-lead electrocardiography.
Figure 2.
(A) On the 3rd day of admission, her electrocardiography showed greater ST-segment elevation in aVR. (B) On the last day of admission, electrocardiography showed ST elevation in aVR with nearly 2 mm and sudden pulseless electrical activity.
We used a non-invasive cardiac output monitor (NICOM®, manufactured by Cheetah Medical, Tel Aviv, Israel) to monitor her hemodynamics, and on the 8th day of admission with IABP settings being 1:2, it showed cardiac index: 2.7 l/minute/meter2, stroke volume index: 33~38 ml/meter2/beat, and systemic vascular resistance index: 900 dyne • sec/cm5m2. We preliminarily diagnosed septic shock, but then decided to remove the IABP and no hemodynamic changes were noted for 6 hours. However, sudden profound shock refractory to combined vasopressors (norepinephrine and dopamine) occurred. Electrocardiography again showed ST-segment elevation in aVR with 1.25 mm and ST-segment depression again in leads I, II, aVL and V2-V6. After 3 hours, electrocardiography showed ST elevation in aVR with nearly 2 mm and sudden complete atrioventricular block (Figure 2B), combined with several episodes of ventricular tachycardia. Cardiopulmonary resuscitation and IABP were undertaken, and a transcutaneous pacemaker was placed. However, none of these interventions were successful and the patient expired in our hospital.
DISCUSSION
It is well-known that patients with diffuse ST depression and ST elevation in aVR may indicate the possibility of coronary artery disease. However, according to one study of 133 patients demonstrating this particular electrocardiography pattern, only 28% of the patients had non-ST elevation acute coronary syndrome. A total of 57 patients (44%) underwent coronary angiography, and no significant coronary artery disease was found in 26% of these patients. Additionally, left main coronary artery stenosis or left main equivalent disease was found in only 23% of these patients.1 A retrospective study also suggested that the ST-elevation in lead aVR is associated with a more severe course of acute pulmonary embolism, particularly in patients with an intermediate risk.2 Another case report suggested that takotsubo cardiomyopathy should also be considered among the causes of ST-segment elevation in lead aVR in patients with angina at rest.3
In the current case, the patient’s electrocardiography also showed a similar pattern to diffuse ST-segment depression and ST-segment elevation in lead aVR, though with nearly normal coronary angiography. The ST-segment elevation in lead aVR occurred twice, which led to cardiogenic shock and ventricular tachycardia. We have observed that the lead aVR can be very useful in identifying LMCA obstruction due to ischemia of the basal part of the interventricular septum. Owing to the dominance of the basal ventricular mass, the ST-segment vector in the frontal plane points in a superior direction, leading to ST-segment elevation in leads aVR and ST depression in the inferior leads.4 We hypothesized that although there was no stenosis in her coronary artery, her coronary flow was low, and that change in electrocardiography was related to her severe aortic stenosis, which led to a low cardiac output, low coronary flow, and ischemic change, combined with cardiogenic shock and ventricular tachycardia. As referenced in Figure 2B, we hypothesized that severe aortic stenosis with ischemia involved both the AV nodal branch (primarily supplied by the right coronary artery) and LMCA, which revealed ST elevation in aVR and complete atrioventricular block.
Besides, we did not consider takotsubo cardiomyopathy because the electrocardiographic results did not demonstrate ST-segment elevation changing to biphasic T-waves in the anterior precordial leads, deep T wave inversion with QT interval prolongation, or abnormal Q waves. We also did not consider progressive pulmonary embolism because the oxygen saturation did not deteriorate during this admission, but in fact improved gradually since her intubation on the 3rd day of admission. To the best of our knowledge, no previous studies or reports have mentioned the relationship between ST-segment elevation in lead aVR with diffuse ST-segment depression and severe aortic stenosis. Further studies are needed to evaluate the occurrence and importance of this electrocardiographic sign in patients with severe aortic stenosis.
In conclusion, diffuse ST depression and ST-segment elevation in patients with aortic stenosis indicate severe ischemic change. In such cases, aggressive treatment should be initiated and patients and their families should be informed of the poor prognosis as soon as possible.
DISCLOSURES
The authors have no conflicts of interest to disclose.
REFERENCES
- 1.Knotts RJ, Wilson JM, Kim E, et al. Diffuse ST depression with ST elevation in aVR: is this pattern specific for global ischemia due to left main coronary artery disease? J Electrocardiol. 2013;46:240–248. doi: 10.1016/j.jelectrocard.2012.12.016. [DOI] [PubMed] [Google Scholar]
- 2.Janata K, Höchtl T, Wenzel C, et al. The role of ST-segment elevation in lead aVR in the risk assessment of patients with acute pulmonary embolism. Clin Res Cardiol. 2012;101:329–337. doi: 10.1007/s00392-011-0395-z. [DOI] [PubMed] [Google Scholar]
- 3.Rostoff P, Latacz P, Piwowarska W, et al. Transient ST-segment elevation in lead aVR associated with takotsubo cardiomyopathy. Int J Cardiol. 2009;134:e97–e100. doi: 10.1016/j.ijcard.2008.01.003. [DOI] [PubMed] [Google Scholar]
- 4.Gorgels AP, Engelen DJ, Wellens HJ. Lead aVR, a mostly ignored but very valuable lead in clinical electrocardiography. J Am Coll Cardiol. 2001;38:1355–1356. doi: 10.1016/s0735-1097(01)01564-9. [DOI] [PubMed] [Google Scholar]


