

Abstract
High-throughput methods based on mass spectrometry (proteomics, metabolomics, lipidomics, etc.) produce a wealth of data that cannot be analyzed without computational methods. The impact of the choice of method on the overall result of a biological study is often underappreciated, but different methods can result in very different biological findings. It is thus essential to evaluate and compare the correctness and relative performance of computational methods. The volume of the data as well as the complexity of the algorithms render unbiased comparisons challenging. This paper discusses some problems and challenges in testing and validation of computational methods. We discuss the different types of data (simulated and experimental validation data) as well as different metrics to compare methods. We also introduce a new public repository for mass spectrometric reference data sets (http://compms.org/RefData) that contains a collection of publicly available data sets for performance evaluation for a wide range of different methods.
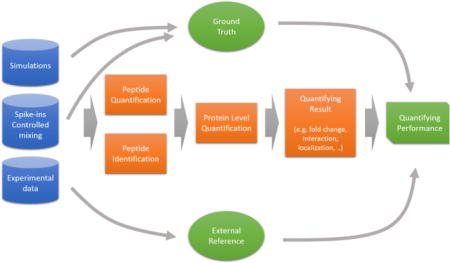
Graphical abstract
INTRODUCTION
The fundamental reliance of mass-spectrometry-based (MS) technologies on adequate computational tools and methods has been recognized for several years.1 Consequently, we witness the development of an increasing number of computational methods for the analysis of MS-based proteomics and metabolomics data, such as methods for peptide identification and metabolite annotation, protein quantification, identification of differentially expressed features, inference of protein–protein interaction partners or protein subcellular localization, and so on. Testing and assessing the adequacy of these tools and methods and their underlying assumptions is essential to guarantee the reliable processing of MS data and generation of trustworthy and reproducible results. In particular nonexperts are often overwhelmed by the many different computational methods published each year. Selecting the right method for the task is difficult, especially so if no comparative benchmarking is available.2 Further complicating this, is the tendency for methods manuscripts to not include necessary in depth and objective comparisons to state-of-the-art alternatives.3,4 Common pitfalls for such comparisons are (i) a natural bias favoring the authors’ own method and the genuine difficulty to optimize a broad range of methods, (ii) the availability, adequacy, and selection bias of testing data sets, (iii) a resulting tendency to under-power the comparative analysis by using too few data sets, and (iv) the use of irrelevant or wrong performance measures. The reliance on and publication of various data analysis methods creates a strong need for neutral and efficient comparative assessment of alternative methods:5 end users need guidance as to which method is best suited for their specific data set and research question and method developers need to benchmark new methods against existing ones. While it may seem simple to exclude poorly performing methods, identifying the best method for a specific task, especially in the frame of a more complex analysis, is often nontrivial. Good method comparison guidelines6,7 and common standards and reference data sets are needed to facilitate the objective and fair comparison between analysis methods. These standards and references would greatly aid the innovation of analysis methods because shortcomings of existing methods are better exposed and potential improvements through the application of novel approaches are easier to evaluate.
Here we report on the outcomes and efforts that stemmed from a discussion group at the recent seminar on Computational Mass Spectrometry (Leibniz-Zentrum für Informatik Schloss Dagstuhl, Seminar 15351 - Computational Mass Spectrometry, http://www.dagstuhl.de/15351). No single method is guaranteed to outperform competitors in all situations, and each method comparison will require a dedicated evaluation design, adequate data, and appropriate outcomes on which to base its conclusions. Because no size fits all, our goal is to share our experience and provide general guidance on how to evaluate computational MS analysis methods, collect useful data sets, and point out some important pitfalls. By promoting community awareness and sharing good practice, it will hopefully become possible to better define the realms, where each method is best applied.
RECOMMENDATIONS FOR METHOD ASSESSMENT
First, we would like to distinguish method validation from method comparison. The former regards the testing that is necessary to confirm that any new method actually performs the desired task. This includes code testing as well as testing the statistical characteristics of a method (e.g., defining/identifying settings where the method can be applied). Method validation is usually the responsibility of the developer and often done without direct comparison to alternative methods. Method comparison, or benchmarking, on the other hand, refers to the competitive comparison of several methods based on a common standard. Such method comparison may be performed as part of a specific research project to identify the best suitable method. The community greatly benefits from published, peer-reviewed, and fair comparisons of state-of-the-art methods.
The first and essential step in setting up a method comparison is to define a comparison design, that is, identify which steps in the overall design, data generation, processing, and interpretation will be affected by the proposed method, how these changes will affect subsequent steps and the overall outcomes, and how these (local and global) outcomes will be recorded and compared. In Figure 1, we summarize a typical mass-spectrometry-based proteomics pipeline to illustrate some method comparison design principles and guidelines discussed in this work. We separate this pipeline into four main components: (1) experimental setup and data, (2) data acquisition, (3) data processing, and (4) data analysis. One of the reasons why method comparison of different algorithms is hard and can be misleading is that each of these components, and indeed steps within the components, need to be carefully controlled. The overall performance critically depends on the chosen algorithms/tools and their parametrization.
Figure 1.
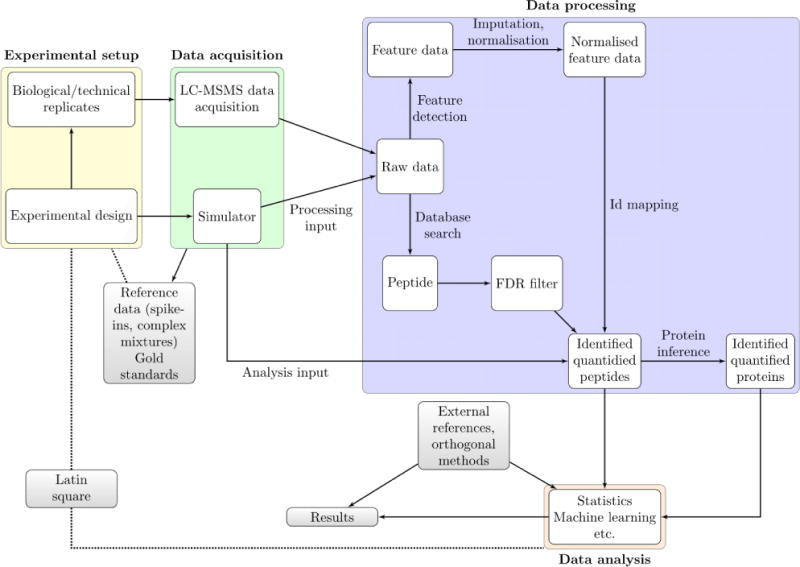
Overview of a typical mass spectrometry data analysis pipeline, applied to shotgun proteomics. Most of these steps equally apply to metabolomics experiments. We highlight the flow of information through the pipeline and overlay important notions related to computational method validation discussed in the text.
For example, when aiming for protein level quantification the critical steps involve peptide identification, peptide quantification, data imputation, protein level quantification, and differential expression calling. Different computational tools exist for each of these steps, and thus tools for performing the same step in the pipeline need to be evaluated competitively. A problem arises when entire analysis pipelines or monolithic “black box” applications are being compared. Having multiple steps, each of which could, and probably should, be parametrized, creates an excessive number of possible scenarios that need to be accounted for. Hence, each step would need to be tested independently. As a corollary, we as a community need to develop assessment schemes and performance measures for each step, and tools need to provide the transparency necessary for actually comparing each step.
When performing assessment of computational methods, two very critical decisions have to be made: first, which tools are being selected for the comparison, and second, what reference result should be used to gauge the performance of the methods? The choices made here will strongly influence the outcome of the evaluation and thus have to be made with great care.
Regarding the first decision, it is essential to compare any new method against best-performing ones rather than a sample of existing, possibly outdated or obsolete competitors, which would inevitably put the new method in a favorable light despite its limited relevance. Note that the definition of a best method is not obvious (see also the discussion on performance and overall pipeline overview later) and will rely on clearly reporting the goal of the method to be compared and the study design. For example, one method might be optimized for high sensitivity (that is, reporting results for as many proteins as possible), whereas another method might have been designed to report robust results for a smaller set of proteins.
The second decision regards the benchmark or reference results being used to quantify the performance of each method. It might be tempting to use the output of a trusted method (or the consensus result of a set of trusted methods) as a reference; however, such an evaluation is inherently flawed: any existing method might return partially wrong or at least imperfect results. If there was a method that is able to produce “optimal” output, there would be no need to further develop tools for this analysis step. Using the output of other methods as a reference is problematic for two reasons: (i) Such comparison would not account for the fact that most existing methods might be biased. A new method correcting for this bias would not agree with the majority of existing methods. As a consequence, such a scheme would intrinsically limit progress because it would force any new method to converge toward the consensus of the existing methods. A new method with a totally new concept might appear to perform poorly just because it disagrees with the current state-of-the-art method. (ii) The assessment would be dependent on the methods that are being compared; that is, an evaluation using another set of methods on the same data might come to different conclusions.
Thus, the reference (benchmark) has to be based on information that is independent of the methods being tested. Three types of data fulfill these requirements and therefore can be used to evaluate and compare computational methods: (1) simulated data where the ground truth is perfectly defined, (2) reference data sets specifically created for that purpose, for example, by using spike-ins or by controlled mixing of samples from different species, and (3) experimental data validated using external references and/or orthogonal methods. All of these data types have advantages and disadvantages, which are discussed in the following sections. We highly recommend to always assess methods on multiple, independent validation schemes.
Simulated Data
The most important advantage of simulated data (see Figure 1), whether simulated at the raw data level8–11 (to assess methods focused on raw data processing, such as feature detection) or in a processed/final form12–14 (to investigate data imputation or downstream statistical analyses), is that the ground truth is well-defined15 and that a wide range of scenarios can be simulated, for which it would be difficult, expensive, and/or impossible to create actual measurements. Consequently, a substantial risk of using simulated data is that the simulation will reflect the model underlying a computational method.15,16 Reliance and wide acceptance of simulation might be reached using a community-accepted simulator rather than project-specific driven simulations. There is a continuum to the extent simulated data will reflect reality, and hence a limit to which the results will be relevant. We, however, recognize some value to simulation as a sophisticated code-checking mechanism and to help developers and users understand the effects and stability of methods rather than compare them. Comparisons based on simulations should be interpreted with care and complemented by utilization of real data.
Reference and Spike-in Data
Spike-in and complex mixture data sets (see Figure 1) have been extensively used for testing and validation of MS and computational methods, in particular, to assess quantitation pipelines (from feature calling, identification transfer, and normalization to significant differential expression to assess statistical analyses and their requirements). The former are composed of a relatively small number of peptides or proteins (for example, the UPS1 reference protein set) spiked at a known relative concentration into a constant but complex background.17,18 In these designs, a broad spiked-in dynamic range can be assayed and tested; however, the limited complexity of these spike-in data and designs often results in successful outcomes for most methods under comparison, which does not generalize to more complex, real data challenges. Indeed, the properties of the spike-ins and the biological material they mimic are very different: Spike-ins are characterized by small and normally distributed variance (as reflected by pipetting errors), while real data often exhibit substantially greater variances and different types of distributions. While we do not deny the usefulness of simple and tractable designs such as spike-ins, it is important to clarify the extent to which they conform with real, biologically relevant data. Alternatively, full proteomes are mixed in predefined ratios to obtain two hybrid proteome samples.19,20 Similarly, well-characterized experimental designs, such as latin squares (see Figure 1), that control a set of factors of interest reflecting standardized features of a reference data set, such as replication over dilution factors, represent a useful testing framework.21 Data sets that have been extensively characterized can also be used as gold standards to test and validate methods. While spike-in, reference, and gold standard sets (see Figure 1) are important, they often represent a limited level of complexity and can lead to overfitted evaluations, where matching a method to such data becomes a goal on its own. It is important to employ several reference sets to appropriately power the comparative analysis between methods.
Experimental Data
Experimental data sets have generally little or no pre-existing absolute knowledge of the ground truth. Even if not fully characterized, they can, however, be used in conjunction with an objective metric that enables the assessment of the method at hand. In genomics, several examples exist, where real-life experimental data have been used to evaluate computational methods while using an external data set as a common reference.22–25 In proteomics, for example, the successive iterations of the pRoloc framework for the analysis of spatial proteomics data, ranging from standard supervised machine learning,26 semisupervised methods,27 and transfer learning,28 have employed publicly available real data sets (that are distributed with the software) to validate the methodologies and track their performances. These performances were (i) evaluated using stratified cross-validation on a manually curated subset, (ii) iteratively validated by expert curation, and (iii) globally assessed by comparison against newly acquired and improved real data on identical samples. In such cases, one tracks the relative improvement of the algorithms against these data, or a characterized subset thereof, rather than their absolute performance. Methods based on experimental data without a well-defined ground truth can make use of external references that likely correlate with the unknown “truth”.
The utilization of single, yet complex omics data sets for method comparison can be challenging, yet in a time where a broad set of technologies are available and multiomics studies are of paramount interest, the need for adequate reference data across high-throughput technologies, for example,29 is crucial. There are genuine opportunities for the generation and dissemination of data from matching samples across omics domains, under controlled conditions, and as replicated measurements, and we expect a great potential of such analyses also for improving computational methods. First, the availability of orthogonal measurements (see Figure 1) of the same assayed quantity (such as the relative amount of proteins in a sample) using different technologies (the usage of label-free quantitation to targeted proteomics data or comparison with protein arrays) can be used to directly compare and contrast different errors on the methods. Other examples include the comparison of mass spectrometry-based spatial proteomics data with results from imaging approaches28 and protein–protein interaction data30 or comparing affinity-purification MS results with interaction measurements from alternative methods such as yeast-two-hybrid. Importantly, such alternative methods will not generate perfectly true results (i.e., they cannot serve as a “ground truth”); however, when comparing the outputs of different computational methods run on identical data, better consistency between the output and such external information might serve as an indication for improvement.
It is also possible to extend such comparisons to different, biologically related quantities. For example, we envision that different methods for quantifying proteins could be assessed using matching mRNA concentration measurements (ideally from identical samples) as a common, external reference. Only relying on the direct, absolute correlation between protein and mRNA levels is, however, hardly an adequate measurement. Indeed, correlation is imperfect for a number of reasons, such as translation efficiency, RNA regulation, protein half life, and so on.31–34 In addition, the correlation of these quantities is not constant along the range of measurements (published values typically range between 0.3 and 0.7) nor linear in terms of the nature of the relation between the two measurements.31–33 The deviation from a perfect correlation between protein and mRNA levels is due to two aspects: first, biological factors, such as variable post-transcriptional regulation, and second, technical noise. A reduction of technical noise will always lead to improved correlation between protein and mRNA levels, irrespective of the contribution of biological factors. Improving the quantification of protein levels through advancing computational methods will thus be reflected in better protein–mRNA correlations. Therefore, relative differences of correlation/agreement could be informative: the fact that one method results in significantly greater correlation between protein and mRNA than another could serve as a guideline for choosing the method. Obviously, such assessment requires great care to avoid biases, for example, by using identical sets of proteins for the comparison. Furthermore, improving the correlation between protein and mRNA levels should not happen at the expense of proteins that are strongly regulated at the posttranscriptional level. A possible strategy for addressing this issue might be to restrict the assessment to proteins that are already known to be mostly driven by their mRNA levels; however, we wish to emphasize that using protein–mRNA correlations for method assessment is not yet an accepted standard in the community. The ideas outlined here aim to stimulate future work to explore this opportunity more in detail.
Quantifying Performance
It is crucial to identify and document measurable and objective outcomes underlying the comparison. These outcomes can reflect the ground truth underlying the data (when available) or other properties underlying the confidence of the measurements and their interpretation, such as the dispersion. When assessing quantitative data processing, such as, for example, the effect of data normalization, dispersion is often measured using metrics such as, for example, the standard deviation, the interquantile range (as visualized on boxplots), or the coefficient of variation, denoting the spread of a set of measurements. Assessment of results with respect to an expected ground truth often relies on the estimation of true and false positives and true and false negatives (to the extent these can be identified). These scores can be further summarized using adequate tools, such as receiver operating characteristic (ROC) curves (for binary classification), precision (a measure of exactness), recall (a measure of completeness), or the macro F1 score (the harmonic mean of the precision and recall; often used for multiclass classification). Accuracy, a measure of proximity to the reference measurement (systematic errors), and precision, a measurement of reproducibility of the measurement (random errors) of anticipated true positive measurements, are often used in quantitative assessments.20 When assessing imputation strategies, the comparison of the estimated/imputed values to known values can be performed using the root-mean-square error or any of its many variants. Assessment of search engines often uses the false discovery rate, the percent of identified features that are incorrect,35 computed as the ratio of false positives to the total of positive discoveries (false and true ones). In an ideal situation, one would also want to measure true and false negative outcomes of an experiment.
Too Many User-Definable Parameters
An excessive number of user-definable parameters complicates the comparison of computational methods. A program with five user-definable parameters with three possible settings each already allows for 35 = 243 possible parameter combinations. Methods with many user-definable parameters cause two problems: (1) It becomes difficult for end-users to correctly set the parameters, and experience shows that for real-life applications most users will use default settings, even if they are inappropriate. (2) Comparing methods becomes exceedingly difficult if many possible combinations of parameters have to be tested and compared against other methods.36 In a real-life situation the ground truth is usually unknown and thus parameters cannot be easily calibrated, and even moderate deviations from optimal parameter settings may lead to substantial loss of performance.36 Having many parameters also creates the danger that users might tweak parameters until they get a “desired” result, such as maximizing the number of differentially expressed proteins. The same applies to method comparison: Testing many possible parameter combinations against some reference data set leads to an overfitting problem. Thus, methods with many tunable parameters may have an intrinsic benefit compared to methods with fewer parameters that, however, does not necessarily reflect the performance expected in real-life applications.
We therefore recommend that (1) methods for MS data analysis should have as few user-definable parameters as possible, (2) if possible, parameters should be learned from the data17,22 (e.g., via built-in cross validation), and (3) if user-definable parameters are unavoidable, there should be very clear instructions on how to set these parameters depending on the experimental setup (e.g., depending on the experimental platform used, species the samples come from, goal of the experiment, etc.)
COMMUNITY RESOURCE FOR REFERENCE DATA SETS
We have described the importance of careful comparison designs, the selection of competitors to compare against, the utilization of different data, and the measurement of performance. In addition, adequate documentation, reporting, and dissemination of the comparison results, parameters, and, ideally, code, will enable both reviewers and future users a better interpretation and assessment of the newly proposed method. We argue that it is beneficial for the community at large to be able to adopt good practices and reuse valuable data sets to support and facilitate the systematic and sound evaluation and comparison of computational methods. Establishing fair comparisons is intrinsically difficult and time-consuming; ideally the opportunity to assess a method on a variety of data sets would be given to the original authors of the methods prior to comparisons. We also believe that facilitating reproducibility of such evaluations is essential, and requires the dissemination of data and code and the thorough reporting of metadata, evaluation design, and metrics.
The utilization of a variety of simulated, reference, and real data sets can go a long way in addressing the genuine challenges and pitfalls of method comparison,37 for instance, offer an online resource consisting of RNA-seq data from 18 different studies, to facilitate cross-study comparisons and the development of novel normalization methods. We have set up the RefData online resource (http://compms.org/ref) as part of the Computational Mass Spectrometry initiative to support the dissemination of such data sets. RefData enables members of the community to submit useful data sets, a short description, and links to relevant citations and publicly available data, for example, in ProteomeXchange,38 which will, in turn, be browsable and searchable. Rather than perpetually generating new data sets, this resource provides a diversity of data sets with baseline analyses obtained from published studies to facilitate method comparison. We invite interested parties to submit further data and continue this discussion on the CompMS public mailing list.
Acknowledgments
We thank Leibniz-Zentrum für Informatik Schloss Dagstuhl and the participants of the Dagstuhl Seminar 15351 “Computational Mass Spectrometry 2015” for useful discussions and suggestions of datasets for method evaluation and testing. We also thank Dr. David Tabb and Dr. Ron Beavis for suggesting reference datasets and two anonymous reviewers for insightful suggestions. L.G. was supported by a BBSRC Strategic Longer and Larger grant (Award BB/L002817/1). M.H. was supported by funds through National Institutes of Health from the National Institute of General Medical Sciences (Grant Nos. 2P50 GM076547/Center for Systems Biology, and GM087221). O.K. acknowledges funding from Deutsche Forschungsgemeinschaft (QBiC, KO-2313/6-1) and BMBF (de.NBI, 031A367). A.B. was supported by the German Federal Ministry of Education and Research (BMBF; grants: Sybacol & PhosphoNetPPM).
Footnotes
Notes
The authors declare no competing financial interest.
References
- 1.Aebersold R. Editorial: From Data to Results. Mol Cell Proteomics. 2011;10:E111.014787. doi: 10.1074/mcp.E111.014787. [DOI] [PMC free article] [PubMed] [Google Scholar]
- 2.Martens L, Kohlbacher O, Weintraub ST. Managing Expectations When Publishing Tools and Methods for Computational Proteomics. J Proteome Res. 2015;14:2002–2004. doi: 10.1021/pr501318d. [DOI] [PubMed] [Google Scholar]
- 3.Smith R, Ventura D, Prince JT. Novel algorithms and the benefits of comparative validation. Bioinformatics. 2013;29:1583–5. doi: 10.1093/bioinformatics/btt176. [DOI] [PubMed] [Google Scholar]
- 4.Boulesteix AL. On representative and illustrative comparisons with real data in bioinformatics: response to the letter to the editor by Smith et al. Bioinformatics. 2013;29:2664–6. doi: 10.1093/bioinformatics/btt458. [DOI] [PubMed] [Google Scholar]
- 5.Boulesteix AL, Lauer S, Eugster MJ. A plea for neutral comparison studies in computational sciences. PLoS One. 2013;8:e61562. doi: 10.1371/journal.pone.0061562. [DOI] [PMC free article] [PubMed] [Google Scholar]
- 6.Boulesteix AL. Ten simple rules for reducing overoptimistic reporting in methodological computational research. PLoS Comput Biol. 2015;11:e1004191. doi: 10.1371/journal.pcbi.1004191. [DOI] [PMC free article] [PubMed] [Google Scholar]
- 7.Boulesteix A-L, Hable R, Lauer S, Eugster MJA. A Statistical Framework for Hypothesis Testing in Real Data Comparison Studies. Am Stat. 2015;69:201–212. [Google Scholar]
- 8.Smith R, Prince JT. JAMSS: proteomics mass spectrometry simulation in Java. Bioinformatics. 2015;31:791–3. doi: 10.1093/bioinformatics/btu729. [DOI] [PubMed] [Google Scholar]
- 9.Noyce AB, Smith R, Dalgleish J, Taylor RM, Erb KC, Okuda N, Prince JT. Mspire-Simulator: LC-MS shotgun proteomic simulator for creating realistic gold standard data. J Proteome Res. 2013;12:5742–9. doi: 10.1021/pr400727e. [DOI] [PubMed] [Google Scholar]
- 10.Bielow C, Aiche S, Andreotti S, Reinert K. MSSimulator: Simulation of mass spectrometry data. J Proteome Res. 2011;10:2922–9. doi: 10.1021/pr200155f. [DOI] [PubMed] [Google Scholar]
- 11.Schulz-Trieglaff O, Pfeifer N, Gröpl C, Kohlbacher O, Reinert K. LC-MSsim - a simulation software for liquid chromatography mass spectrometry data. BMC Bioinf. 2008;9:423. doi: 10.1186/1471-2105-9-423. [DOI] [PMC free article] [PubMed] [Google Scholar]
- 12.Bernau C, Riester M, Boulesteix AL, Parmigiani G, Huttenhower C, Waldron L, Trippa L. Cross-study validation for the assessment of prediction algorithms. Bioinformatics. 2014;30:i105–12. doi: 10.1093/bioinformatics/btu279. [DOI] [PMC free article] [PubMed] [Google Scholar]
- 13.Zhang Y, Bernau C, Waldron L. simulatorZ: Simulator for Collections of Independent Genomic Data Sets. R package version 1.3.5. 2014 [Google Scholar]
- 14.Petyuk V. simMSnSet: Simulation of MSnSet Objects. R package version 0.0.2. 2015 [Google Scholar]
- 15.Speed TP. Terence’s Stuff: Does it work in practice? IMS Bull. 2012;41:9. [Google Scholar]
- 16.Rocke DM, Ideker T, Troyanskaya O, Quackenbush J, Dopazo J. Papers on normalization, variable selection, classification or clustering of microarray data. Bioinformatics. 2009;25:701–702. [Google Scholar]
- 17.Bond NJ, Shliaha PV, Lilley KS, Gatto L. Improving qualitative and quantitative performance for MS(E)-based label-free proteomics. J Proteome Res. 2013;12:2340–53. doi: 10.1021/pr300776t. [DOI] [PubMed] [Google Scholar]
- 18.Koh HW, Swa HL, Fermin D, Ler SG, Gunaratne J, Choi H. EBprot: Statistical analysis of labeling-based quantitative proteomics data. Proteomics. 2015;15:2580–91. doi: 10.1002/pmic.201400620. [DOI] [PubMed] [Google Scholar]
- 19.Ting L, Rad R, Gygi SP, Haas W. MS3 eliminates ratio distortion in isobaric multiplexed quantitative proteomics. Nat Methods. 2011;8:937–40. doi: 10.1038/nmeth.1714. [DOI] [PMC free article] [PubMed] [Google Scholar]
- 20.Kuharev J, Navarro P, Distler U, Jahn O, Tenzer S. Indepth evaluation of software tools for data-independent acquisition based label-free quantification. Proteomics. 2015;15:3140. doi: 10.1002/pmic.201400396. [DOI] [PubMed] [Google Scholar]
- 21.Mueller LN, Rinner O, Schmidt A, Letarte S, Bodenmiller B, Brusniak MY, Vitek O, Aebersold R, Müller M. SuperHirn – a novel tool for high resolution LC-MS-based peptide/protein profiling. Proteomics. 2007;7:3470–80. doi: 10.1002/pmic.200700057. [DOI] [PubMed] [Google Scholar]
- 22.Sikora-Wohlfeld W, Ackermann M, Christodoulou EG, Singaravelu K, Beyer A. Assessing computational methods for transcription factor target gene identification based on ChIP-seq data. PLoS Comput Biol. 2013;9:e1003342. doi: 10.1371/journal.pcbi.1003342. [DOI] [PMC free article] [PubMed] [Google Scholar]
- 23.Michaelson JJ, Alberts R, Schughart K, Beyer A. Datadriven assessment of eQTL mapping methods. BMC Genomics. 2010;11:502. doi: 10.1186/1471-2164-11-502. [DOI] [PMC free article] [PubMed] [Google Scholar]
- 24.Kanitz A, Gypas F, Gruber AJ, Gruber AR, Martin G, Zavolan M. Comparative assessment of methods for the computational inference of transcript isoform abundance from RNA-seq data. Genome Biol. 2015;16:150. doi: 10.1186/s13059-015-0702-5. [DOI] [PMC free article] [PubMed] [Google Scholar]
- 25.Love MI, Huber W, Anders S. Moderated estimation of fold change and dispersion for RNA-seq data with DESeq2. Genome Biol. 2014;15:550. doi: 10.1186/s13059-014-0550-8. [DOI] [PMC free article] [PubMed] [Google Scholar]
- 26.Gatto L, Breckels LM, Wieczorek S, Burger T, Lilley KS. Mass-spectrometry-based spatial proteomics data analysis using pRoloc and pRolocdata. Bioinformatics. 2014;30:1322–4. doi: 10.1093/bioinformatics/btu013. [DOI] [PMC free article] [PubMed] [Google Scholar]
- 27.Breckels LM, Gatto L, Christoforou A, Groen AJ, Lilley KS, Trotter MW. The effect of organelle discovery upon subcellular protein localisation. J Proteomics. 2013;88:129–40. doi: 10.1016/j.jprot.2013.02.019. [DOI] [PubMed] [Google Scholar]
- 28.Breckels LM, Holden S, Wojnar D, Mulvey CM, Christoforou A, Groen AJ, Kohlbacher O, Lilley KS, Gatto L. Learning from heterogeneous data sources: an application in spatial proteomics. bioRxiv. 2015 doi: 10.1101/022152. [DOI] [PMC free article] [PubMed] [Google Scholar]
- 29.Sheynkman GM, Johnson JE, Jagtap PD, Shortreed MR, Onsongo G, Frey BL, Griffin TJ, Smith LM. Using GalaxyP to leverage RNA-Seq for the discovery of novel protein variations. BMC Genomics. 2014;15:703. doi: 10.1186/1471-2164-15-703. [DOI] [PMC free article] [PubMed] [Google Scholar]
- 30.Groen AJ, Sancho-Andres G, Breckels LM, Gatto L, Ániento F, Lilley KS. Identification of trans-golgi network proteins in Arabidopsis thaliana root tissue. J Proteome Res. 2014;13:763–76. doi: 10.1021/pr4008464. [DOI] [PMC free article] [PubMed] [Google Scholar]
- 31.Beyer A, Hollunder J, Nasheuer HP, Wilhelm T. Posttranscriptional expression regulation in the yeast Saccharomyces cerevisiae on a genomic scale. Mol Cell Proteomics. 2004;3:1083–92. doi: 10.1074/mcp.M400099-MCP200. [DOI] [PubMed] [Google Scholar]
- 32.Brockmann R, Beyer A, Heinisch JJ, Wilhelm T. Posttranscriptional expression regulation: what determines translation rates? PLoS Comput Biol. 2007;3:e57. doi: 10.1371/journal.pcbi.0030057. [DOI] [PMC free article] [PubMed] [Google Scholar]
- 33.Vogel C, Marcotte EM. Insights into the regulation of protein abundance from proteomic and transcriptomic analyses. Nat Rev Genet. 2012;13:227–32. doi: 10.1038/nrg3185. [DOI] [PMC free article] [PubMed] [Google Scholar]
- 34.Jovanovic M, et al. Immunogenetics Dynamic profiling of the protein life cycle in response to pathogens. Science. 2015;347:1259038. doi: 10.1126/science.1259038. [DOI] [PMC free article] [PubMed] [Google Scholar]
- 35.Serang L, Kall O. Solution to Statistical Challenges in Proteomics Is More Statistics, Not Less. J Proteome Res. 2015;14:4099–103. doi: 10.1021/acs.jproteome.5b00568. [DOI] [PubMed] [Google Scholar]
- 36.Quandt A, Espona L, Balasko A, Weisser H, Brusniak M-Y, Kunszt P, Aebersold R, Malmström L. Using synthetic peptides to benchmark peptide identification software and search parameters for MS/MS data analysis. EuPa Open Proteomics. 2014;5:21–31. [Google Scholar]
- 37.Frazee AC, Langmead B, Leek JT. ReCount: a multiexperiment resource of analysis-ready RNA-seq gene count datasets. BMC Bioinf. 2011;12:449. doi: 10.1186/1471-2105-12-449. [DOI] [PMC free article] [PubMed] [Google Scholar]
- 38.Vizcaíno JA, et al. ProteomeXchange provides globally coordinated proteomics data submission and dissemination. Nat Biotechnol. 2014;32:223–6. doi: 10.1038/nbt.2839. [DOI] [PMC free article] [PubMed] [Google Scholar]