Abstract
Early-stage tumors in many cancers are characterized by vascular remodeling, indicative of transformations in cell function. We have previously presented a high-resolution ultrasound imaging approach for detecting these changes which is based on microbubble contrast agents. In this technique, images are formed from only the higher harmonics of microbubble contrast agents, producing images of vasculature alone with 100–200 μm resolution. In this article, shaped transmit pulses are applied to imaging the higher broadband harmonic echoes of microbubble contrast agents, and the effects of varying pulse window and phasing on microbubble and tissue harmonic echoes are evaluated using a dual-frequency transducer in vitro and in vivo. An increase in contrast-to-tissue ratio of 6.8 ± 2.3 dB was observed in vitro by using an inverted pulse with a cosine window relative to a non-inverted pulse with a rectangular window. The increase in mean image intensity due to contrast enhancement in vivo in five rodents was 13.9 ± 3.0 dB greater for an inverted cosine-windowed pulse and 17.8 ± 3.6 dB greater for a non-inverted Gaussian-windowed relative to a non-inverted pulse with a rectangular window. Implications for pre-clinical and diagnostic imaging are also discussed.
Keywords: Microbubbles, superharmonic, harmonic, pulse shape, pulse window, high-frequency ultrasound, acoustic angiography, contrast agent
Introduction
Early-stage tumors of the breast (Fox et al. 1995), prostate (Brawer et al. 1994), ovary (Byrne et al. 2003), and colon (Takahashi et al. 1995; Duff et al. 2007) are characterized by vascular remodeling, a re-structuring of circulatory anatomy indicative of underlying changes in cell growth, death, and migration (Gibbons and Dzau 1994). In the United States, there are 328.4 new cases of these cancers per 100,000 individuals per year, or approximately one million people (Howlader N 2014). Alterations in microvessel morphology initiate early in tumor development, when tumors are on the order of tens to hundreds of cells (Folkman 2006; Hanahan and Weinberg 2011). Due to the early onset of these changes and the underlying pathophysiology they represent, high resolution imaging of microvasculature has the potential to allow detection of tumors much earlier than the currently detectable size of approximately 107 cells or 1 mm (Duffy et al. 2006).
Non-invasive, high-resolution imaging of vascular anatomy has been demonstrated by several modalities. Micro-computed tomography (CT) and micro-digital subtraction angiography (DSA) with contrast agents have reported in-plane spatial resolutions less than 20 μm in mapping small animal vasculature (Figueiredo et al. 2012; Ehling et al. 2014). Magnetic resonance (MR) images of vasculature having spatial resolutions as fine as 130 μm in a single direction have also been reported (Zwick et al. 2009). However, ionizing radiation dose in CT and considerations of cost and availability for both CT and MR limit the practicality of using these modalities in repeated human imaging studies. Additionally, iodinated radiocontrast and gadolinium-based MR contrast agents can induce significant nephrotoxicity in human imaging (Shellock and Kanal 1999; Briguori et al. 2003; Sam et al. 2003). Alternatively, photoacoustic imaging has demonstrated vascular images of subcutaneous tumors with resolutions better than 200 μm without the need for exogenous contrast agents at typical penetration depths up to approximately 1 cm (Ku et al. 2005; Laufer et al. 2012).
Because of inherent advantages of high temporal resolution and low cost relative to other modalities, ultrasound has proven particularly useful for performing functional imaging of large vessels through the use of Doppler modes (Kasai 1986; Rubin et al. 1994; Loupas et al. 1995). The development of microbubble contrast agents enhanced signal-to-noise ratio (SNR) in Doppler imaging modes by providing an active acoustic source within the body for which received echoes originating from contrast agents provided increased backscattering relative to erythrocytes and were subject to attenuation in only a single direction. Development of contrast-specific imaging modes allowed formation of images from microbubble echoes alone while rejecting echoes arising from tissue. The ability to reject tissue with high specificity is quantified as contrast-to-tissue ratio (CTR), defined as:
| (1) |
where Vmicrobubble and Vtissue are measured peak voltages received by the transducer due to microbubbles and tissue, respectively. Note that this definition of CTR is consistent with our own previous work (Gessner et al. 2010; Lindsey et al. 2014) but different from the definition of Bouakaz et al. (Bouakaz et al. 2002), which defines CTR as “the ratio of the scattered power from the contrast bubbles to the scattered power from the tissue.” This definition is used in this work because peak RF amplitude is indicative of image intensity, and image lines are simply envelope-detected, compressed RF traces. Developed contrast-specific imaging approaches were extended beyond simple filtering to multi-pulse techniques designed to enhance CTR by cancelling the fundamental components of tissue echoes (Haider and Chiao 1999; Simpson et al. 1999; Phillips 2001; Borsboom et al. 2003; Eckersley et al. 2007; Leavens et al. 2007; Sun et al. 2007; Crocco et al. 2009).
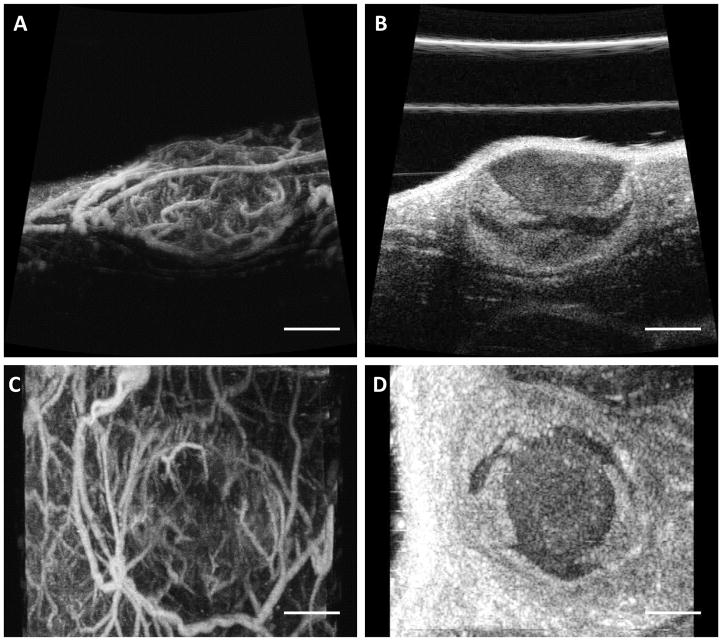
While contrast-specific imaging techniques have shown great promise for a wide range of applications in oncology (Harvey et al. 2000; Halpern 2006; Sever et al. 2011) due to greatly improved tissue rejection, they face several limitations. First, sensitivity to these signals is subject to transducer bandwidth. Second, multi-pulse techniques suffer from limited temporal resolution and thus are susceptible to physiological motion artifacts. Finally, spatial resolution is also inadequate for fully resolving microvasculature. As an alternative to multi-pulse techniques, researchers have demonstrated the ability to separate microbubble echoes from tissue echoes spectrally using two transducers to receive harmonic echoes at many times the transmitted frequency (Bouakaz et al. 2002; Kruse and Ferrara 2005). More recently, our lab has demonstrated the utility of dual-frequency transducers to produce highly specific images of vasculature (Gessner et al. 2010; Gessner et al. 2012; Gessner et al. 2013). Because images are formed from only superharmonic echoes at high frequencies (>15 MHz), this technique is capable of imaging vessels with resolution on the order of ~200 μm (Lindsey et al. 2014). Utilization of a lower transmit frequency allows for excitation of microbubbles closer to their resonance frequencies and provides better penetration relative to high frequency imaging. Using this approach, which we refer to as “acoustic angiography,” we have demonstrated the ability to differentiate healthy from tumor-bearing tissue based on quantitative, image-based metrics of angiogenesis (Gessner et al. 2012; Shelton et al. 2015). Figure 1 shows example acoustic angiography maximum intensity projections of tortuous vasculature associated with a subcutaneous tumor model, along with anatomical B-mode images of the same tissue volume.
Figure 1.
Maximum intensity projections of acoustic angiography images of a subcutaneous tumor in the axial (A) and coronal (C) views. Images on the right are representative B-mode slices of the same tissue volume in the axial (B) and coronal (D) planes. The scale bar shows 4 mm.
While the demonstrated capabilities of this technique for imaging vascular remodeling in early-stage tumors have been encouraging, the potential of this approach has not been fully explored. Recent in vitro studies have examined frequency and pressure combinations producing optimum CTR as well as the role of microbubble destruction in in superharmonic imaging (Lindsey et al. 2014; Lindsey et al. 2015). Results of these studies suggest opportunities exist for designing pulses which enhance specificity of dual-frequency contrast imaging.
In previous acoustic angiography imaging studies, the low frequency element of a custom dual-frequency transducer was excited at its resonance frequency using single-cycle pulses (Gessner et al. 2010). These short pulses ensure the broadband echoes necessary for high resolution images. Previously, Kruse and Ferrara used single-cycle and 10-cycle excitation pulses (Kruse and Ferrara 2005) while Bouakaz et al. used two-cycle excitation pulses for superharmonic imaging (Bouakaz et al. 2002). Alternatively, other researchers have used many-cycle pulses for imaging approaches relying on narrowband harmonics (Tang and Eckersley 2006; Guiroy et al. 2013).
While increasing pulse length is problematic for imaging broadband echoes, tailoring short pulses for this application has the potential to improve CTR without additional costs associated with synthesizing microbubble populations having desired size distributions. Transmitted pulses are often windowed in conventional B-mode ultrasound systems to increase spatial resolution by reducing transducer ringdown associated with sharp, rectangular windows (Ma et al. 2000). For similar reasons, digital filters with gradually decaying frequency responses are typically selected for application to received echoes. Previous efforts at shaping short pulses in contrast imaging include design of an optimal pulse for pulse inversion imaging within the bandwidth of a single transducer (Reddy and Szeri 2002) and pulse smoothing for receiving at twice the transmitted frequency (Averkiou and Rafter 2005).
In this article, we describe the first application of shaped pulses in imaging the higher broadband harmonic echoes of microbubble contrast agents. The effects of varying pulse window and phasing on microbubble and tissue harmonic echoes are evaluated using a dual-frequency transducer in vitro and in vivo. Results of pulse shaping on sensitivity and specificity of dual-frequency superharmonic imaging and implications for pre-clinical and diagnostic imaging are discussed.
Materials and Methods
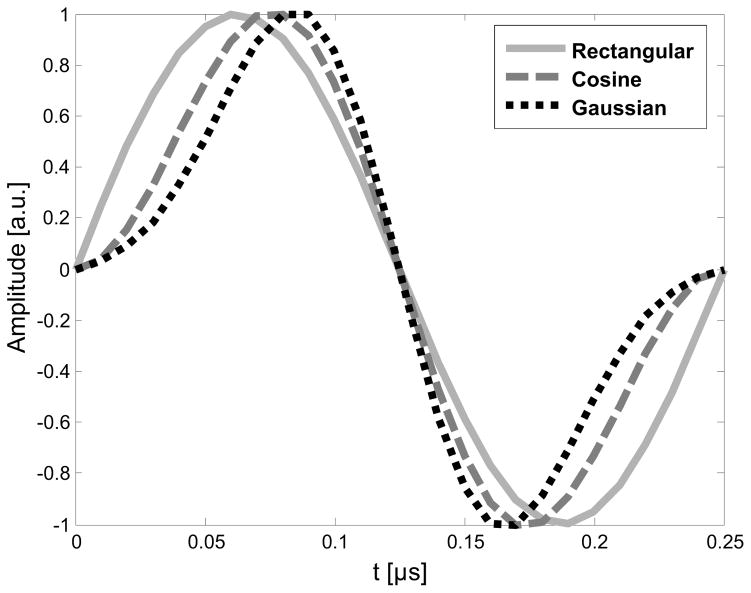
In vitro and in vivo imaging were performed with a modified VisualSonics RMV 710B transducer on a Vevo 770 ultrasound scanner (VisualSonics, Toronto, Canada). The custom dual-frequency transducer design has been previously described (Gessner et al. 2010) and consists of a central high frequency element (25 MHz) for receiving surrounded by an annular low frequency element (4 MHz) for transmitting, both of which are mechanically swept to acquire two-dimensional images. The entire probe can be translated in the elevation direction using a motion stage controlled by the imaging system in order to acquire a volumetric image. The receive line also includes a passive 15 MHz, 7 pole, highpass Chebyshev filter (TTE Inc., Los Angeles, CA). Transmit pulses were created in MATLAB (The MathWorks Inc., Natick, MA) and transferred via GPIB cable to an arbitrary waveform generator (Tektronix AFG3101, Beaverton, OR) connected to a 55 dB RF amplifier (ENI, Rochester, NY). The three pulse windows used for these experiments were rectangular, cosine, and Gaussian; both inverted and non-inverted phasings (i.e. 0 and 180°) were tested for each window. Figure 2 shows the windowed voltage waveforms applied to the transducer. Note that application of Gaussian windows to voltage waveforms in the time domain does not constitute a simple filtering operation, as a true Gaussian window is non-causal since it extends from −∞ to ∞ and thus must be truncated (Harris 1977). However, when windowing transmitted waveforms which are known a priori (rather than filtering an acquired signal), causality is not an issue. In this work, a narrow Gaussian window was selected (α=2.5; σ=.05 us, where α is dispersion parameter and σ is standard deviation) to provide slow roll-off (increased bandwidth) in the frequency domain relative to other windows tested (Harris 1977).
Figure 2.
Three non-inverted voltage waveforms having rectangular, cosine, and Gaussian windows were used to excite the transducer at 4 MHz. These waveforms were produced using a programmable arbitrary waveform generator and power amplifier.
In vitro studies
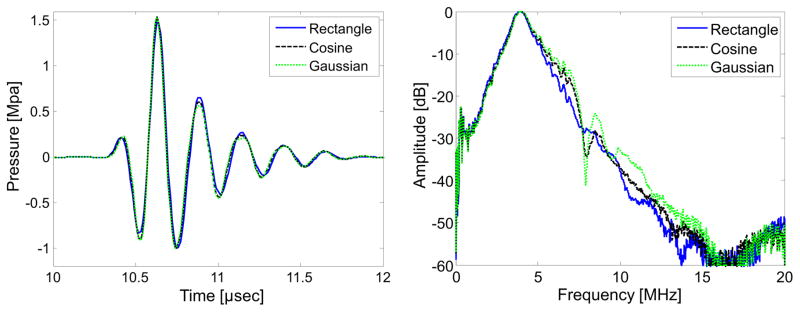
Acoustic pressure calibrations were performed with a calibrated needle hydrophone (HNA 0400, Onda Corp., Sunnyvale, CA) in a water tank. Figure 3 shows the pressure waveforms measured by the hydrophone at the focus for the 3 different pulse windows in the non-inverted form, as well as the frequency spectra of the incident pulses within the bandwidth of the hydrophone. Each windowed pulse was pressure-matched for testing and created in 3 forms: one having 0° phase shift and two versions having 180° phase shift (inverted). The non-inverted pulses were standardized with 1 MPa peak negative pressure (PNP), which resulted in approximately 2 MPa pressure, peak-to-peak. While transmitted pulses appear quite similar in the time domain (Fig. 3A), differences in bandwidth and harmonic content transmitted below the −10 dB level may be better appreciated in the frequency domain in Fig. 3B. The Gaussian-windowed waveform exhibits the broadest bandwidth and lowest transmitted harmonics. Effects of nonlinear propagation in water are minimal, as nonlinear distortion was not observed with increasing peak pressures during hydrophone calibrations. Due to production of unbalanced waveforms by the transducer, the absolute value of peak negative and peak positive pressures differed by greater than 10% when the input voltage waveform was inverted. Thus two versions of inverted pulses were studied: one with PNP of 1 MPa and one with peak-to-peak pressure of 2 MPa. The PNP-matched pulses had peak positive pressures above 1 MPa (yielding peak-to-peak pressure greater than 2 MPa). Alternatively, when the peak-to-peak pressure of the windowed pulses was set to 2 MPa, the PNP fell below 1 MPa. The three pulses investigated for each window shape will thus be referred to as: non-inverted, inverted matched PNP, and inverted matched peak-to-peak. As both peak pressure and pulse energy have been reported to influence microbubble response (Apfel and Holland 1991), testing pulses having both matched peak negative pressure and matched pulse energy allows for investigation of the dependence of mechanisms of microbubble and tissue superharmonic signal generation on peak pressure, pulse energy, and phase of the transmitted pulse.
Figure 3.
(A) Hydrophone-measured acoustic waves produced by the prototype transducer as result of excitation using the three waveforms in Fig. 2. (B) Power spectra of the waveforms in (A) indicate that measured bandwidth increases slightly going from rectangular to cosine to Gaussian window.
Lipid-encapsulated microbubble contrast agent was prepared as previously described (Streeter et al. 2010), and microbubble signals were quantified by diluting microbubbles to 1% (107 bubbles/mL, distribution centered at a diameter of 1 um) in water and flowing through a 0.2 mm (inner diameter) cellulose tube (Spectrum Labs, Rancho Dominguez, CA) positioned in a water bath at the acoustic focus at a flow rate of 30 μL/min (Harvard Apparatus PHD2000, Holliston, MA), which is a linear flow rate of 1.59 cm/s. Pulse repetition frequency (PRF) was 4 kHz. A custom LABVIEW (National Instruments, Austin, TX) program was used to acquire 100 consecutive lines of radiofrequency (RF) data containing superharmonic echoes from microbubbles for each pulse shape tested. Data were acquired over a 12 μsec axial window centered about the focus. Prior to acquisition, it was verified that the acquired microbubble peak-to-peak amplitude did not diminish during 100 acquisitions at this flow rate and PRF.
Superharmonic echoes from tissue were measured using chicken thigh positioned at the acoustic focus and coupled to the transducer face with ultrasound gel. Chicken thigh was chosen as a representative tissue specimen due to the presence different types of tissue including skin, bone, and muscle which are also present in vivo. One hundred lines were acquired at each of 3 different spatial positions within the tissue, with the same locations compared across different pulse types. Multiple positions in the tissue were examined in order to ensure that results were not biased by a single speckle realization or by a single propagation path through tissue, which might have featured either uncharacteristically high or low degrees of nonlinear propagation. For both microbubble and tissue data, stationary echoes (i.e. cellulose tube) were removed by wall filtering (FIR, first order), and then a seventh-order Butterworth bandpass was applied (10–30 MHz). Mean microbubble response was determined by computing the peak-to-peak voltage of the received waveform for each line for both microbubble (Vmicrobubble) and tissue (Vtissue) data, then averaging within each pulse shape. Mean tissue response was similarly computed, with the exception that peak-to-peak voltages from 3 different spatial locations were averaged in computing the mean and standard deviation of tissue response. CTR was computed as shown in Equation 1. All processing and analysis were performed in MATLAB.
In vivo studies
Five female Fischer 344 rats were used for in vivo testing of transmit pulse shape for acoustic angiography. Animal studies were performed in accordance with the University of North Carolina Institutional Animal Care and Use Committee. Animals were anesthetized using vaporized isoflurane and placed on a heated imaging stage. The right flank was shaved and depilated, and ultrasound gel was applied to couple the skin to the transducer face. A 24 gauge catheter was inserted in the tail vein to allow intravenous administration of the microbubble contrast agent. Imaging was performed at a frame rate of 4.5 frames per second, with an elevational step size of 0.15 mm used to acquire a three dimensional volume spanning 15 mm. During contrast-enhanced imaging, a 50% dilution of microbubbles in sterile saline was infused at 35 μL/min.
Pre- and post-contrast injection scans of the same tissue volume were taken with each transmit pulse shape. In order to provide an image-based metric which is similar to CTR, we computed the increase in intensity (dB) for all voxels above the noise floor in each volume after contrast enhancement. The level of the noise floor was determined experimentally by acquiring a volume without transmitting. In this particular type of imaging, there is only signal in the locations corresponding to vasculature (or tissue artifact), which results in most voxels within a 3D volume having values close to zero. For this reason, we computed the difference in intensity after contrast enhancement by first applying an intensity threshold to identify voxels which contained non-noise values. Because the post-contrast injection image contains signals from tissue and from microbubbles flowing within the vasculature, it is appropriate to compare pre- and post-contrast administration scans using relative enhancement rather than CTR, which implies measurements of tissue and contrast signal amplitude alone.
Results
In vitro studies
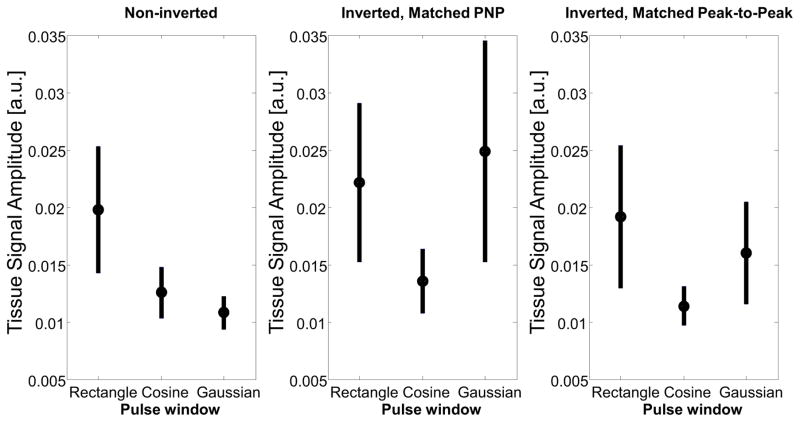
In vitro measurements of tissue and microbubble signal amplitude were acquired, and CTR was calculated using equation 1. For the non-inverted pulses, tissue amplitude decreased in the windowed pulses, as the bandwidth of the pulse increases slightly going from the rectangular window to the cosine window to the Gaussian window. When the pulse is inverted, the cosine window has the lowest tissue amplitude (Figure 4). Both pressure versions of the inverted pulses show a similar trend, with the cosine window having the lowest average tissue and microbubble signal amplitude of the inverted waveforms. However, it is clear that the PNP matched pulses, which have greater pulse energy, produce greater tissue signal than both the peak-to-peak-matched inverted pulses and the non-inverted pulses. Thus, because superharmonic signal generation in tissue appears to depend more heavily on total pulse energy than on PNP, minimization of peak-to-peak pressure (rather than peak negative pressure) results in maximization of CTR if a constant microbubble signal is assumed.
Figure 4.
In vitro measurements of tissue amplitude as a result of transmitting non-inverted waveforms (peak negative pressure: 1 MPa), inverted waveforms with matched peak negative pressure (1 MPa), and inverted waveforms with matched peak-to-peak pressure (peak-to-peak pressure: 2 MPa). Note that these statistics are across three different locations in tissue in order to assess different speckle realizations.
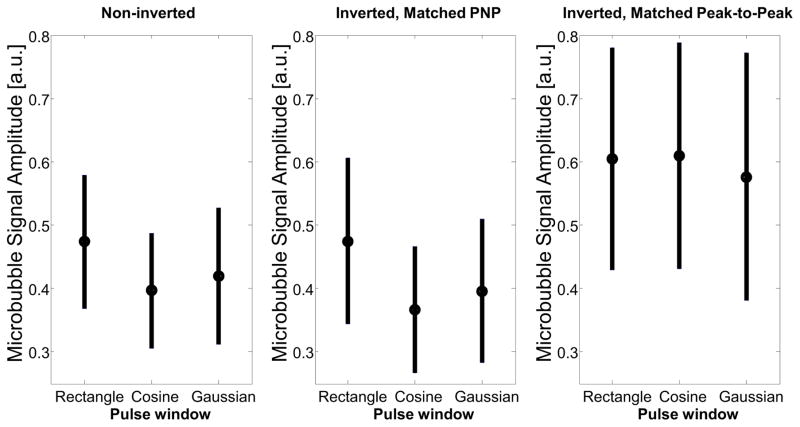
Broadband superharmonic signal was also quantified from populations of diluted microbubbles flowing through the cellulose tube in a water bath. The non-inverted and inverted, PNP-matched pulses showed very similar trends, with the strongest signal from a rectangular window and lower signal amplitude from the cosine and Gaussian windowed pulses (Figure 5). The fact that non-inverted and inverted, matched PNP pulses—both having a PNP of 1 MPa but very different peak-positive and peak-to-peak pressures— produce signals with similar amplitudes is consistent with previous results reporting cavitation thresholds which are primarily dependent on peak negative pressures (Chomas et al. 2001a; Chomas et al. 2001b; Porter et al. 2006; Yeh and Su 2008). The inverted pulse with matched peak-to-peak pressure shows similar amplitude for all three windows, and has higher amplitude than the non-inverted, and PNP-matched inverted pulses, which is consistent with the trend observed at low frequencies by Morgan et al. which showed that the spectra of microbubbles exposed to an inverted transmit pulse “are broad with the energy spread across a larger range of frequencies,” compared to a non-inverted pulse with the same PNP and total energy (Morgan et al. 2000).
Figure 5.
In vitro measurements of microbubble response as a result of transmitting noninverted waveforms (peak negative pressure: 1 MPa), inverted waveforms with matched peak negative pressure (1 MPa), and inverted waveforms with matched peak-to-peak pressure (peak-to-peak pressure: 2 MPa).
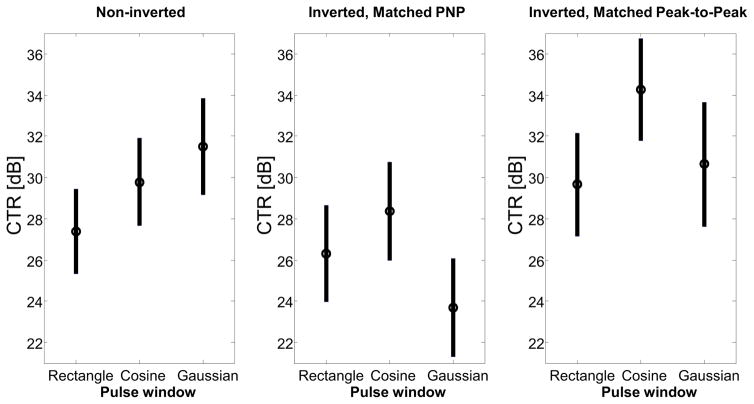
Combining the tissue and microbubble data into a measurement of CTR (Figure 6) allows identification of the best pulses for optimizing acoustic angiography imaging. For the noninverted pulse group, the Gaussian window produces the best CTR due to minimization of tissue signal. When comparing the inverted pulses, it is clear that matching peak-to-peak pressure produces better CTR than matching PNP. Since matching PNP greatly increases the pulse energy and produces a large increase in tissue harmonic signals but a lesser change in microbubble amplitude, the PNP-matched, inverted waveforms experience decreased CTR due to the increased tissue signal. The inverted cosine (peak-to-peak matched) waveform produces the highest CTR, with a mean increase of 4.6 dB relative to the inverted rectangular, matched peak-to-peak waveform and a mean increase of 6.8 dB relative to the non-inverted rectangular, matched peak-to-peak waveform. The improvement in CTR was statistically significant using a two-sided t-test, with p<0.01.
Figure 6.
In vitro measurements of contrast-to-tissue ratio (CTR) as a result of transmitting noninverted waveforms (peak negative pressure: 1 MPa), inverted waveforms with matched peak negative pressure (1 MPa), and inverted waveforms with matched peak-to-peak pressure (peak-to-peak pressure: 2 MPa). The inverted cosine waveform produced the peak CTR, followed by the non-inverted Gaussian waveform.
In vivo studies
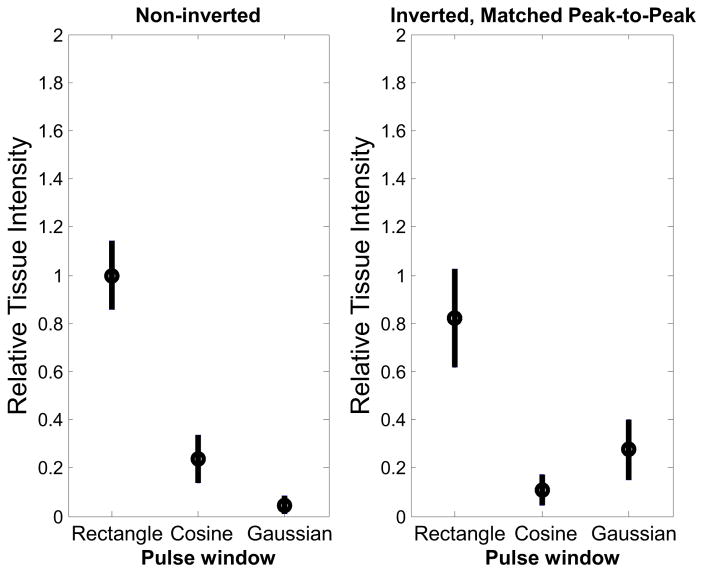
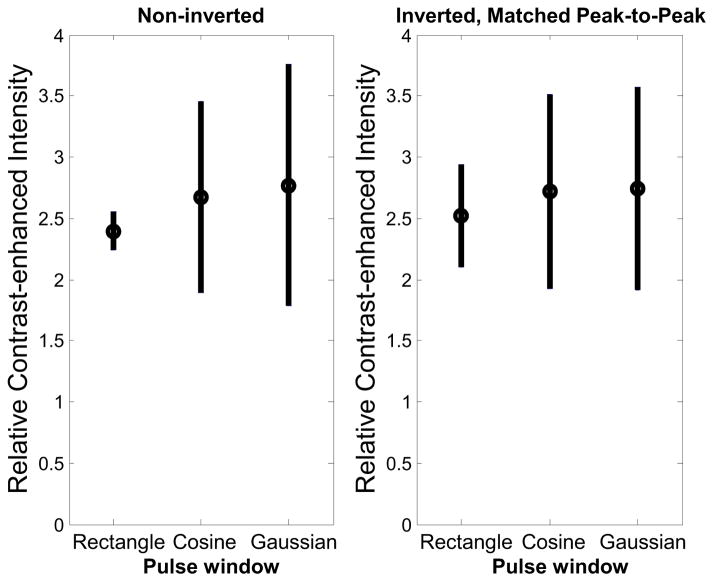
Image volumes taken from the flank of 5 rats were used to compare tissue and microbubble signals from the 3 different pulse windows. For the in vivo tests, only the peak-to-peak matched pressure forms of the inverted pulses were used to compare to the non-inverted pulses since they showed uniformly higher CTR in the in vitro tests. For both pulse phasings, tissue signal decreases as the pulse is more heavily windowed (Fig. 7), exhibiting the highest amplitude tissue signal for a rectangular window and progressively less for the cosine and Gaussian windows, similar to the trends observed in vitro (Fig. 4) for non-inverted pulses. It should be noted that the Gaussian-windowed pulse also has the broadest bandwidth and lowest amplitude of transmitted harmonics. As was observed in vitro, microbubble responses were similar across all pulse windows for the in vivo images (Fig. 8).
Figure 7.
Relative tissue intensity in vivo before contrast injection for (left) non-inverted and (right) inverted, matched peak-to-peak pressure waveforms. Results are averaged across 100 slices in 5 animals. The non-inverted Gaussian waveform produces the lowest tissue response.
Figure 8.
Relative contrast-enhanced intensity in vivo after contrast injection for (left) noninverted and (right) inverted, matched peak-to-peak pressure waveforms. Results are averaged across 100 slices in 5 animals.
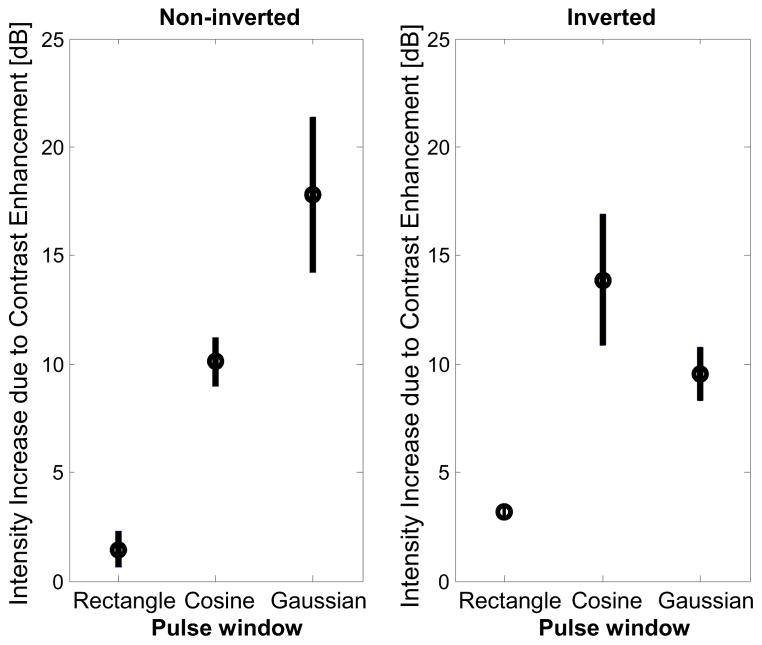
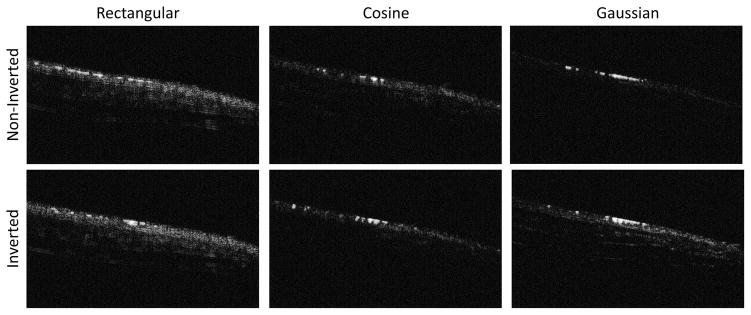
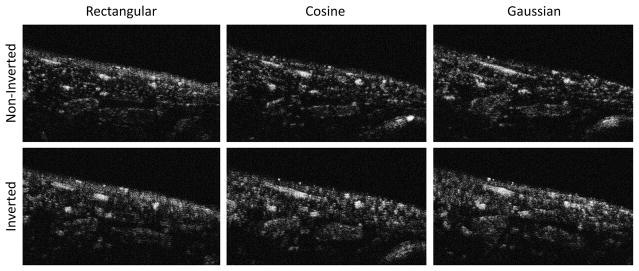
In Fig. 9, the increase in image intensity due to contrast enhancement is shown for each window type. In this figure, only non-noise voxels are considered. Use of a non-inverted Gaussian-windowed waveform produced the greatest increase in image intensity, indicating that modifying pulse window affects the mean brightness of these individual voxels. The CTR trends observed in vitro (Fig. 6) are reflected in vivo within each phasing. Illustrative images of a single slice in vivo in one animal before and after contrast enhancement are shown in Figures 10 and 11, respectively.
Figure 9.
Increase in intensity due to contrast enhancement in vivo for (left) non-inverted and (right) inverted, matched peak-to-peak pressure waveforms. Results are averaged across 100 slices in 5 animals. Peak enhancement was observed when a non-inverted Gaussian pulse was transmitted; an inverted cosine pulse produced a similar result.
Figure 10.
Illustrative in vivo images before contrast enhancement formed by transmitting noninverted (top row) and inverted waveforms for rectangular, cosine, and Gaussian windowed pulses (left to right). Results before contrast injection in all animals are summarized in Fig. 5A. The low tissue response of the non-inverted Gaussian waveform is readily visible here (top right). The length of the scale bar is 4 mm.
Figure 11.
Illustrative in vivo images after contrast enhancement formed by transmitting noninverted (top row) and inverted waveforms for rectangular, cosine, and Gaussian windowed pulses (left to right). The same slice of the same animal shown in Fig. 6A is displayed here for direct comparison. Results after contrast injection in all animals are summarized in Fig. 5B. While the image formed with the non-inverted Gaussian waveform performs best at rejecting tissue, the inverted cosine waveform appears to provide enhanced sensitivity at the cost of reduced resolution. The length of the scale bar is 4 mm.
When considering mean brightness of visible voxels (Fig. 9), all windowed waveforms increased brightness of these voxels by at least 8 dB relative to the non-inverted, rectangle-windowed pulse, with the non-inverted, Gaussian-windowed pulse yielding the greatest increase in brightness (17.8 ± 3.56 dB) compared to the non-inverted rectangular pulse (1.45 ± 0.83 dB). In vivo, the microbubble signals showed less variation due to pulse window shape than the tissue data, consistent with the in vitro CTR measurements. In vivo results indicate that the two pulses producing the highest percent contrast enhancement are the non-inverted Gaussian window and the inverted cosine window, which is consistent with in vitro results (Fig. 6).
Discussion
Comparing in vitro and in vivo results
In assessing differences between in vitro and in vivo results, it is important to consider the different types of data which contribute to each of the two sets of results. While superharmonic tissue echoes can be readily measured using RF data as was done for in vitro CTR studies, the system display uses envelope-detected, logarithmically-compressed data. In light of this compression, a brightness setting was selected to ensure that no saturation of image brightness values occurred in this study, allowing for quantitative comparison across acquired volumes from different animals. In future studies, it might be possible to increase initial brightness to allow many of the weakest voxels, which commonly arise from tissue rather than microbubbles, to be mapped to higher non-zero values for more direct comparison with in vitro CTR measurements, though saturation must be avoided.
In analyzing relative contrast enhancement in vivo, there is a large difference in the mean intensity of non-noise pixels before (Fig. 7) and after contrast enhancement (Fig. 8); this improvement is summarized in Figure 9. The combined effect of logarithmic compression and similar post-enhancement values across varying pulse shapes in Fig. 8 suggests that the degree to which a transmitted pulse suppresses tissue echoes is the determining factor in contrast enhancement and thus observed image quality in vivo. For these reasons, the windowed pulses yielded significantly higher enhancement compared to a rectangular pulse due to superior minimization of tissue echoes. In further comparing in vitro CTR (Fig. 6) and in vivo contrast enhancement (Fig. 9), the increase in mean intensity of the cosine- or Gaussian-windowed pulse (inverted or non-inverted) relative to a rectangular-windowed pulse is also larger in vivo than the CTR difference observed in vitro. This may be expected given that the log compression of signals in the imaging system before display produces greater differences in image intensity than in CTR measured using RF data.
Transducer nonlinearities in contrast imaging
Generation of linear waveforms is particularly important for imaging techniques which rely on non-linear mechanisms of signal production while assuming a linear system response. Production of unbalanced waveforms by the prototype transducer played a role in this study due to the inability to achieve similar peak pressures when the transmitted voltage waveform was inverted. Consistent with this observation, this transducer also exhibited a large discrepancy between peak negative and peak positive pressures within a single pulse (Figure 3). Based on hydrophone measurements performed at peak pressures up to 1.4 MPa (higher than pressures used in the reported experiments), this transducer behavior appears to remain constant with increasing pressure, indicating that it is neither an effect of nonlinear propagation in water, nor is it the result of voltage-dependent transducer performance beyond a certain threshold. We have recently conducted studies investigating the role of microbubble shell fragmentation and loss of core gas in superharmonic signal generation which indicate that some form of shell disruption is required to produce the signals used in this imaging technique (Lindsey et al. 2015). This suggests that this particular imaging approach may be quite sensitive to the relative peak positive and peak negative pressures in the pulse applied by the transducer, as peak negative pressure is strongly associated with shell fragmentation, though pulse energy is believed to also play a role (Apfel and Holland 1991).
A transducer producing a pulse with equivalent peak positive and peak negative pressures would allow the applied pressure wave to be designed more precisely through the use of windowing. The relative amplitudes of subsequent peaks transmitted by a piezoelectric transducer are determined primarily by the differences in acoustic impedance between the active material and the bounding materials, i.e. the acoustic backing and the matching layer(s) or tissue in the front (Hunt et al. 1983). Piezoelectric composite transducers have demonstrated the ability to precisely control acoustic impedance by varying the ceramic volume ratios (Ritter et al. 2002)(Foster 2009). By precise simulation of piezocomposite layers and backing layers during the transducer design process, it may be possible to design a transducer having an impulse response with nearly equivalent peak positive and peak negative pressures.
In this work, we have presented in vitro studies with waveforms having phasings of 0° (“noninverted”) and 180° (“inverted”). Due to waveforms produced by the prototype transducer, simply changing the polarity of the applied voltage waveform produced an inverted waveform with a peak positive pressure that was not similar to the peak negative pressure of the noninverted pressure waveform. In order to address differences in microbubble response arising from varying peak pressure as well as those arising from varying pulse energy, two types of inverted waveforms were tested: 1) inverted waveforms having peak-to-peak pressure (i.e. pulse energy) matched to that of the non-inverted waveform, and 2) inverted waveforms having a peak negative pressure equivalent to that of the non-inverted waveform. Matched PNP waveforms had peak-to-peak pressures which exceeded that of the both the non-inverted waveforms and the inverted waveforms with matched peak-to-peak pressures, however their microbubble response was very similar to the non-inverted waveforms and lower than the inverted, matched peak-to-peak waveforms (Fig. 5). While the underlying nature of this behavior is not entirely clear, several potential explanations exist. First, in examining hydrophone-measured inverted waveforms with matched peak negative pressure, the harmonic generation in water was slightly higher (~1 dB), resulting in a reduction in low-frequency energy arriving at the microbubbles compared to the inverted waveforms with matched peak-to-peak pressure. Secondly, all microbubbles are flowed through a cellulose tube, the wall of which could produce small, pressure-dependent distortions in the waveform propagating through the tube.
In addition, inverting the waveform and matching pulse energy (i.e. using a lower peak negative pressure than the non-inverted case) produced microbubble superharmonic signals with higher amplitude than the non-inverted waveform within each window type. In a recent study of the effect of peak negative pressure and frequency of single-cycle transmit pulses on microbubble superharmonic signal production (Lindsey et al. 2015), we found that superharmonic signals were produced due to both totally destructive microbubble shell rupture and partially destructive shell fragmentation and reformation. While the peak negative pressures used in the current study were sufficiently high at the focus to ensure total microbubble destruction, it is possible that microbubbles positioned near but not directly within the focus received pressures in the partially-destructive regime. Because these microbubbles were not destroyed, any slow-moving microbubbles or those adhering to the wall of the tube could then be insonified repeatedly. Due to the inherently nonlinear response of microbubbles, the question of unbalanced waveforms is an important consideration in contrast imaging approaches.
Understanding the role of pulse shaping in CTR
Based on the presented results, applying windows to single-cycle pulses can make a visible, quantifiable difference in the image quality of broadband superharmonic images. One hypothesis is that by reducing transmission of narrowband harmonics which would be received within the bandwidth of the high frequency receiving element, the amplitudes of received tissue harmonic signals are reduced, increasing CTR. Though this requires further testing, it is consistent with the observed result that pulse windowing has a greater impact on tissue harmonics than on microbubble harmonics. In addition to the aforementioned effect of image compression, the magnitude of the increase in CTR (6.8 ± 2.3 dB) induced due to pulse windowing may also be explained by the fact that superharmonic images are formed from low-amplitude echoes relative to conventional (B-mode) ultrasound and contain almost exclusively microbubble signals. This may lead to small differences in microbubble excitation producing changes which might not be noticeable in ultrasound imaging at the fundamental frequency but are readily apparent in superharmonic imaging after filtering and amplification.
Implications for in vivo imaging
Results presented indicate that pulse shape can be selected to maximize CTR (inverted cosine window) or to maximize tissue rejection (non-inverted Gaussian window). To date, the imaging approach described in this article has been tested only in pre-clinical studies with small animals. Presented results in 5 rats indicate that pulse windowing is directly applicable to pre-clinical imaging studies and will produce immediate and consistent improvements in CTR.
Superharmonic “acoustic angiography” imaging of contrast agents enables high resolution imaging by forming images from high frequency signals which are subject to attenuation in only a single direction. However, the high-frequency content and relatively low amplitudes of these echoes still limits the feasible imaging depth to approximately 2.5 cm with current dual-frequency transducer prototypes. In order to extend applicability of this approach to a wider base of clinical applications, it is desirable to increase the depth of penetration. One factor critical to designing dual frequency transducers for specialized applications will be choosing the frequency combinations which maximize CTR given constraints on resolution and imaging depth, a subject we have recently examined (Lindsey et al. 2014). However, if the center frequency of the high frequency receiving element is reduced to increase depth of penetration, minimizing tissue harmonics within the transducer bandwidth becomes an additional factor critical for maintaining high image quality through adequate rejection of tissue signals. We have shown here that pulse windowing can increase CTR, independent of transducer frequencies, microbubble size, or concentration. Windowed pulses (both cosine and Gaussian) provide significantly superior enhancement of contrast signals as compared to a rectangular window. In addition, clinical imaging places further restrictions on intravenous microbubble dose and mechanical index as compared to pre-clinical imaging of small animals. For this reason, the ability to improve CTR for a given combination of transmit and receive frequencies without increasing microbubble concentration or acoustic pressure is a valuable advancement.
Summary
Having previously presented a microbubble-based ultrasound imaging approach for high resolution imaging of vascular morphology, in this article we reported on the effect of pulse shape on microbubble superharmonic signals. The effects of varying pulse window and phasing on microbubble and tissue harmonic echoes were evaluated using a dual-frequency transducer in vitro and in vivo. An increase in contrast-to-tissue ratio of 6.8 ± 2.3 dB was observed in vitro by using an inverted pulse with a cosine window relative to a non-inverted pulse with a rectangular window. In in vivo imaging of five rodents, the increase in the mean intensity due to contrast enhancement was 13.9 ± 3.0 dB greater for an inverted cosine-windowed pulse and 17.8 ± 3.6 dB greater for a non-inverted Gaussian-windowed relative to a non-inverted pulse with a rectangular window. Improvements in CTR appear to be the result of reduction of tissue harmonics and enhanced microbubble superharmonic signals from inverted phasing.
Acknowledgments
This work was supported by Grant R01CA170665 and Training Grant T32HL069768 from the National Institutes of Health, as well as Grant PC111309 from the Department of Defense. The authors thank Jim Tsuruta for preparation of lipid solutions and Anthony Novell for assistance in programming the arbitrary waveform generator. The authors also thank Emmanuel Cherin, Mike Lee, and F. Stuart Foster for fabricating the transducer and Emmanuel Cherin providing helpful technical feedback on this article.
Footnotes
Publisher's Disclaimer: This is a PDF file of an unedited manuscript that has been accepted for publication. As a service to our customers we are providing this early version of the manuscript. The manuscript will undergo copyediting, typesetting, and review of the resulting proof before it is published in its final citable form. Please note that during the production process errors may be discovered which could affect the content, and all legal disclaimers that apply to the journal pertain.
References
- Apfel RE, Holland CK. Gauging the likelihood of cavitation from short-pulse, low-duty cycle diagnostic ultrasound. Ultrasound Med Biol. 1991;17:179–85. doi: 10.1016/0301-5629(91)90125-g. [DOI] [PubMed] [Google Scholar]
- Borsboom JM, Chin CT, de Jong N. Nonlinear coded excitation method for ultrasound contrast imaging. Ultrasound in medicine & biology. 2003;29:277–84. doi: 10.1016/s0301-5629(02)00712-3. [DOI] [PubMed] [Google Scholar]
- Bouakaz A, Frigstad S, Ten Cate FJ, de Jong N. Super harmonic imaging: a new imaging technique for improved contrast detection. Ultrasound in medicine & biology. 2002;28:59–68. doi: 10.1016/s0301-5629(01)00460-4. [DOI] [PubMed] [Google Scholar]
- Brawer MK, Deering RE, Brown M, Preston SD, Bigler SA. Predictors of pathologic stage in prostatic carcinoma. The role of neovascularity Cancer. 1994;73:678–87. doi: 10.1002/1097-0142(19940201)73:3<678::aid-cncr2820730329>3.0.co;2-6. [DOI] [PubMed] [Google Scholar]
- Briguori C, Tavano D, Colombo A. Contrast agent--associated nephrotoxicity. Prog Cardiovasc Dis. 2003;45:493–503. doi: 10.1053/pcad.2003.YPCAD16. [DOI] [PubMed] [Google Scholar]
- Byrne AT, Ross L, Holash J, Nakanishi M, Hu L, Hofmann JI, Yancopoulos GD, Jaffe RB. Vascular endothelial growth factor-trap decreases tumor burden, inhibits ascites, and causes dramatic vascular remodeling in an ovarian cancer model. Clin Cancer Res. 2003;9:5721–8. [PubMed] [Google Scholar]
- Chomas JE, Dayton P, Allen J, Morgan K, Ferrara KW. Mechanisms of contrast agent destruction. IEEE transactions on ultrasonics, ferroelectrics, and frequency control. 2001a;48:232–48. doi: 10.1109/58.896136. [DOI] [PubMed] [Google Scholar]
- Chomas JE, Dayton P, May D, Ferrara K. Threshold of fragmentation for ultrasonic contrast agents. Journal of biomedical optics. 2001b;6:141–50. doi: 10.1117/1.1352752. [DOI] [PubMed] [Google Scholar]
- Crocco M, Pellegretti P, Sciallero C, Trucco A. Combining multi-pulse excitation and chirp coding in contrast-enhanced ultrasound imaging. Measurement Science & Technology. 2009;20 [Google Scholar]
- Duff SE, Jeziorska M, Kumar S, Haboubi N, Sherlock D, O’Dwyer ST, Jayson GC. Lymphatic vessel density, microvessel density and lymphangiogenic growth factor expression in colorectal cancer. Colorectal Dis. 2007;9:793–800. doi: 10.1111/j.1463-1318.2006.01199.x. [DOI] [PubMed] [Google Scholar]
- Duffy SW, Tabar L, Vitak B, Warwick J. Tumor size and breast cancer detection: What might be the effect of a less sensitive screening tool than mammography? Breast Journal. 2006;12:S91–S5. doi: 10.1111/j.1075-122X.2006.00207.x. [DOI] [PubMed] [Google Scholar]
- Eckersley RJ, Tang MX, Chetty K, Hajnal JV. Microbubble contrast agent detection using binary coded pulses. Ultrasound in Medicine and Biology. 2007;33:1787–95. doi: 10.1016/j.ultrasmedbio.2007.05.015. [DOI] [PubMed] [Google Scholar]
- Ehling J, Theek B, Gremse F, Baetke S, Mockel D, Maynard J, Ricketts SA, Grull H, Neeman M, Knuechel R, Lederle W, Kiessling F, Lammers T. Micro-CT imaging of tumor angiogenesis: quantitative measures describing micromorphology and vascularization. Am J Pathol. 2014;184:431–41. doi: 10.1016/j.ajpath.2013.10.014. [DOI] [PMC free article] [PubMed] [Google Scholar]
- Figueiredo G, Brockmann C, Boll H, Heilmann M, Schambach SJ, Fiebig T, Kramer M, Groden C, Brockmann MA. Comparison of digital subtraction angiography, micro-computed tomography angiography and magnetic resonance angiography in the assessment of the cerebrovascular system in live mice. Clin Neuroradiol. 2012;22:21–8. doi: 10.1007/s00062-011-0113-2. [DOI] [PubMed] [Google Scholar]
- Folkman J. Angiogenesis. Annu Rev Med. 2006;57:1–18. doi: 10.1146/annurev.med.57.121304.131306. [DOI] [PubMed] [Google Scholar]
- Fox SB, Leek RD, Weekes MP, Whitehouse RM, Gatter KC, Harris AL. Quantitation and prognostic value of breast cancer angiogenesis: comparison of microvessel density, Chalkley count, and computer image analysis. J Pathol. 1995;177:275–83. doi: 10.1002/path.1711770310. [DOI] [PubMed] [Google Scholar]
- Gessner R, Lukacs M, Lee M, Cherin E, Foster FS, Dayton PA. High-resolution, high-contrast ultrasound imaging using a prototype dual-frequency transducer: in vitro and in vivo studies. IEEE transactions on ultrasonics, ferroelectrics, and frequency control. 2010;57:1772–81. doi: 10.1109/TUFFC.2010.1615. [DOI] [PMC free article] [PubMed] [Google Scholar]
- Gessner RC, Aylward SR, Dayton PA. Mapping microvasculature with acoustic angiography yields quantifiable differences between healthy and tumor-bearing tissue volumes in a rodent model. Radiology. 2012;264:733–40. doi: 10.1148/radiol.12112000. [DOI] [PMC free article] [PubMed] [Google Scholar]
- Gessner RC, Frederick CB, Foster FS, Dayton PA. Acoustic angiography: a new imaging modality for assessing microvasculature architecture. International journal of biomedical imaging. 2013;2013:936593. doi: 10.1155/2013/936593. [DOI] [PMC free article] [PubMed] [Google Scholar]
- Gibbons GH, Dzau VJ. The emerging concept of vascular remodeling. N Engl J Med. 1994;330:1431–8. doi: 10.1056/NEJM199405193302008. [DOI] [PubMed] [Google Scholar]
- Guiroy A, Novell A, Ringgaard E, Lou-Moeller R, Gregoire JM, Abellard AP, Zawada T, Bouakaz A, Levassort F. Dual-frequency transducer for nonlinear contrast agent imaging. IEEE transactions on ultrasonics, ferroelectrics, and frequency control. 2013;60:2634–44. doi: 10.1109/TUFFC.2013.2862. [DOI] [PubMed] [Google Scholar]
- Halpern EJ. Contrast-enhanced ultrasound imaging of prostate cancer. Rev Urol. 2006;8(Suppl 1):S29–37. [PMC free article] [PubMed] [Google Scholar]
- Hanahan D, Weinberg RA. Hallmarks of cancer: the next generation. Cell. 2011;144:646–74. doi: 10.1016/j.cell.2011.02.013. [DOI] [PubMed] [Google Scholar]
- Harris FJ. On the Use of Windows for Harmonic Analysis with the Discrete Fourier Transform. Proceedings of the IEEE. 1977;66:51–83. [Google Scholar]
- Harvey CJ, Blomley MJ, Eckersley RJ, Heckemann RA, Butler-Barnes J, Cosgrove DO. Pulse-inversion mode imaging of liver specific microbubbles: improved detection of subcentimetre metastases. Lancet. 2000;355:807–8. doi: 10.1016/S0140-6736(99)04545-6. [DOI] [PubMed] [Google Scholar]
- Hunt JW, Arditi M, Foster FS. Ultrasound transducers for pulse-echo medical imaging. IEEE Trans Biomed Eng. 1983;30:453–81. doi: 10.1109/tbme.1983.325150. [DOI] [PubMed] [Google Scholar]
- Kasai C. Real-Time Two-Dimensional Blood-Flow Imaging Using an Autocorrelation Technique. Ieee T Ultrason Ferr. 1986;33:94. [Google Scholar]
- Kruse DE, Ferrara KW. A new imaging strategy using wideband transient response of ultrasound contrast agents. Ieee T Ultrason Ferr. 2005;52:1320–9. doi: 10.1109/tuffc.2005.1509790. [DOI] [PMC free article] [PubMed] [Google Scholar]
- Ku G, Wang X, Xie X, Stoica G, Wang LV. Imaging of tumor angiogenesis in rat brains in vivo by photoacoustic tomography. Appl Opt. 2005;44:770–5. doi: 10.1364/ao.44.000770. [DOI] [PubMed] [Google Scholar]
- Laufer J, Johnson P, Zhang E, Treeby B, Cox B, Pedley B, Beard P. In vivo preclinical photoacoustic imaging of tumor vasculature development and therapy. J Biomed Opt. 2012;17:056016. doi: 10.1117/1.JBO.17.5.056016. [DOI] [PubMed] [Google Scholar]
- Leavens C, Williams R, Foster FS, Burns PN, Sherar MD. Golay pulse encoding for microbubble contrast imaging in ultrasound. IEEE transactions on ultrasonics, ferroelectrics, and frequency control. 2007;54:2082–90. doi: 10.1109/tuffc.2007.503. [DOI] [PubMed] [Google Scholar]
- Lindsey BD, Rojas JD, Dayton PA. On the relationship between microbubble fragmentation, deflation, and broadband superharmonic signal production. Ultrasound Med Biol. 2015 doi: 10.1016/j.ultrasmedbio.2014.12.668. accepted for publication. [DOI] [PMC free article] [PubMed] [Google Scholar]
- Lindsey BD, Rojas JD, Martin KH, Shelton SE, Dayton PA. Acoustic Characterization of Contrast-to-tissue Ratio and Axial Resolution for Dual-Frequency Contrast-Specific “Acoustic Angiography” Imaging. IEEE transactions on ultrasonics, ferroelectrics, and frequency control. 2014;61:1668–85. doi: 10.1109/TUFFC.2014.006466. [DOI] [PMC free article] [PubMed] [Google Scholar]
- Loupas T, Powers JT, Gill RW. An Axial Velocity Estimator for Ultrasound Blood-Flow Imaging, Based on a Full Evaluation of the Doppler Equation by Means of a 2-Dimensional Autocorrelation Approach. Ieee T Ultrason Ferr. 1995;42:672–88. [Google Scholar]
- Morgan KE, Allen JS, Dayton PA, Chomas JE, Klibanov AL, Ferrara KW. Experimental and theoretical evaluation of microbubble behavior: Effect of transmitted phase and bubble size. Ieee T Ultrason Ferr. 2000;47:1494–509. doi: 10.1109/58.883539. [DOI] [PubMed] [Google Scholar]
- Porter TM, Smith DA, Holland CK. Acoustic techniques for assessing the Optison destruction threshold. Journal of ultrasound in medicine: official journal of the American Institute of Ultrasound in Medicine. 2006;25:1519–29. doi: 10.7863/jum.2006.25.12.1519. [DOI] [PMC free article] [PubMed] [Google Scholar]
- Reddy AJ, Szeri AJ. Optimal pulse-inversion imaging for microsphere contrast agents. Ultrasound in medicine & biology. 2002;28:483–94. doi: 10.1016/s0301-5629(02)00494-5. [DOI] [PubMed] [Google Scholar]
- Ritter TA, Shrout TR, Tutwiler R, Shung KK. A 30-MHz piezo-composite ultrasound array for medical imaging applications. Ieee T Ultrason Ferr. 2002;49:217–30. doi: 10.1109/58.985706. [DOI] [PubMed] [Google Scholar]
- Rubin JM, Bude RO, Carson PL, Bree RL, Adler RS. Power Doppler US: a potentially useful alternative to mean frequency-based color Doppler US. Radiology. 1994;190:853–6. doi: 10.1148/radiology.190.3.8115639. [DOI] [PubMed] [Google Scholar]
- Sam AD, 2nd, Morasch MD, Collins J, Song G, Chen R, Pereles FS. Safety of gadolinium contrast angiography in patients with chronic renal insufficiency. J Vasc Surg. 2003;38:313–8. doi: 10.1016/s0741-5214(03)00315-x. [DOI] [PubMed] [Google Scholar]
- Sever AR, Mills P, Jones SE, Cox K, Weeks J, Fish D, Jones PA. Preoperative Sentinel Node Identification With Ultrasound Using Microbubbles in Patients With Breast Cancer. American Journal of Roentgenology. 2011;196:251–6. doi: 10.2214/AJR.10.4865. [DOI] [PubMed] [Google Scholar]
- Shellock FG, Kanal E. Safety of magnetic resonance imaging contrast agents. J Magn Reson Imaging. 1999;10:477–84. doi: 10.1002/(sici)1522-2586(199909)10:3<477::aid-jmri33>3.0.co;2-e. [DOI] [PubMed] [Google Scholar]
- Shelton SE, Lee YZ, Foster FS, Lee M, Cherin E, Aylward SR, Dayton PA. Quantification of microvascular tortuosity during tumor evolution utilizing acoustic angiography. Ultrasound Med Biol. 2015 doi: 10.1016/j.ultrasmedbio.2015.02.012. In Review. [DOI] [PMC free article] [PubMed] [Google Scholar]
- Simpson DH, Chin CT, Burns PN. Pulse inversion Doppler: a new method for detecting nonlinear echoes from microbubble contrast agents. IEEE transactions on ultrasonics, ferroelectrics, and frequency control. 1999;46:372–82. doi: 10.1109/58.753026. [DOI] [PubMed] [Google Scholar]
- Streeter JE, Gessner R, Miles I, Dayton PA. Improving sensitivity in ultrasound molecular imaging by tailoring contrast agent size distribution: in vivo studies. Molecular imaging. 2010;9:87–95. [PMC free article] [PubMed] [Google Scholar]
- Sun Y, Kruse DE, Ferrara KW. Contrast imaging with chirped excitation. IEEE transactions on ultrasonics, ferroelectrics, and frequency control. 2007;54:520–9. doi: 10.1109/tuffc.2007.275. [DOI] [PubMed] [Google Scholar]
- Takahashi Y, Kitadai Y, Bucana CD, Cleary KR, Ellis LM. Expression of vascular endothelial growth factor and its receptor, KDR, correlates with vascularity, metastasis, and proliferation of human colon cancer. Cancer Res. 1995;55:3964–8. [PubMed] [Google Scholar]
- Tang MX, Eckersley RJ. Nonlinear propagation of ultrasound through microbubble contrast agents and implications for Imaging. Ieee T Ultrason Ferr. 2006;53:2406–15. doi: 10.1109/tuffc.2006.189. [DOI] [PubMed] [Google Scholar]
- Yeh CK, Su SY. Effects of acoustic insonation parameters on ultrasound contrast agent destruction. Ultrasound Med Biol. 2008;34:1281–91. doi: 10.1016/j.ultrasmedbio.2007.12.020. [DOI] [PubMed] [Google Scholar]
- Zwick S, Strecker R, Kiselev V, Gall P, Huppert J, Palmowski M, Lederle W, Woenne EC, Hengerer A, Taupitz M, Semmler W, Kiessling F. Assessment of Vascular Remodeling Under Antiangiogenic Therapy Using DCE-MRI and Vessel Size Imaging. Journal of Magnetic Resonance Imaging. 2009;29:1125–33. doi: 10.1002/jmri.21710. [DOI] [PubMed] [Google Scholar]


