Abstract
An experimental study of the pressure distributions in an asymmetric larynx, hereafter referred to as a hemilarynx, was carried out at a glottal diameter of 0.04 cm and transglottal pressures of 3, 5, 10, 20, and 40 cm H2O. In each case, the glottal wall “on the left” was chosen to have an angle of zero degrees with the midline, and the angle of the glottal wall “on the right” was varied through converging angles of 5, 10, and 20° and diverging angles of 5, 10, and 20°. The case of two parallel glottal walls, or the uniform glottis, was also examined. With the exception of the 20° convergent case, the pressure distributions for most angles and pressures were bistable; that is, a stable flow situation persisted when the glottal exit flow jet was directed downstream either to the right or to the left in the rectangular “pharynx” tunnel. Bistability also occurred for the uniform glottis. Pressure differences arising from the different directions of the flow jet were often found to be small; however, differences for the diverging 10° case were as large as 7 or 8%, and for the 20° divergent case, 12%. Calculations with FLUENT, a computational package, gave excellent agreement with observed pressures. Implications of the pressure distribution data for the functional similarity of normal and hemilaryngeal phonation, hypothesized by Jiang and Titze, is discussed. In particular, the intraglottal pressures for converging and diverging angles for the hemilarynx were found to be quite similar to those of the full larynx with the same diameter and included angle or twice the diameter and twice the included angle, suggesting that the same mechanism of energy transfer operates in the two cases. Nondimensionalizing the pressure distributions with the transglottal pressures suggests that the shapes of the distributions at P = 3, 5, 10, 20, and 40 cm H2O for a given geometry are similar. The pressure average of these dimensionless distributions may be interpreted as a template at that geometry, a description referred to as successful pressure scaling. When the entire data set is considered, variations from consistent pressure scaling averaged 1.4%, although these variations tend to be somewhat larger near the glottal entrance and for diverging angles of 10 and 20°. Some possible implications of the observed pressures for phonosurgery are discussed.
I. INTRODUCTION
Jiang and Titze1 developed a methodology to study the phonatory properties of canine hemilarynges. By doing so, they could examine the relationship of the oscillations of a single vocal fold against an opposing fixed structure to oscillations during normal phonation. Motivation for their study was twofold: a need to provide useful information for surgeons2,3 faced with the prospect of immobilizing a dysfunctional vocal fold, and a desire to explore the usefulness of hemilaryngeal phonation to obtain information about the function of the vocal folds not readily available from the study of normal phonation. For example, removal of one of the vocal folds allows better observation of the trajectory of the remaining vocal fold. Further, obtaining measurements of the impact stresses of a single vocal fold oscillating against a Plexiglas plate equipped with appropriate transducers4 affords an opportunity to better understand vocal fold collisions, their role in normal phonation, and their potential as a cause of vocal fold nodules5,6.
Concern arises as to the degree of similarity between the oscillation of a single vocal fold against a fixed structure and the symmetric oscillations of a normal pair of vocal folds. Considering the fact that some hemilaryngectomized patients achieve relatively normal phonation and the results of their experiments with nine excised canine larynges, Jiang and Titze1 hypothesized a functional similarity of hemilaryngeal and laryngeal (normal) phonation. Support for this hypothesis was found in the shape of the lateral excursions of the mobile vocal fold as well as the phase difference observed between the top and bottom edges of the medial surface of this vocal fold, and they surmised that a mucosal wave traveled from the bottom edge of the medial surface to the top edge in hemilaryngeal phonation, just as in laryngeal phonation. In addition, Jiang and Titze1 observed that the dependence of the fundamental frequencies and the amplitudes of vibration on subglottal pressure were similar for hemilaryngeal and laryngeal phonation. The phonation pressure thresholds and the ranges of subglottal pressures over which the larynges phonated were also similar, but the pressure at which hemilaryngeal phonation became unstable was found to be about 20% higher than the pressure at which full-laryngeal phonation became unstable. Moreover, the airflows for the hemilaryngeal case were about a factor of two smaller than for the laryngeal case, and the sound pressure levels differed by a factor of about four. Another potential test of the similarity between hemilaryngeal and laryngeal phonation might be carried out by comparing the impact stresses during collisions of the vocal folds7 with those of a single vocal fold colliding with a Plexiglas plate4.
Alipour, Scherer, and Finnegan8 examined the mean pressure-flow relationships as a function of adduction for five excised canine larynges. They found these relationships to be linear with a slight increase in flow resistance at larger flows under conditions of normal phonation. As one would expect, the flow at a given transglottal pressure decreased as the level of adduction increased. These trends also pertained in a study of hemilarynx phonation by Alipour and Scherer9, in accord with the hypothesis of functional similarity. This latter study also examined the pressure distributions at several points of a two-dimensional array on the Plexiglas plate used as the opposing vertical structure of the hemilarynx and found complex pressure variations, including a “dynamic bidirectional pressure gradient” along the anterior-posterior surface of the plate. Although it would certainly be a challenging experiment, measurements of the dynamic pressures at corresponding points during phonation of the full larynx could provide an interesting test of functional similarity, if a similar bidirectional gradient were shown to be present.
In a series of papers based on the static Plexiglas model M5 of the glottis, Scherer et al.10,11 and Shinwari et al.12 began a detailed study of the flows and pressure distributions of the oblique glottis (where the center axis of the glottis is not parallel to the midsagittal plane) and comparisons of these properties with their counterparts for the symmetric glottis. Generally, they found the differences between the pressures across the glottis (on the vocal fold surfaces) to be considerably larger for the oblique cases (up to 27% for an included divergent angle of 10° and up to 21% for the uniform case) than for the symmetric case. The pressures on the convergent wall were always higher than those on the opposing wall near the glottal entrance, as one would expect because the flow impinges more directly on this wall. Alipour and Scherer13 examined the pressure distributions and velocity profiles in a hard plastic hemilarynx model with a long straight wall. They observed that the glottal exit flow proceeded mostly as a jet along the extended straight wall and that the pressures along this wall tended to be lower than those along the other side. They found the location of the peak velocity of the jet occurred in the same relative location for all pressures and diameters observed. They also found that the most turbulent part of the flow occurred in more or less the same relative location for all the observed pressures and diameters.
Scherer et al.10,11 also reported an interesting symmetry-breaking property of the flow pattern for the symmetric glottis. The flow jet did not detach from the glottal walls at the same point on both sides. On one side, it remained closer to the wall, and they spoke of this side as the flow wall (FW) and the other side as the non-flow wall (NFW)14,15. In most cases, the pattern of flow was bistable, since it could be coaxed from one side to the other with a paper guide10, where it would remain. One would expect this asymmetric flow pattern to carry a pressure signature, because the side with the faster particle velocities should require more kinetic energy from the pressure field. Indeed, the observed pressures tended to be lower on all or portions of the FW than on the NFW, with the largest difference being about 5% of the transglottal pressure. Cross-glottal pressure differences were observed for transglottal pressures of 5, 10, and 15 cm of H2O. No difference was observed for the 3 cm case. Shinwari et al.12 replicated these pressure distributions in a different Plexiglas model, which included an upstream stagnation tank. By seeding the airflow with small wetted glass spheres, these researchers succeeded in visualizing the stream of air through the glottis and verified that the flow through the symmetric glottis tended to cling to one side and emerge from the glottis at an angle to the midline for each of the transglottal pressures used in the experiments of Scherer et al.10,11. Further, Shinwari et al.12 determined that for a diverging angle of 10° the separation point of the flow jet was near the glottal entrance on the NFW, but near the glottal exit on the FW.
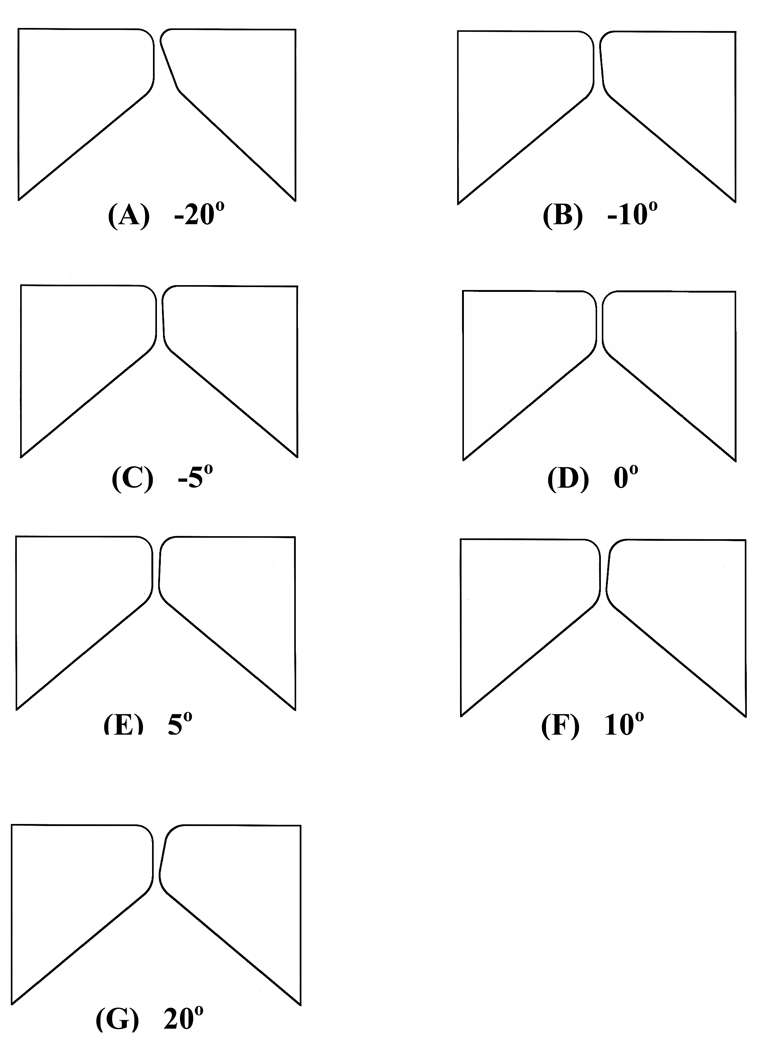
In an attempt to further clarify the relationship of the flow and pressure patterns for oblique glottal geometries to those of symmetrical cases, Thapa16 carried out a systematic examination of the pressure distributions along the medial surfaces of model hemilarynges formed by the seven combinations of plastic inserts shown in Fig. 1. Each of these inserts had been used previously with the Plexiglas model M5 wind tunnel either as part of a symmetric pair or in a combination to give an oblique glottis10,11. The combinations presented in Fig. 1 allow one to form three converging angles (5, 10, 20°) between the glottal surfaces, three diverging angles (5, 10, 20°), and the uniform, or rectangular, case. The separations of the inserts were adjusted so that the minimal glottal diameter was always 0.0400 +/− 0.0002 cm. The hemilarynx always included one straight wall called the vertical wall (VW) because of its orientation in a hemilaryngectomized patient. For six of the geometries of Fig. 1, the opposing wall is called the slanted wall (SW). The uniform geometry of Fig. 1(D) contains two vertical walls. For all of the geometries of Fig. 1, both of the inferior vocal fold surfaces were convergent shapes. Thus Thapa’s model of the hemilarynx did not include the long straight wall of Alipour and Scherer’s model13, and comparison of the pressure distributions collected with the uniform case of Fig. 1(D) with those of the long straight wall model will give some insight into the consequences of extending the vertical side opposite the healthy vocal fold in a surgical intervention.
FIG. 1.
Converging [(A), (B), and (C)], zero (D), and diverging [(E), (F), and (G)] included glottal angles defined by pairs of Plexiglas vocal fold inserts used to construct the hemilarynx in the wind tunnel of Model M5. Diverging angles are positive and the converging angles are negative.
Pressure data collected using the geometries of Fig. 1 may provide information about the medial forces acting on the oscillating vocal fold during the canine hemilaryngeal studies discussed above. Below, a comparison of the angle dependence of Thapa’s hemilaryngeal pressure distributions with that of their counterparts for a symmetric glottis with diameters of 0.04 and 0.08 cm supports the expectation that the driving forces for laryngeal and hemilaryngeal phonation behave in a similar manner. In particular, the intraglottal pressures for converging angles tend to be above the pressure of the supraglottal region, and the intraglottal pressures for diverging angles tend to be below the pressure of the supraglottal region. Since it is now well-established that converging shapes occur during glottal opening and diverging shapes occur during glottal closing for normal phonation (e.g., reference 17), the intraglottal pressures exert forces on the vocal folds in the direction of motion during both the opening and the closing parts of the cycle. This synchronous combination of driving forces and motion transfers energy from the glottal airflow to the motion of the vocal folds18,19. Since Jiang and Titze1 inferred a mucosal wave from their canine hemilaryngeal experiments with properties similar to that of the mucosal wave in laryngeal phonation, it is logical to assume a sequence of converging and diverging shapes for hemilaryngeal phonation in phase with the alternating intraglottal pressures. Such a scenario would establish that the mechanism of energy transfer in hemilaryngeal phonation is the same as that of normal phonation. This additional information provides important support for the hypothesis of functional similarity between hemilaryngeal and normal phonation.
Thapa reproduced the intraglottal pressure distributions for the uniform case and verified that the flow jet exhibited the bistable behavior observed by Scherer et al.10,11 when exiting the glottis. He also verified for the uniform case that the pressures on the FW tended to be lower than those on the NFW by a few percent of the transglottal pressure, especially near the glottal exit. The bistable behavior was also present for all of the divergent cases and for the 5 and 10° convergent cases. However, for the 20° convergent case, Thapa found that the flow always preferred the straight wall, a behavior similar to that found by Alipour and Scherer13 for their long straight wall.
In order to understand better the connections between the fluid flows and pressures within the hemilarynx and Thapa’s measurements at the glottal surfaces, Bo20 undertook a series of numerical calculations based on the commercial computational code FLUENT. This code was chosen to consider the laminar flow of a Newtonian fluid governed by the Navier-Stokes equation. It has sufficient generality to generate numerically accurate solutions for the seven geometries shown in Fig. 1, by making the appropriate adjustments of the mesh size. It allows one to implement boundary conditions that produce the asymmetric bistable flows observed by Thapa16 and by Scherer et al.10,11. However, reproducing the bistable behavior with FLUENT requires an adjustment of the boundary conditions to capture the asymmetries in the downstream pressures that result from an asymmetric flow jet. Bo’s calculations were based on a uniform pressure boundary condition across the downstream exit of the wind tunnel. For the symmetric geometry of Fig. 1(D) this choice yields a jet along the midline of the glottis. For most of the other geometries, the asymmetry of the walls tends to produce a preference of the jet for the straight wall, which would then be the FW in these cases. Comparison of Bo’s FLUENT calculations with Thapa’s data will be presented below. In most cases agreement of the calculated and observed pressure distributions is very good, and the comprehensive agreement between calculated and observed pressure distributions increases one’s confidence in the validity of the measurements and allows a better picture of potential phonatory effects.
II. THE HEMILARYNX SETUP
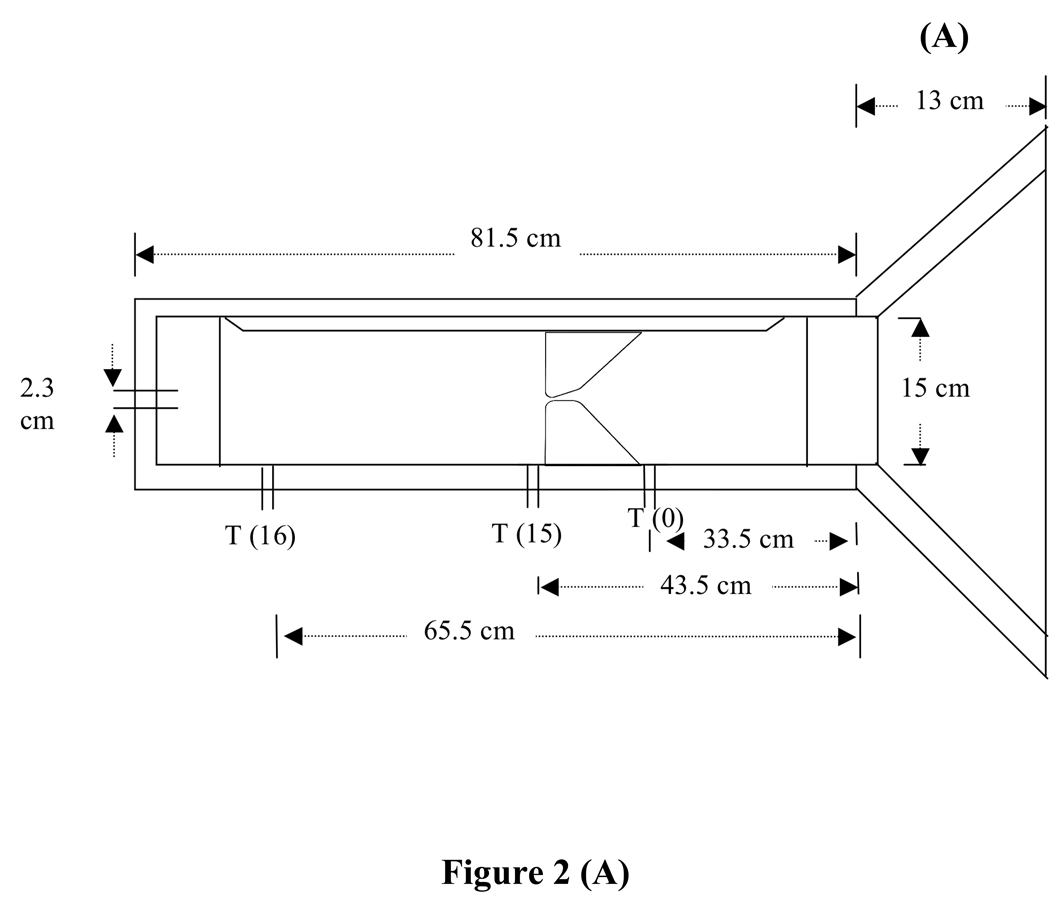
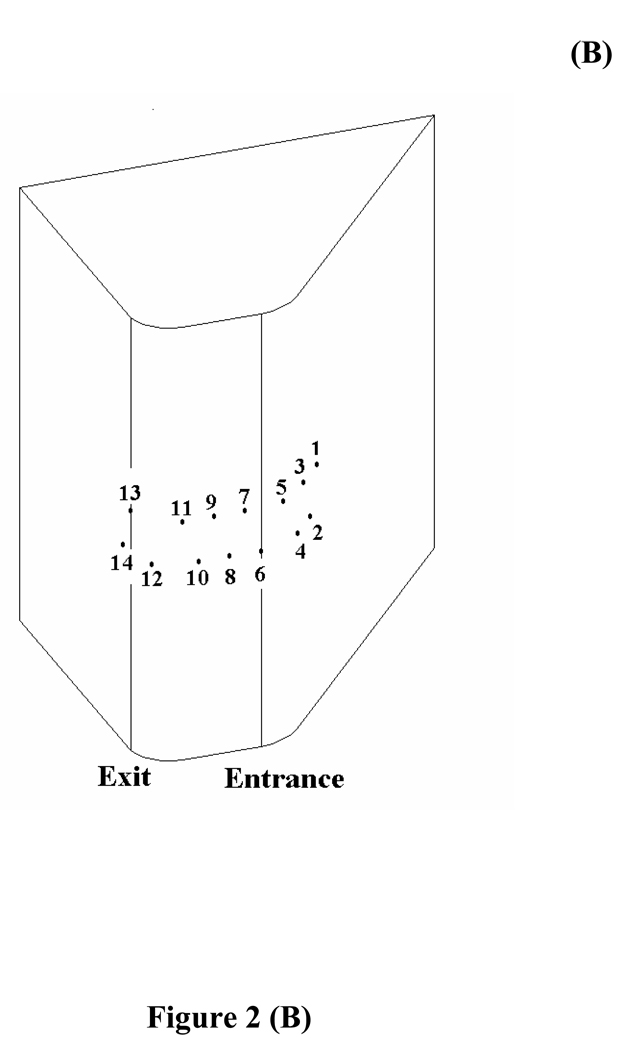
The wind tunnel for the hemilarynx experiments is shown in Fig. 2(A). The airflow enters from the right and flows through the subglottal region before entering the location where the plastic inserts narrow the channel. As the channel narrows, the air accelerates to conserve the volume rate of flow, thereby producing a reduced pressure in the space between the plastic inserts. The wind tunnel of Fig. 2(A) is the same as that used in earlier model M5 experiments (where greater detail may be found)10–11. As illustrated in Fig. 2(B), one of the plastic inserts in the wind tunnel is equipped with 14 pressure taps staggered about the midline of the glottis. Tap 6 is located at the glottal entrance, and tap 13 is located at the glottal exit on the superior surface of the vocal fold. Thus, taps 6 to 13 record the intraglottal pressures, and the first 5 taps, located along the inferior vocal fold surface, record the subglottal pressures. The distance from the glottal entrance to the glottal exit in the model is 2.25 cm. Since model M5 was constructed with a scaled enhancement of 7.5, this distance corresponds to a glottal thickness of 0.3 cm. Tap 14 is located on the superior surface of the vocal fold lateral to tap 13 by 0.375 cm (0.05 cm real life). Tap 15 is located in the lateral wall of the wind tunnel [Fig. 2(A)] just above the superior surface of the vocal fold by 0.6 cm (0.08 cm real life). Tap 16 is located in the same wall and lies about 22 cm (2.93 cm real life) farther downstream. The dimension perpendicular to the plane of Fig. 2(A) is 9.0 cm (not shown), which corresponds to a glottal length of 1.2 cm. The upstream pressure is determined by tap 0 located next to the beginning of the convergent subglottal region. When the measurements were taken, the transglottal pressure was determined as the pressure drop between taps 0 and 16. Pressure drops within the model were smaller than in real life by a factor of 1/(7.5*7.5) due to the size difference, and thus were scaled up to equal real life values10–11. False vocal folds were not used in this experiment.
FIG. 2.
(A) Schematic diagram of the wind tunnel used for the hemilarynx experiments. The glottal diameter is the minimum separation between the vocal fold inserts. Because of the converging glottal angle between the medial surfaces shown in the schematic, the minimum separation is near the glottal exit. (B) Locations of the 14 pressure taps on one of the vocal fold inserts. (from Fig. 5 of Ref. 10)
In this experiment the empirical FW side was determined by examining the direction in which human hairs, taped in a right-left line across the top of the flow tunnel, fluttered. If the jet was predominantly to the left, hairs on the left flapped in the wind, but did not do so on the right side, and vice versa. The line of hairs was placed just downstream of tap 15.
III. THE UNIFORM GLOTTIS
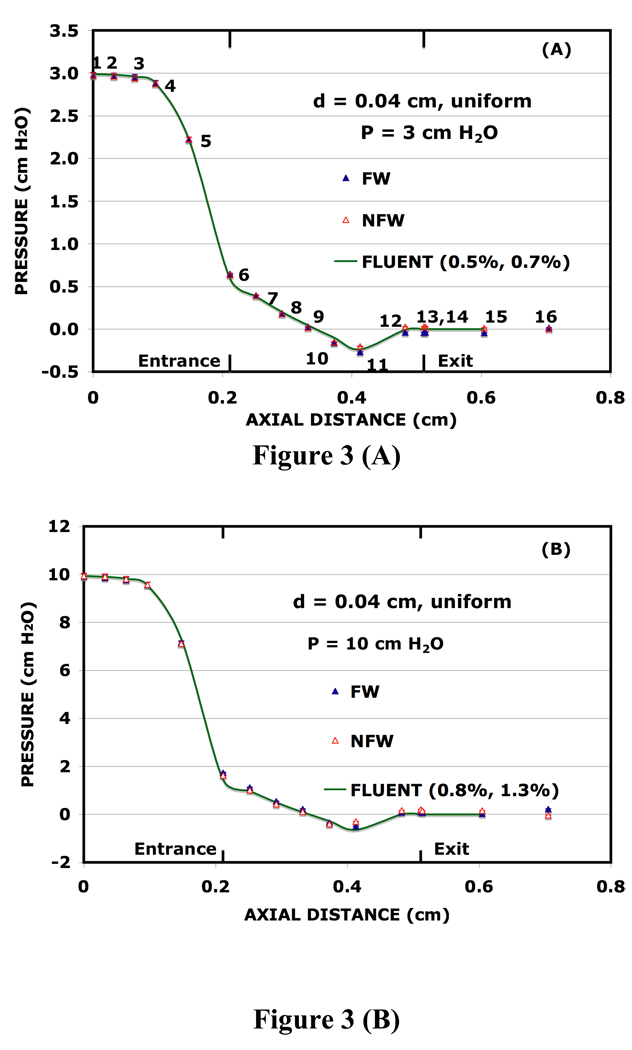
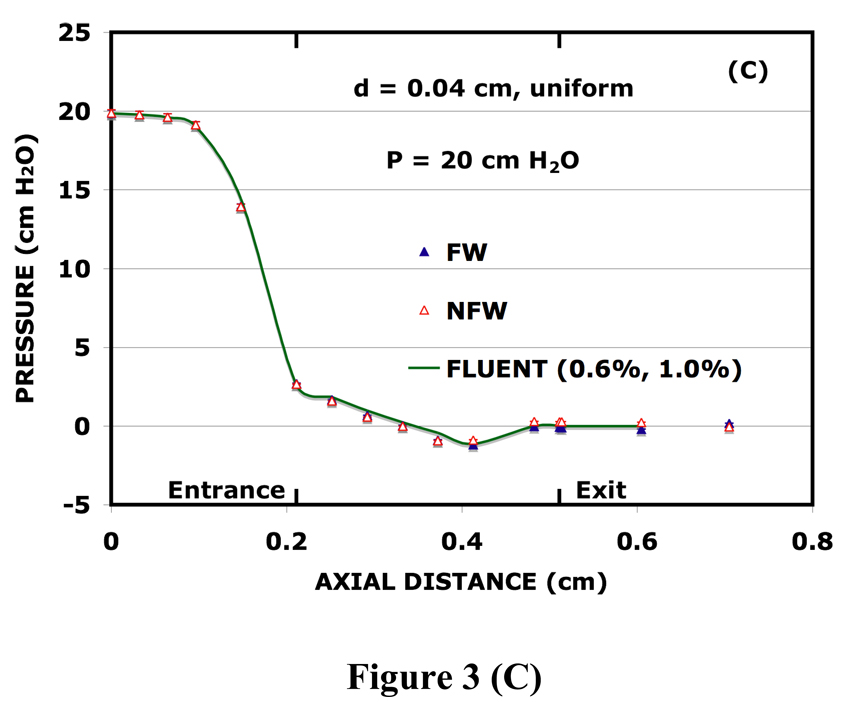
The first experiment was carried out with the uniform glottis of Fig. 1(D). Although pressure taps were only on one side of the model, empirical pressures on “both” sides could readily be obtained with the following procedure. The flow jet was directed to the side opposite to that with the pressure taps, and therefore these air pressures were measured and recorded for the NFW. Then the flow jet was switched to the other side (using a paper wedge that was momentarily inserted from the upstream side by hand and slowly withdrawn). The pressure measurements for this pattern, with the same transglottal pressure, were recorded as those for the FW. Both the FW and NFW results for the intraglottal pressure distributions and the pressures for the adjoining sub- and supraglottal regions are shown in Fig. 3 for the transglottal pressures of 3, 10, and 20 cm H2O. The intraglottal pressure distributions obtained with the 5 and 40 cm H2O transglottal pressures (not shown) have very similar shapes.
FIG. 3.
Pressure distributions along the opposing walls of the uniform glottis (included angle 0°) for transglottal pressures of 3 (A), 10 (B), and 20 (C) cm H2O. The glottal entrance is located at an axial distance of 0.211 cm (tap 6) and glottal exit at 0.511 cm (near tap 13). The last pressure tap (16) is farther removed from tap 15 than the distance shown in the graphs. The data are presented as unconnected triangles, and each triangular datum contains a small 1% error bar, which is barely visible in most cases. The 1% is an upper limit for the experimental uncertainty. The curves give the results of the FLUENT calculations.
Measurement uncertainty and cross-glottis pressure differences
In accord with the earlier procedures10, each pressure measurement16 was repeated 4 times, and thus each pressure value reported in this paper is the average of 4 measurements. The repeated measurements also allowed an estimate of the experimental uncertainty in the pressure data. For each angle and each transglottal pressure, one may calculate the standard deviation of the 4 voltage outputs for each of the 16 pressure taps. Dividing the standard deviation at each tap by the average voltage there allows one to calculate a percentage uncertainty21. Averaging these uncertainties over the pressure taps most important for determining the forces on the vocal folds, taps 5 to 14, gives an average percentage uncertainty for each of the pressure distributions. The average uncertainty computed in this way was less than 1% for all the pressure distributions reported in this section. For example, the average uncertainties for the 3 pressure distributions presented in Fig. 3 are 0.09% in (A), 0.04% in (B), 0.28% in (C).
In most cases the pressure differences on the opposing walls at the first 8 or 9 taps are smaller than or comparable to the 1% uncertainty estimate discussed above. For the transglottal pressures of Fig. 3, the largest differences between the FW and the NFW pressures at any cross-channel location [2.2% in (A), 2.0% in (B), and 2.5% in (C), where the percentages are all determined relative to the transglottal pressure] occurred near the glottal exit and are several times larger than the uncertainty estimates made above22. Hence, the pressure differences on the two sides of the glottis should be considered as a consequence of the location of the flow jet. From these observed differences, one may conclude that the pressures on the FW near the glottal exit were about 2% lower than their counterparts on the NFW, with the possible exception of the 40 cm H2O case23.
Because of the bistable flow pattern, the flow jet may not always form on a given side during phonation24, but it would form on either side with a certain probability, which might be estimated from velocimetry experiments, such as those recently done by Khosla et al.25 with canine larynges. The appearance of the flow jet on different sides during different glottal cycles would mean that small cross-glottal pressure differences would fluctuate and hence lead to small differences in the lateral forces that act on the opposing vocal folds during phonation.
Pressure distributions and the potential for surface waves
In each part of Fig. 3, the pressure distribution drops quickly as the air accelerates to enter the narrow glottal region. Inside the glottis the pressures fall off in an approximately linear fashion with axial distance, as one would expect from the viscous losses in a relatively narrow rectangular channel. The pressure reaches a minimum before recovering to accommodate the curved expansion geometry of the glottal exit. Thus, the data of Fig. 3 show that the leading edges of the vocal folds for the uniform glottis are subject to pressures on average higher than those of the supraglottal region. On the other hand, the downstream edges of the vocal folds are subject to pressures lower than those of the supraglottal region. If the supraglottal region were at atmospheric pressure, this pressure gradient would push the leading edge of the glottis away from midline and would pull the trailing edge of the glottis toward midline, the kind of force gradient that would tend to tilt the vocal folds and set up “mucosal waves” on their medial surfaces. In the next section it will be shown that the behavior of the intraglottal pressures for converging angles reinforce this tendency, and thus promote the development of surface waves. As Titze19,26,27 has emphasized, surface waves are an important element in producing the converging and diverging glottal shapes necessary to transfer energy from the glottal airflow to the motion of the vocal folds.
FLUENT-generated pressures and velocities
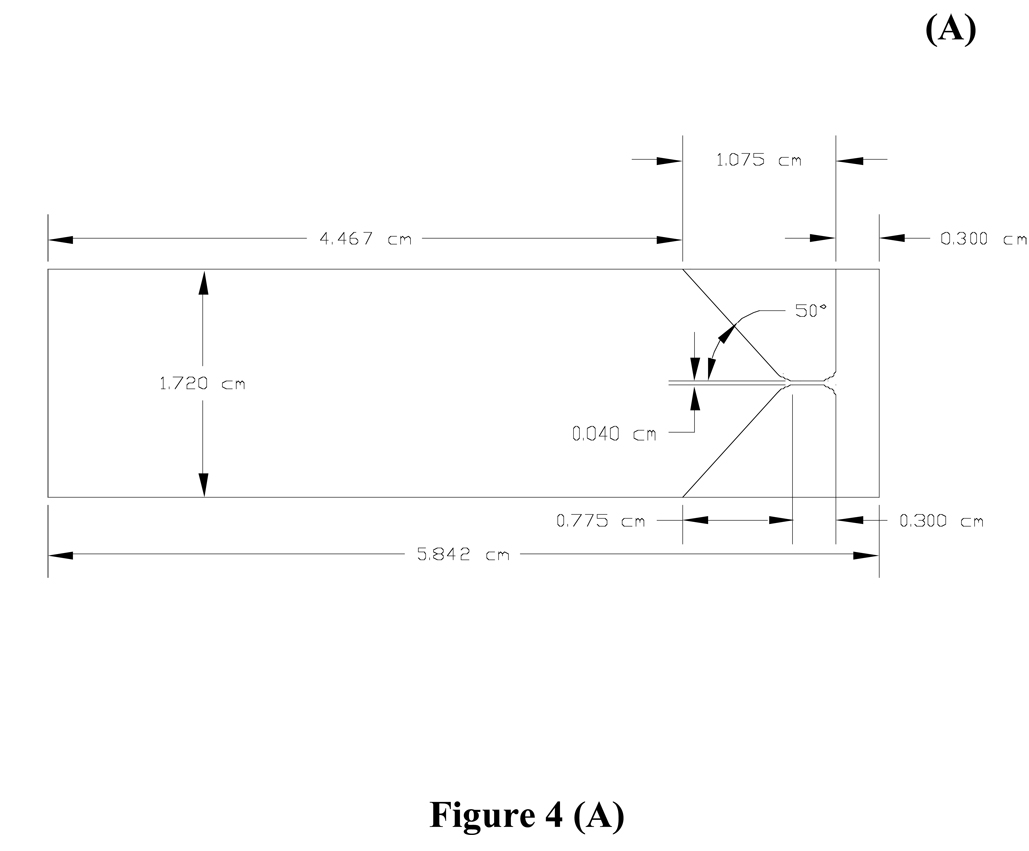
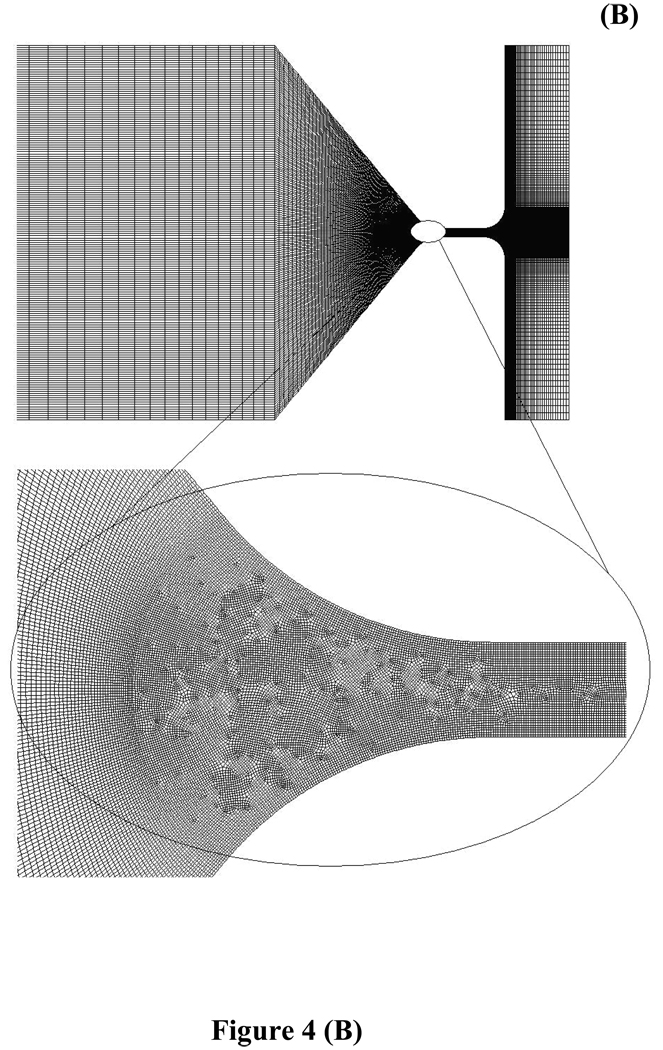
Using the two-dimensional geometry of Fig. 4(A) and the FLUENT computer code for laminar flow, Bo20 calculated the pressure distributions shown by the full curves29 of Fig. 3. These calculations were based on a 79.6 K computational grid generated by Gambit, with both structured and unstructured meshes, as shown in Fig 4(B). Each of the FLUENT calculations was run in double precision mode, and the convergence criteria were set at normalized residuals of 10−4 for the continuity equation and 10−3 for the momentum equations. The runs typically required about 10 hours on a single-processor Intel 2.40 GHz machine.
FIG. 4.
(A) The glottal geometry used for the FLUENT calculation of the properties of the uniform glottis, and (B) the grid used for this case.
The pressure distributions calculated with FLUENT have the same qualitative features as the data, which include the rapid decrease near the glottal entrance, the nearly uniform decrease within the glottis, and the recovery at the curved exit of the glottis. Inspection of Fig. 3 suggests that the quantitative agreement of the FLUENT calculations with the data is also very good.
To examine the accuracy of the calculations further, two measures of the agreement of the FLUENT calculations with the average of the FW and NFW measurements were calculated. The first of these is a measure of how well FLUENT reproduces the rapid pressure decreases near the glottal entrance. The subglottal error index ESUB is defined as the absolute value of the difference between the FLUENT pressure Pi(FL) and the average of the FW and the NFW pressures, denoted as Pi(FW) and Pi(NFW), respectively, at each tap averaged over the first 6 taps divided by the transglottal pressure, namely,
| (1) |
The angle argument has been included as a reminder that ESUB will depend on the angle, pressure, and diameter in the general case. For converging and diverging angles, ESUB will also depend upon the side preferred by the flow jet. The quantity ESUB measures the difference of the combined action of the FLUENT pressures on the subglottal surface from that of the average of the FW and the NFW pressures on this surface. It is the first of the percentages included with the FLUENT curves of Fig. 3. The average of this index over the 3 cases considered there is 0.6%, an excellent match.
Similarly, the intraglottal error index is defined as
| (2) |
where the sum is taken over the intraglottal pressure taps 6 through 13. It measures the difference of the combined action of all the FLUENT intraglottal pressures within the glottis from that of the FW and the NFW pressures. It is the second of the percentages included with the FLUENT curves of Fig. 3. The average over the 3 cases is 1.0%, also indicating good agreement.
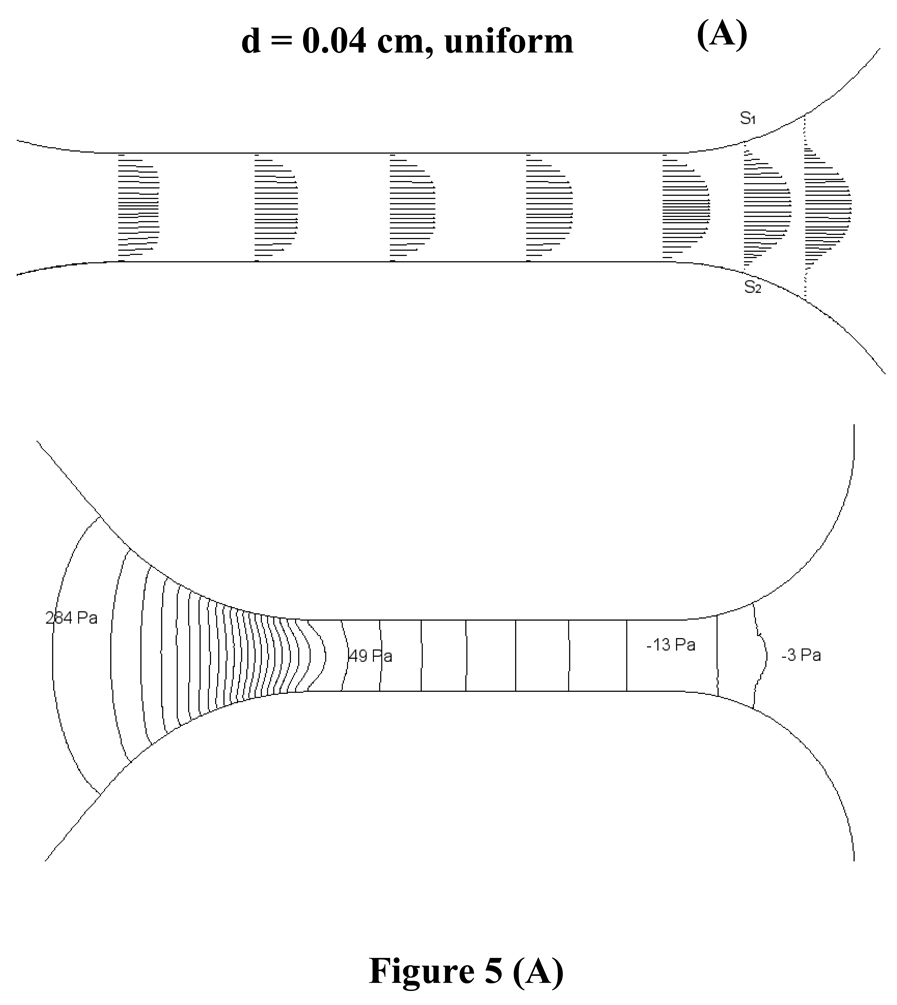
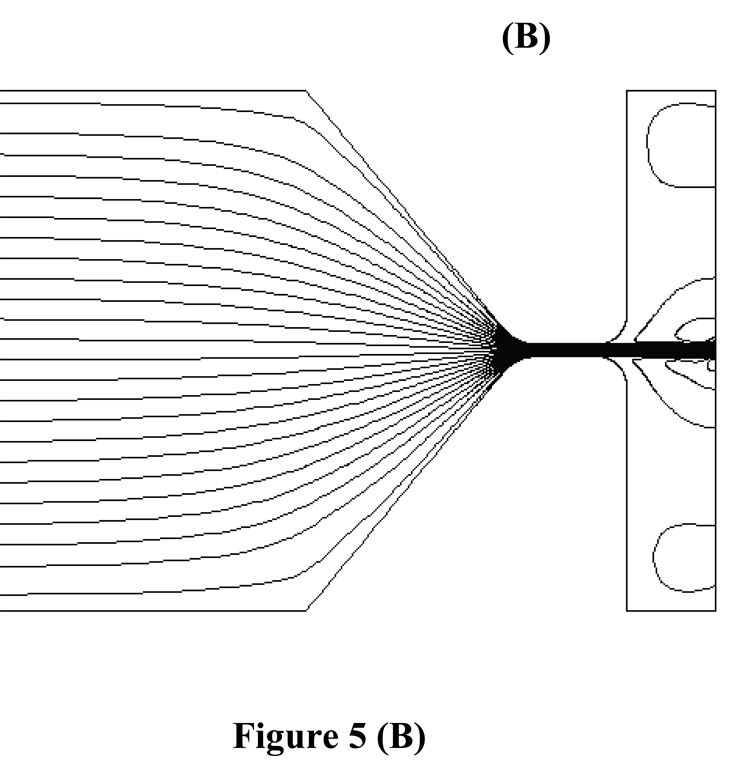
Results for the FLUENT velocity profiles, pressure contours, and streamlines are shown in Fig. 5 for the 3 cm H2O case. There it is clear [Fig. 5(A)] that the flow separates from the walls near the glottal exit as curvature becomes significant. The separation points S1 and S2 occur at the same axial distance, 0.221 cm from the glottal entrance, on both sides of the glottis, and the velocity profiles and the pressure contours exhibit symmetry with respect to the glottal midline. This symmetry is a consequence of the boundary condition imposed on the downstream pressure; that is, the pressure across the downstream duct along the edge of the computational region was taken as atmospheric pressure. (One can show that the separation points are different if the downstream boundary conditions on the sides of the glottis are different.) The velocity profile develops toward a parabolic shape as the flow proceeds through the glottis, although it does not become fully developed within the glottis. The pressure contours near the glottalentrance are closely spaced, consistent with the rapid decrease of the measured pressures of Fig. 3 in this region. The pressure contours spread out within the rectangular part of the glottis, and they are almost uniformly spaced, reflecting a nearly constant intraglottal pressure gradient there. This behavior would be expected from the action of viscous forces. Clearly, such a pressure decrease is apparent between taps 6 and 10 in each of the graphs of Fig. 3. The streamlines of Fig. 5(B) and the separation points of Fig. 5(A) show that the airflow exits the glottis as a jet.
FIG. 5.
(A) The velocity profiles, separation points, pressure contours, and (B) streamlines within and near the glottis for the uniform case when the transglottal pressure is 3 cm H2O. The separation points S1 and S2 mark the locations where the flow becomes detached from the walls. In (A) some of the pressure contours are identified by their values in Pascals. (3 cm H2O = 2940 dynes/cm2 = 294 Pa.)
IV. THE CONVERGING GLOTTIS OF THE HEMILARYNX
5° convergent glottis
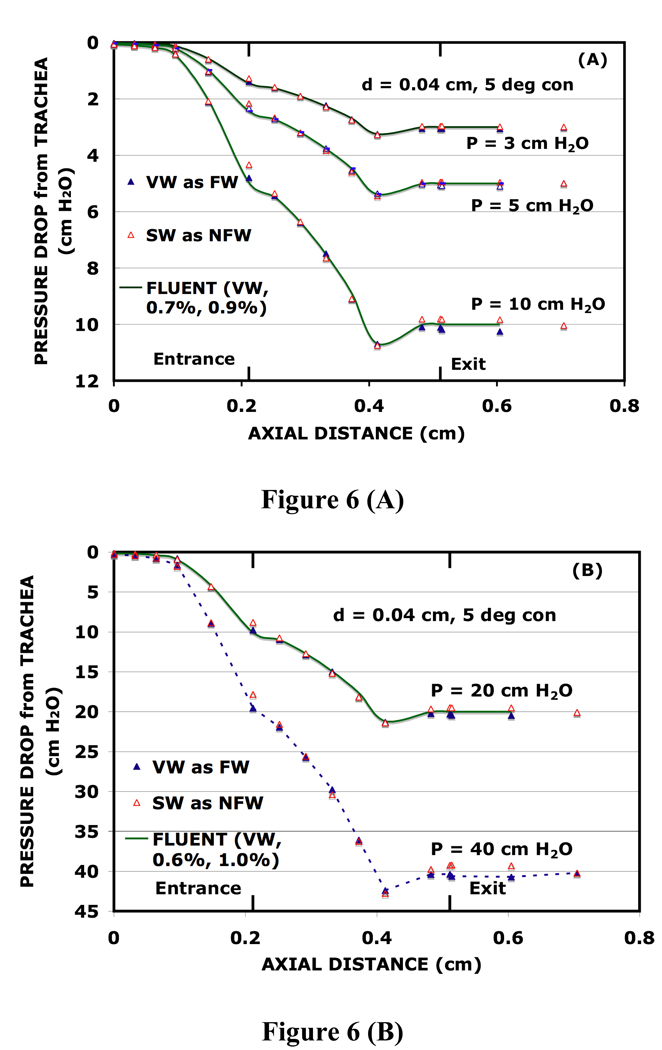
Measured pressure distributions for the 5° convergent channel of Fig. 1(C) are shown in Fig. 6, where the flow jet is along the vertical wall (FW). The vertical wall distributions are compared with the distributions on the slanted wall (NFW) for the transglottal pressures 3, 5, 10, 20, and 40 cm H2O. It is such pressure distributions that would ascertain how well pressure measurements on the fixed glass plate (when it was the FW) of the canine hemilaryngeal experiments of Alipour and Scherer9 approximated those acting on the dynamic vocal fold during its oscillation cycle. The distributions of Fig. 6 are presented as the drop in pressure below that of the trachea, instead of a pressure above the supraglottal pressure, as in Fig. 3. The presentation in Fig. 6 makes it easier to display details of the pressure distributions for a variety of transglottal pressures. In Fig. 6 FLUENT calculations for the VW as the FW are presented for the 4 lowest pressures, and dashed straight-line segments are used to connect the observed VW pressures for the 40 cm case, as a guide for the eye. As in the uniform case of Fig. 3, the FLUENT calculations reproduce the qualitative features of the data well. To measure the precision with which they agree with the measured distributions of Fig. 6, the subglottal error index for the FW is introduced by the expression,
| (3) |
where Pi(FL,FW) is the pressure calculated by FLUENT at the ith tap lying on the (vertical) FW. The values for ESUB(FW) are 0.6%, 0.9%, and 0.5% (average of 0.7%), respectively, for the three subglottal pressures of Fig. 6(A) and 0.6% for the P = 20 cm H2O curve of Fig. 6(B). They are the first entries in the parentheses accompanying the FLUENT calculations of Fig. 6. In analogy with Eq. (2), an intraglottal error index for the VW as FW is introduced, namely,
| (4) |
Its values are 1.0%, 0.8%, and 0.8% (average of 0.9%), respectively for the three subglottal pressures of Fig. 6(A) and 1.0% for the P = 20 cm H2O curve of Fig. 6(B). These values are the second entries in the parentheses that accompany the FLUENT calculations of Fig. 6. The FLUENT calculations presented in Fig. 6 are identified as those for the FW since its separation point S1 is slightly downstream of the separation point S2 of the SW side. The average (taps 5 to 14) percentage uncertainties for the voltages used to determine the empirical pressure distributions of Fig. 6 are 0.3%, 0.3%, 0.2%, 0.2%, and 0.1% for the transglottal pressures 3, 5, 10, 20, and 40 cm H2O, respectively. These voltage uncertainties determine uncertainties in the pressures of less than 1%, and error bars are not added to the data points of Fig. 6. The uncertainties for the remaining pressure distributions presented below are all about the same size, and hence error bars will not be included for any of the measured pressure distributions shown below.
FIG. 6.
Comparison of pressure distributions on opposing sides of the 5° convergent glottis of the hemilarynx of Fig. 1(C) when the VW is the FW for transglottal pressures of (A) 3, 5, 10, and (B) 20 and 40 cm of H2O.
Each of the distributions of Fig. 6 undergoes a substantial decrease in pressure between taps 4 and 6, as in the uniform case of Fig. 3, but the change is not as great because of the larger glottal entrance area. In contrast to the almost linear decreases of intraglottal pressure in Fig. 3, the distributions of Fig. 6 decrease at an increasing rate between taps 6 and 11. Such behavior should be expected since the glottal channel narrows between these taps, and a pressure decrease is required to accelerate the air (Bernoulli principle), in addition to the decrease associated with viscous resistance.
The pressures on the VW at tap 6 (glottal entrance) are lower than those on the convergent slanted wall at tap 6. These differences are 0.17 (5.7%), 0.17 (3.4%), 0.47 (4.7%), 0.94 (4.7%), and 1.73 (4.3%) cm H2O for the 3, 5, 10, 20, and 40 cm H2O pressures, respectively. Between taps 7 and 11 the intraglottal pressures for the opposing walls are nearly the same. For both walls, the pressures on the leading edges (tap 6) of the vocal folds are above those in the supraglottal region, and the pressures on the trailing edges (tap 11) are below those in the supraglottal region. Thus, the intraglottal pressures of Fig. 6 should produce pressure gradients that promote the development of surface waves on the vocal folds, just as in the uniform case. Between taps 12 and 15 the pressures on the VW are approximately 3% lower than those on the slanted wall, presumably an indication of increased flow near the VW and the flow structures it produces. It is unlikely that this small difference would have much direct influence on the oscillations of the vocal folds, although it is noted that the superior surface (taps 13 and 14) of the two vocal folds receive slightly different pressures.
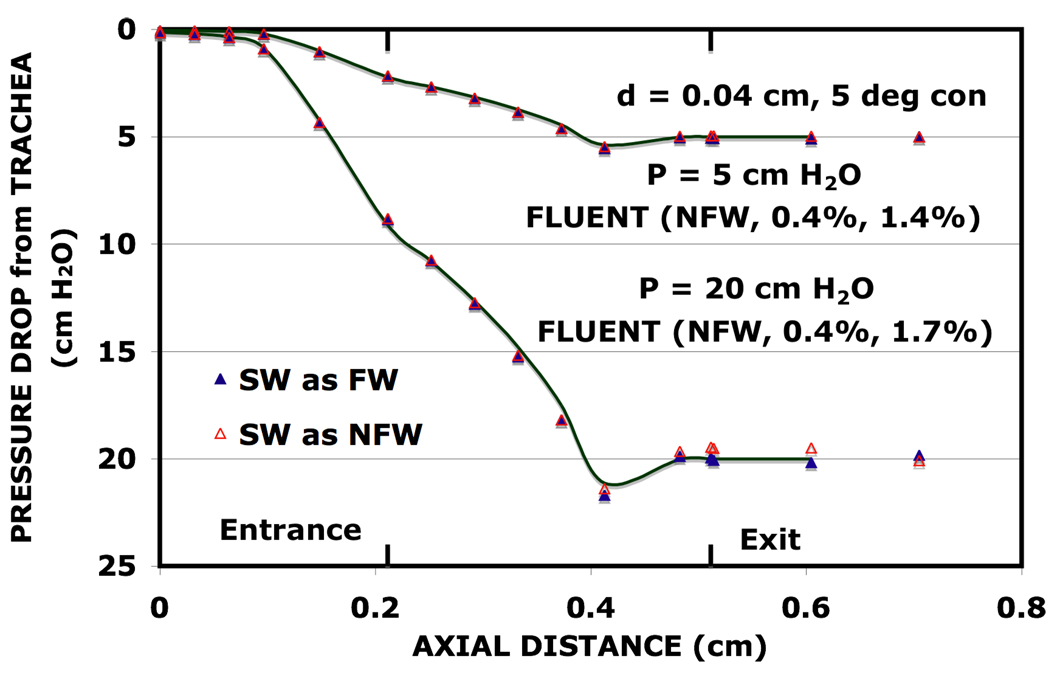
Pressure distributions on the SW for the two possible locations of the bistable flow jet for the 5° convergent case are shown in Fig. 7 for the transglottal pressures of 5 and 20 cm H2O, chosen as representative cases, since the shapes of the distributions for all 5 measured transglottal pressures are very similar. Differences depending on the location of the flow jet are of interest to consider fluctuations in the forces that drive a single vocal fold oscillating against a fixed structure. Such fluctuations would result if the exiting flow jet forms on one side of the hemilarynx during a vocal fold oscillation and then on the other side during the next oscillation. Cross-glottal differences for taps 6 to 10 are smaller than or comparable to the 1% upper limit determined for the experimental uncertainties in the measured pressures. The differences near the minima at tap 11 are somewhat larger (1.7% for P = 5 cm and 1.6% for P = 20 cm) and probably represent a real effect. As one would expect on the basis of the Bernoulli principle, the pressures on the slanted wall near the glottal exit tend to be lower when the jet is nearer it. The accuracy of the FLUENT calculations is determined by calculating the subglottal error index ESUB(NFW) for the NFW and the intraglottal error index EINT(NFW) for the NFW, analogous to Eqs. (3) and (4). Values for ESUB(NFW) are 0.4% for both FLUENT curves of Fig. 7, and values for EINT(NFW) are 1.4% and 1.7% for transglottal pressures of 5 and 20 cm H2O. Again the accuracy with which FLUENT reproduces the data is satisfactory.
FIG. 7.
Pressure distributions along the SW of the 5° convergent glottis of the hemilarynx for transglottal pressures of 5 and 20 cm H2O.
10° convergent glottis
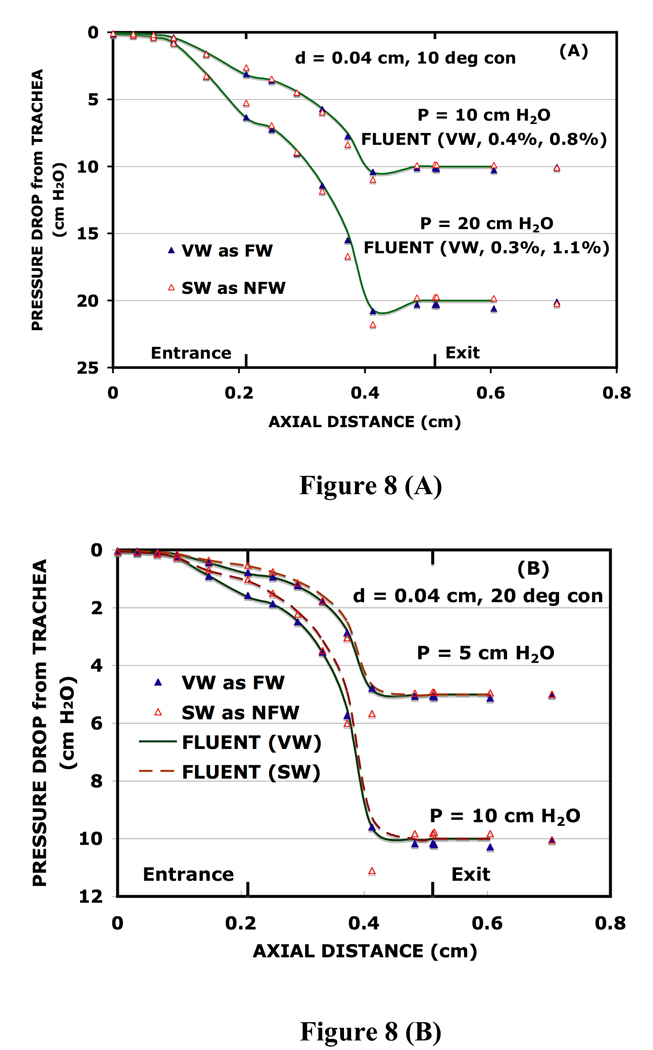
Pressure distributions for the 10° convergent channel of Fig. 1(B) are shown in Fig. 8(A) for transglottal pressures of 10 and 20 cm H2O, when the flow jet is near the VW. The pressure distributions for the 3, 5, and 40 cm H2O (not shown) are similar. As in Fig. 6, the VW as FW and the SW as NFW distributions are compared, and FLUENT results for the VW as FW are also shown. In Fig. 8(A) the FLUENT calculations are in good agreement with the measured pressures on the VW; the FW subglottal error index is 0.4% for the 10 cm pressure and 0.3% for the 20 cm pressure and the corresponding values for the FW intraglottal error indices are 0.8% and 1.1%. The subglottal error indices for the NFW [which compare FLUENT values on the NFW with the empirical pressures on the NFW (not shown)] for this angle are comparable to those for the FW, but the intraglottal error indices for the NFW are around 3%.
FIG. 8.
(A) Comparison of pressure distributions on opposing sides of the 10° convergent glottis of the hemilarynx of Fig. 1(B) when the VW is the FW for transglottal pressures of 10 and 20 cm H2O. (B) Comparison of pressure distributions on opposing sides of the 20° convergent glottis of the hemilarynx of Fig. 1(A) when the VW is the FW for P = 5 and 10 cm H2O.
As in the 5° converging case, the pressures at the glottal entrance (tap 6) for the 10° convergent case are higher on the SW than on the VW. These differences are 0.15 (5.0%), 0.25 (5.0%), 0.51 (5.1%), 1.09 (5.5%), and 2.22 (5.6%) cm H2O for the transglottal pressures of 3, 5, 10, 20, and 40 cm H2O, respectively, which tend to be slightly larger than their counterparts for the 5° convergent case. Pressures on the SW are, however, lower than on the VW for taps 8 to 11, with “cross-over” between taps 7 and 8. The pressures for the 10° converging case of Fig. 8(A) (up to tap 10 for this angle) continue the trend set by the 5° converging case of Fig. 6 and Fig. 7 and the uniform case of Fig. 3, that is, the pressures on the upstream side of the glottis tend to be higher than those of the supraglottal region and the pressures near the glottal exit tend to be lower than those of the supraglottal region. Thus, if the uniform glottis were followed by the 5° and 10° convergent geometries as part of a glottal cycle, this sequence of angles would tend to promote the development of glottal opening and the excitation of surface waves.
20° convergent glottis
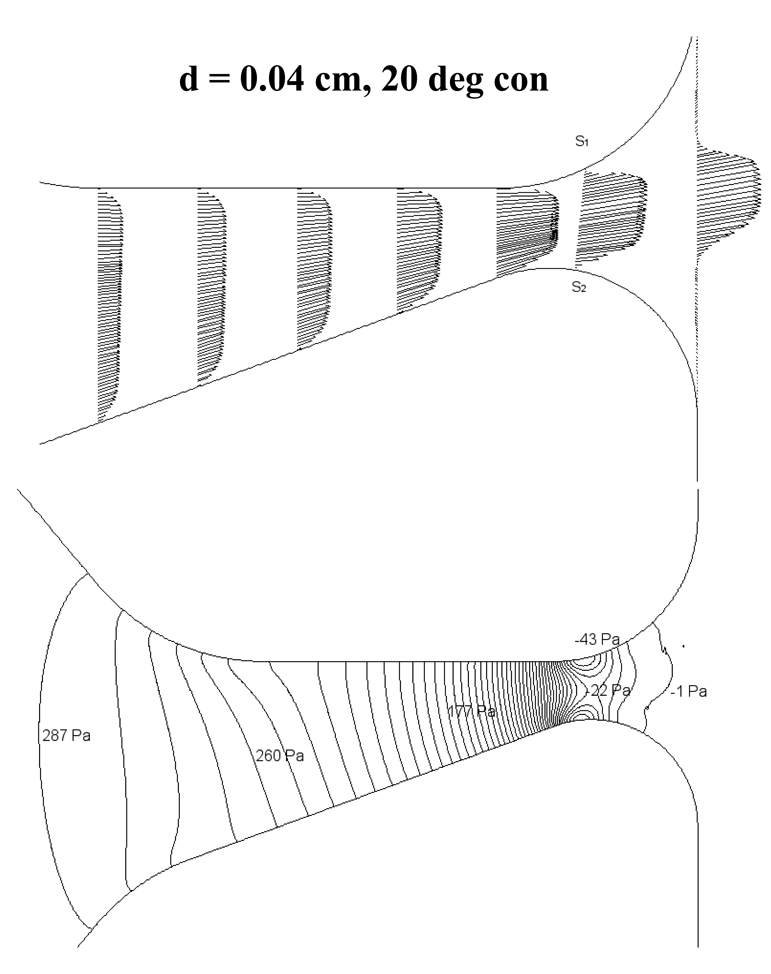
Pressure distributions for the 20° convergent channel of Fig. 1(A) are shown in Fig. 8(B), when the jet is along the VW (FW), and these distributions are compared with those of the SW (NFW), for transglottal pressures of 5 and 10 cm H2O. The 20° convergent geometry did not support bistable flow. The flow jet always favored the vertical wall and could not be coaxed to the opposite side. This is presumably due to the relatively large unilateral convergent angle (20°). Thus, the VW was always the FW, and the SW was always the NFW. Some support for this observation may be found in the pressure contours and velocity profiles20 of Fig. 9, where the asymmetric patterns of flow and pressure are apparent near the glottal exit as well as near the glottal entrance. The separation point S1 on the VW is about 0.006 cm further downstream than the separation point S2 on the SW, which is larger than the differences of the separation points for the smaller angles. The pressure contours near the glottal exit of Fig. 9 are dense, consistent with the steep slopes of the measured pressure distributions in this region.
FIG. 9.
Calculated velocity profiles, separation points, and pressure contours within and near the glottis for the 20° convergent angle when the transglottal pressure is 3 cm H2O.
Results of FLUENT calculations for the VW as the FW and the SW as the NFW are also presented in Fig. 8(B). Agreement of the calculations with the measured subglottal pressures is excellent for the FW (0.3% and 0.2% for the 5 and 10 cm H2O pressures, respectively) and the NFW (0.4% and 0.3%) subglottal error indices. FLUENT results for the intraglottal error index for the FW (0.9% and 0.8% for the 5 and 10 cm H2O pressures, respectively) are also very good. Thus, FLUENT gives a good account of the differences in the VW and the SW pressures near the glottal entrance, consistent with its earlier successes at tap 6 in Fig. 8(A). Most of the FLUENT results for the intraglottal pressures on the SW are reasonable, but FLUENT fails to reproduce the deep minima observed at tap 11 on the SW. According to the M5 data, these minima are 0.47 (15.5%), 0.88 (17.6%), 1.53 (15.3%), 2.93 (14.7%), and 5.58 (14.0%) cm H2O lower than the VW pressures at tap 11 for the 3, 5, 10, 20, and 40 cm H2O pressures, respectively. Some evidence of this trend was apparent from the SW results for the 10° convergent geometry of Fig. 8(A) but the differences in Fig. 8(B) are more than twice as large. This discrepancy may be a consequence of inadequately accounting for flow acceleration near the convergent glottal exit or the development of turbulent flow structures whose complexity requires numerical methods beyond the scope of the laminar approach of FLUENT, or a combination of these two effects.
V. THE DIVERGING GLOTTIS OF THE HEMILARYNX
5° divergent glottis
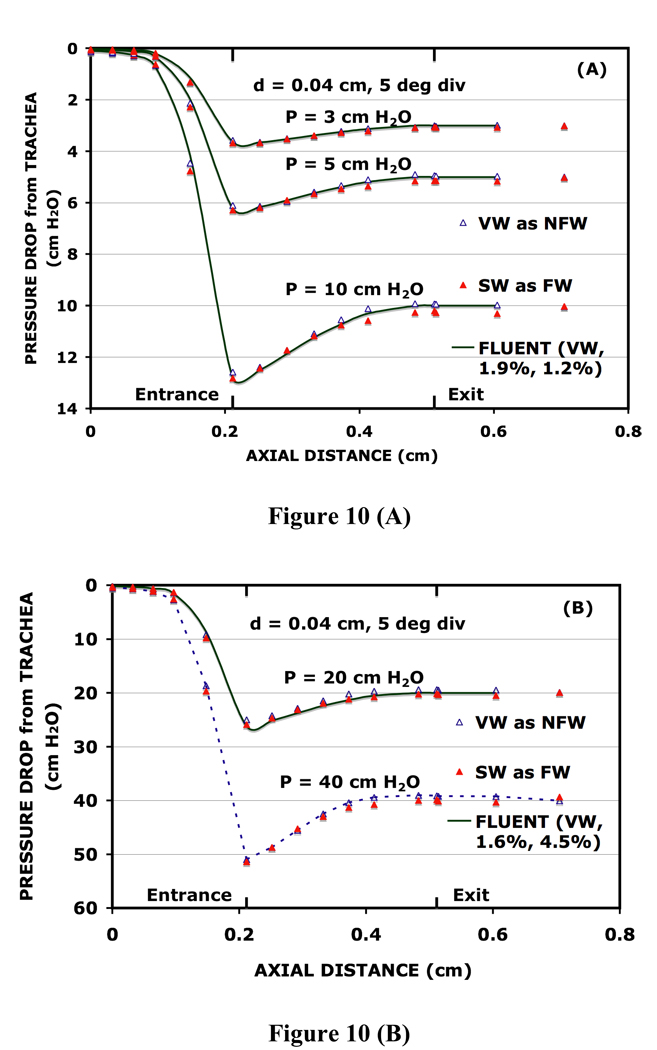
Observed pressure distributions for the 5° diverging channel of Fig. 1(E) are shown in Fig. 10 when the flow jet is near the SW (FW). The SW distributions are compared with those of the opposing VW (NFW) for the transglottal pressures of 3, 5, 10, 20, and 40 cm H2O. The FLUENT calculations presented in Fig. 10 are those for the VW as the NFW. This choice for FLUENT is dictated by the usual criterion, that is, the separation point on the SW side is slightly downstream of the separation point on the other side, and thus SW is the FW. This unusual location of the separation point is a contrast with those for all of the other converging and diverging angles considered in this work. Nevertheless, this interpretation leads to the usual situation in that the FW pressures (on the SW) near the glottal exit and beyond tend to be lower than the corresponding NFW pressures (on the VW), a trend found in the FLUENT calculations as well as in the data. In particular, the observed pressures on the SW at tap 11 are 3.2%, 5.2%, 4.6%, 5.2%, and 3.3% lower than the VW pressures for the 3, 5, 10, 20, and 40 cm H2O transglottal pressures, respectively. The pressures on the SW are also slightly lower near the glottal entrance. The NFW subglottal error indices calculated for the FLUENT results of Fig. 10 are 2.7%, 1.6%, 1.2% [average of 1.9% in Fig. 10(A)], and 1.6% for the 3, 5, 10, and 20 cm H2O transglottal pressures, respectively, showing good agreement. The NFW intraglottal error indices for Fig. 10 are 0.9%, 1.4%, 1.2% [average of 1.2% in Fig. 10(A)], and 4.5% for the 3, 5, 10, and 20 cm H2O transglottal pressures, respectively.
FIG. 10.
Comparison of the pressure distributions on opposing sides of the 5° divergent glottis of the hemilarynx of Fig. 1(E). In this case the VW is the NFW for both the empirical data and for FLUENT.
If one compares the curves of Fig. 10 with those of the 5° convergent case (Fig. 6 and Fig. 7), substantial qualitative differences are apparent. These are typical of the differences between convergent and divergent glottal shapes. For the divergent angle, the pressure decreases from taps 4 to 6 much more quickly, so that the pressures at the glottal entrance are lower than the pressures in the downstream supraglottal region. Moreover, the intraglottal pressures of Fig. 10 increase monotonically (“recover”) from the glottal entrance to the glottal exit, in contrast to those of Fig. 6 and Fig. 7. Thus, whenever the 5° divergent geometry of Fig. 1(E) is part of the phonation cycle, the intraglottal pressures are lower than those of the supraglottal region, which would tend to pull the vocal folds towards the midline (assuming that the pressure in the supraglottal region is atmospheric). The direction of the aerodynamic forces on the vocal folds for the diverging shape of Fig. 1(E) is opposite to that for the converging shape of Fig. 1(C), since the higher intraglottal pressures there tend to push the vocal folds away from the midline. It is this pushing (converging shape) and pulling effect (diverging shape) that is the key to the transfer of energy from the airflow to the kinetic energy of the vocal folds19,26–28.
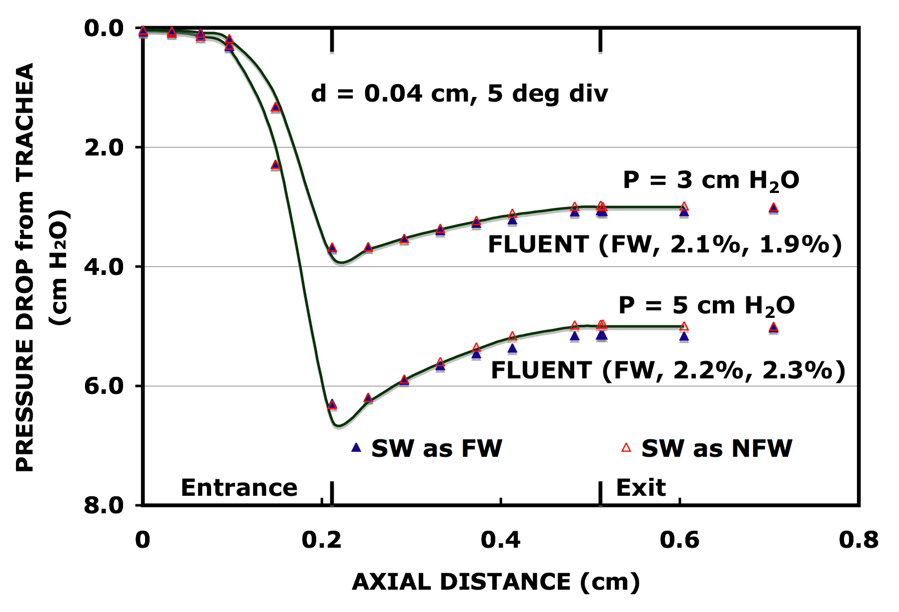
Pressure distributions for the 3 and 5 cm H2O cases are shown in Fig. 11 for the 5° divergent case when the SW is the FW and also when the flow is shifted to the other side so that the SW is the NFW. The measured distributions show very little sensitivity between taps 6 and 9 to the location of the flow jet. The FW pressure at tap 11 is 3.7% lower than the NFW pressure there when P = 3 cm H2O and 4.1% lower when P = 5 cm H2O. The distributions are compared with FLUENT calculations for the SW as the FW. The FLUENT calculations of Fig. 10 and Fig. 11 reproduce the observed monotonic pressure increases accurately, but the rapid decrease between taps 5 and 6 in Fig. 11 is exaggerated by about 14%, and FLUENT overestimates the pressures for taps 10 to 15 somewhat. However, all of the FW subglottal error indices and the FW intraglottal error indices there are around 2%.
FIG. 11.
Pressure distributions along the SW for the 5° divergent glottis of the hemilarynx for transglottal pressures of 3 and 5 cm H2O. Empirical data are for two cases for the SW: when it is the FW and when it is the NFW (after shifting the flow direction). The FLUENT lines are for the pressures on the SW when that wall is the FW.
10° divergent glottis
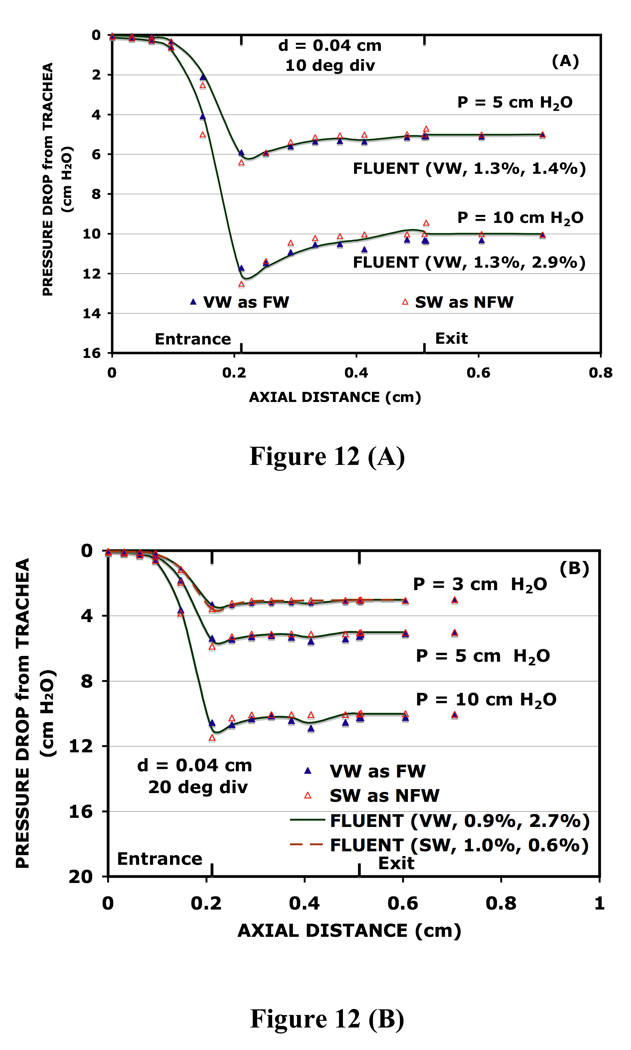
Pressure distributions for the 10° diverging case of Fig. 1(F) are shown in Fig. 12(A) for transglottal pressures of 5 and 10 cm H2O, where the VW (FW) pressures are compared with those for the SW (NFW) and with FLUENT calculations for the VW (FW) side. The VW pressures near the glottal exit are lower than the SW pressures (tap 11: 7.1% and 7.5% for the 5 and 10 cm H2O cases, respectively) consistent with the general finding in this study of lower pressures near the glottal exit on the side where the flow is faster. The SW pressures near the glottal entrance are lower than those on the VW (tap 6: 10.0% and 8.0 % for the 5 and 10 cm H2O cases, respectively) due to flow acceleration at that curvature, and thus if curves were drawn through the observed SW and VW pressure distributions, they would intersect each other inside the glottis.
FIG. 12.
(A) Comparison of the pressure distributions on opposing sides of the 10° divergent glottis of the hemilarynx of Fig. 1(F) when the VW is the FW for transglottal pressures of 5 and 10 cm H2O. (B) Comparison of the pressure distributions on opposing sides of the 20° divergent glottis of the hemilarynx of Fig. 1(G) when the VW is the FW for transglottal pressures of 3, 5, and 10 cm H2O.
The FW subglottal error indices for Fig. 12(A) are 1.3% for the 5 and 10 cm H2O pressures, and the FW intraglottal error indices are 1.4% and 2.9% for the 5 and 10 cm H2O pressures. The abrupt (but relatively small) change between taps 13 and 14 for the SW is a new feature, which was not seen for the convergent angles, the rectangular case, or the 5° divergent case. It presumably is an indication of vortical structures or turbulence that acts to move flow toward tap 14.
20° divergent glottis
Pressure distributions for the 20° divergent angle of Fig. 1(G) are shown in Fig. 12(B) for pressures of 3, 5, and 10 cm H2O, where the VW (FW) pressures are compared with the SW (NFW) pressures. As is usually the case, the FW pressures are lower than the NFW pressures near the glottal exit at tap 11 (5.8%, 8.7%, 8.4%, respectively, for the 3, 5, and 10 cm H2O pressures). These differences are larger than those for the 10° divergent pressures of Fig. 12(A), and even larger differences (not shown) at tap 11 were measured for transglottal pressures of 20 (11.7%) and 40 cm H2O (20.9%). Each of the FW pressure distributions of Fig. 12(B) has a local minimum near the glottal exit (at tap 11), in addition to the local minimum near the glottal entrance (tap 6). FLUENT also reproduces these two minima when the VW is the FW. In addition, it determines only one minimum (near the glottal entrance) when the SW in the NFW, consistent with the M5 measurements. At the glottal entrance the pressures on the NFW are 10.9%, 10.0%, and 9.0%, respectively, lower than the pressures on the FW for the 3, 5, and 10 cm H2O pressures, as shown in Fig. 12(B). These differences continue the trend of lower NFW pressures (for the SW) at the glottal entrance noted in Fig. 12(A). The FW subglottal error indices of Fig. 12(B) average 0.9%, and the FW intraglottal error indices average 2.7%. The 3 cm case of Fig. 12(B) is exceptional in that it does not support bistable flow, and thus the VW is always the FW, and the SW is always the NFW. The subglottal error index for the 3 cm case is 1.0%, and the intraglottal error index is 0.6%. It is interesting to note that all of the observed SW (NFW) pressures near the glottal exit and into the supraglottal region (taps 9 to 16) are nearly constant for each of the transglottal pressures of Fig. 12(B). This behavior is also true for the SW distributions for 20 and 40 cm H2O transglottal pressures (not shown).
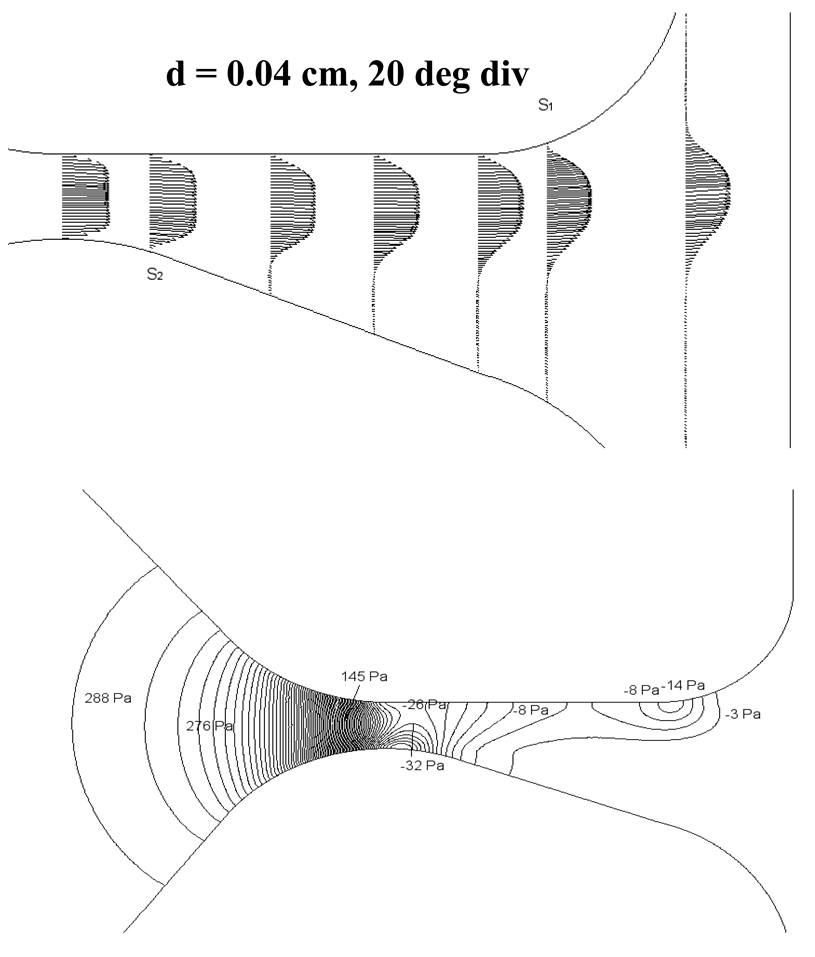
Velocity profiles, separation points, and pressure contours calculated with FLUENT are shown in Fig. 13 for the 20 degree diverging angle and transglottal pressure of 3 cm H2O. The separation point on the VW (S1) is much further downstream (0.19 cm) than that on the SW (S2). The pressure contours near the SW for the downstream part of the glottis show that the pressures in this region should be nearly constant, as expressed in the M5 data for each of the SW pressures shown in Fig. 12 (B). Such behavior is expected when a stall is created with a large angle diffuser15. The pressure contour structure on the VW near the glottal exit of Fig. 13 offers an explanation of the VW minima observed in this vicinity in Fig. 12(B).
FIG. 13.
Velocity profiles, separation points, and pressure contours within and near the glottis for a 20° divergent angle calculated with FLUENT. The transglottal pressure was 3 cm H2O.
VI. DISCUSSION OF PRESSURE DISTRIBUTIONS
Average pressures on the slanted glottal wall
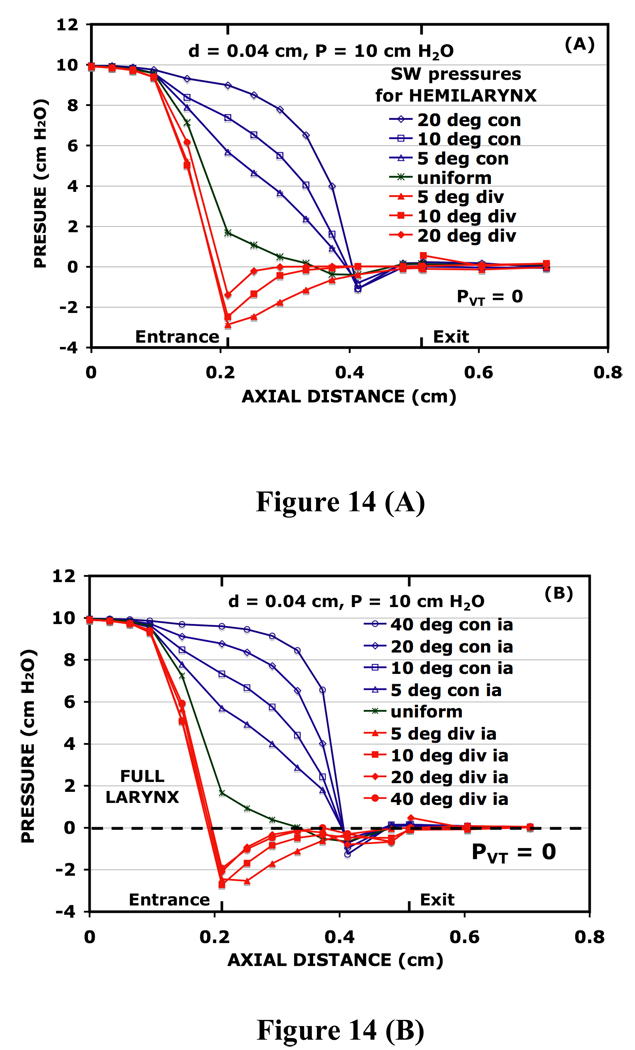
Hemilarynx pressure distributions along the SW for all of the angles of Fig. 1 are shown in Fig. 14(A) when the transglottal pressure is 10 cm H2O. The pressures there are averages of the pressures when the SW is the FW and when it is the NFW. Differences between the FW and the NFW pressures may be used to set limits on the uncertainties if the flow jet appears on different sides of the glottis during phonation. To get a quantitative estimate of this uncertainty, the average of the absolute pressure differences between the SW as the FW and as the NFW within the glottis (taps 6 to 13) was divided by the 10 cm H2O transglottal pressure. This calculation yields 1.8% for the 5° divergent distribution of Fig. 14(A), which was the largest uncertainty for all the angles studied. The averages should thus be relevant pressures for the vibration of a single fold against a fixed structure (VW) of the type used here, since the bistability of the flow jet is likely to ensure that the jet is near the oscillating fold some of the time and near the fixed wall the remainder of the time24,25.
FIG. 14.
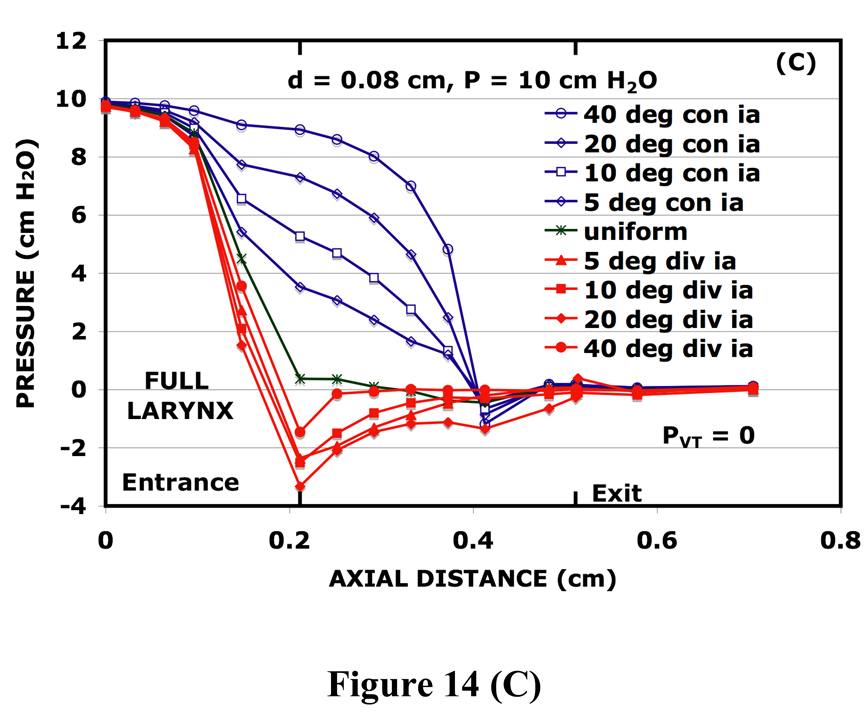
10 cm H2O pressure distributions for the hemilarynx with (A) d = 0.04 cm, (B) the full (symmetric) larynx with d = 0.04 cm, and (C) the full larynx with d = 0.08 cm. The angles for the hemilarynx (A) are those that the slanted glottal wall makes with the opposite vertical wall. The angles for the full larynx (B) and (C) are included angles, which are twice the angle that each of the vocal fold surfaces make with the glottal axis. In each case the data points are connected with straight-line segments. The pressures are relative to the supraglottal region, the same scale used in Fig. 3.
Forces in the direction of motion
It was noted in Sect. IV that most of the intraglottal pressures (taps 6 to 11) for the converging angles were above the pressures of the supraglottal region, as is apparent from the first three distributions of Fig. 14(A). Since these angles occur during the opening phase of the vocal fold cycle, the aerodynamic forces are mostly in the direction of the motion, and they do positive work on the mobile vocal fold, increasing its kinetic energy. As this vocal fold returns to its equilibrium position, the glottis tends to have a diverging shape, which means that the diverging angle distributions of Fig. 14(A) come into play. Since most of these intraglottal pressures (taps 6 to 9 or 10) are below the pressures of the supraglottal region, they create a partial vacuum in the glottis, producing forces on the mobile vocal fold that act toward the midline. These forces are also in the direction of motion, and thus they do positive work on the mobile vocal fold and add to its kinetic energy.
Functional similarity with the symmetric glottis
In order to compare the energizing mechanism of hemilaryngeal phonation with that of full laryngeal phonation, pressure distributions collected with symmetric combinations of the M5 vocal fold pieces at d = 0.04 cm30 and at d = 0.08 cm31 are presented in Figs. 14(B) and 14(C) for nine different values of the included angle when the transglottal pressure is 10 cm H2O. In comparing these distributions with those of Fig. 14(A), it is important to note that the included angle is defined as the actual angle between the glottal sides. The curves of Figs. 14(B) and 14(C) are averages of the FW and NFW, since the flows at these angles are all bistable, and one would expect a given vocal fold to be the FW some of the time and the NFW the remainder of the time. Differences between the FW and the NFW pressures for Figs. 14(B) and 14(C) are larger than in the hemilarynx case. They become as large as 11% for the 20° distribution of Fig. 14(B) and as large as 8% for the 10° and 20° distributions of Fig. 14(C).
An interesting question arises: Which of the full laryngeal distributions of Fig. 14 is the most relevant for examining the hypothesis of functional similarity? Is it more important for the hemilarynx pressures of Fig. 14(A) to be close to (a) those with twice the minimal diameter and an included angle equal to twice the hemilaryngeal angle [like adding a mirror image to the hemilarynx, Fig. 14(C)] or to (b) those of with the same minimal diameter and the same included angle [as in Fig. 14(B)]? Fortunately, the data of Fig. 14 show that the hemilarynx distributions are close to the full larynx distributions for either of these conditions, that is, the pressure distributions of the hemilarynx are similar to those of the full larynx in Fig. 14 (B) when the angle is the same, and not very different from those of the full larynx in Fig. 14 (C) for twice the angle, especially for converging angles, which play a larger role than the diverging angles in energizing the vocal folds. For example, the pressure distribution for the hemilarynx for 0.04 cm and 20° convergence is similar to that for the symmetric glottis of 0.04 cm diameter for 20° convergence, and not very different from that for the symmetric glottis of 0.08 cm diameter for 40° convergence.
The pressure distributions for the uniform glottis are identical between the hemilarynx and the symmetric glottis for minimal diameter of 0.04 cm [Figs. 14(A) and 14(B)], since the geometry is identical in this case. For divergent glottal angles of Figs. 14(A), 14(B), and 14(C), the spread of pressure distributions is not as large as for convergent angles. Further, the minima near the glottal entrance tend to become deeper as the angle increases from 5° to 20° in all three cases, although the increases are rather modest. In addition, the minima for Fig. 14(B) and Fig. 14(C) are deepest for 20° and become shallower when the angle is increased to 40°, and the 40° distributions are closer to the 5° distributions than those at the other two angles. The clustering of the pressure distributions for the diverging angles in Figs. 14(B) and 14(C) suggests that these pressures should produce driving forces during glottal closing similar to those of Fig. 14(A).
From the discussion in the two preceding paragraphs, it is reasonable to expect the aerodynamic forces for the hemilarynx would transfer energy to the moving vocal folds during the cycle of phonation similar to the action of the aerodynamic forces in the symmetric larynx. Thus, the distributions of Fig. 14 provide a reasonable explanation for Jiang and Titze’s observations1,4 that the amplitude and shape of the oscillating vocal fold during hemilaryngeal phonation is similar to that of the (symmetric) motion of either fold during full laryngeal phonation. This observation is support for the hypothesis of functional similarity of laryngeal and hemilaryngeal phonation advanced by Jiang and Titze1.
Pressure scaling – uniform glottis
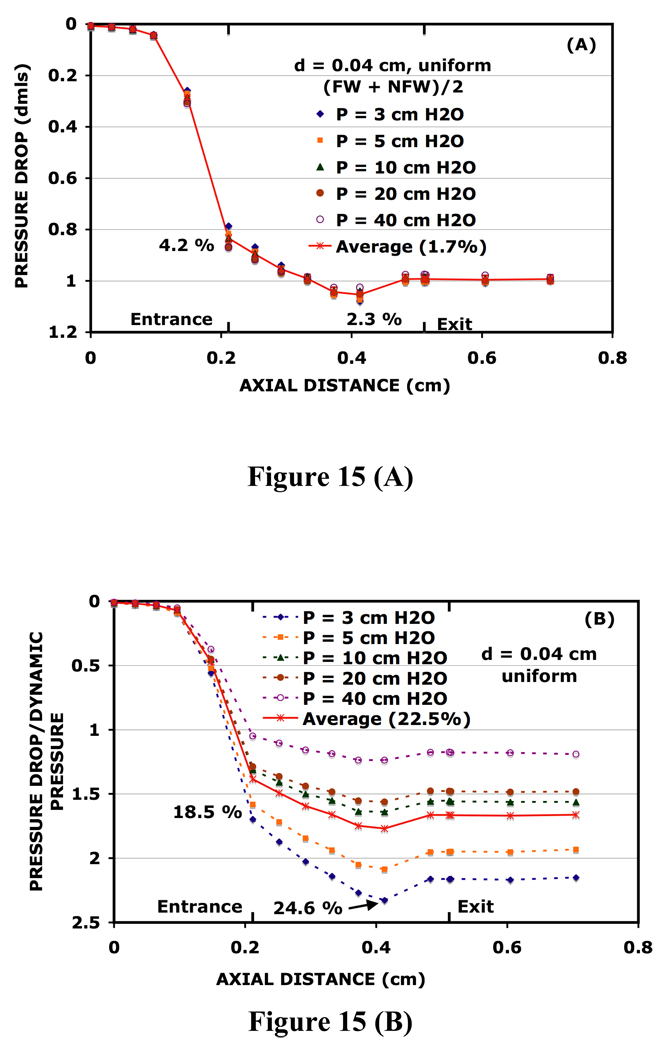
Inspection of the pressure distributions of Fig. 3 for the uniform glottis reveals that the dependence of each on the axial distance is very similar. This raises the question of whether there is a universal shape for this set of pressure distributions. To explore this question, the dimensions from each of the pressure distributions of Fig. 3 were removed by dividing each of the pressures there by its corresponding transglottal pressure. Data collected for the uniform glottis for 5 and 40 cm H2O transglottal pressures were also treated this way. Since most of the differences between the FW and the NFW are relatively small for the uniform case, the FW and NFW pressures for each of the transglottal pressures were averaged before computing the pressures of Fig. 15(A). The dimensionless pressures are presented as unconnected data points in Fig. 15(A) for each of these 5 transglottal pressures. At many of the pressure taps the values of the dimensionless pressures almost coincide, showing that the shapes of all of the pressure distributions in Fig. 3 are almost the same. A curve representing the averages of the five pressure distributions is also shown in Fig. 15(A). Each point on the average curve carries an error bar of 1.7%. The size of this error bar was computed as an average of the fractional uncertainties at each pressure tap. The uncertainty at each tap was computed by dividing the standard deviation of the five dimensionless pressures at that tap by the average of the five pressures at that tap21. From inspection of Fig. 15(A) the largest spread of dimensionless pressures appears at tap 6. For this tap the standard deviation is 4.2% of the average pressure, and at tap 11, 2.3%. We conclude that to a high degree of accuracy (2 to 3% in most cases) all of the pressure distributions of Fig. 3 have a similar shape. We refer to this behavior as successful or consistent pressure scaling. To summarize, for the uniform glottis with d = 0.04 cm, the M5 pressure distributions are consistent with pressure scaling to an average of about 2%, with maximum variations of 3 to 4%.
FIG. 15.
(A) Dimensionless pressure distributions for the uniform glottis. The averages of the M5 pressures for the FW and the NFW are depicted. (B) Nondimensional pressures determined by dividing the M5 pressures by the corresponding dynamic pressures.
Knowledge of the validity of pressure scaling for the pressure distributions observed with model M5 is important to those who wish to use data from the model to represent the aerodynamic forces acting on the vocal folds, for the symmetric larynx as well as for the hemilarynx. When pressure scaling is valid, it affords an economical representation of the M5 data, since only one pressure distribution at a given diameter and angle is required to represent the information content for a wide range of transglottal pressures. Such regularity would decrease the size of the arrays needed to store the M5 pressures by a factor of four or five. Further, knowledge of the accuracy of pressure scaling provides the level of confidence in estimating pressure distribution values for transglottal pressures between those for which data are available (extrapolating beyond the range of the empirical transglottal pressures would remain risky).
Treating the FLUENT results in the same way as the M5 results of Fig. 15(A) yields a figure very similar (not shown) to that of 15(A). Consistency of pressure scaling determined by FLUENT is somewhat better than that of 15(A), suggesting that the FLUENT calculations give a slight exaggeration of the validity of pressure scaling. For example, the maximum variation at tap 6 is only 3.2%, and the variations averaged over the 5 pressures of Fig. 15(A) is only 0.9%, almost a factor of 2 smaller than the average variation for the M5 data.
Dimensionless pressure using dynamic pressure – uniform glottis
Another common way of determining a dimensionless pressure is to divide the observed pressure at each tap by the dynamic pressure10,32, that is, ρv2/2 (a ratio typically called a pressure coefficient), where ρ is the density of the air and v is the average particle velocity calculated by dividing the volume flow rate by the minimal cross-sectional area of the glottis. The density was taken to be 0.0012 g/cm3, and the glottal length as 1.2 cm, to give a minimal glottal area of 0.048 cm2. Thapa16 also measured the volume velocities, which will be discussed in the next section, for each of the pressure distributions discussed above. Ratios of the pressure drops to the dynamic pressures for the uniform glottis are depicted in Fig. 15(B), where each distribution is connected with dashed straight-line segments. An average for the five transglottal pressures is also shown. The dimensionless pressures of Fig. 15(B) show a much larger spread than those of Fig. 15(A), showing that this type of nondimensionalizing does not permit all of the pressure distributions for a given geometry to be reduced to a universal shape (but has strong simplification potential for the relation between a pressure coefficient at a particular location versus Reynolds number, as shown throughout the history of hydraulic research).
Pressure scaling – non-uniform glottis
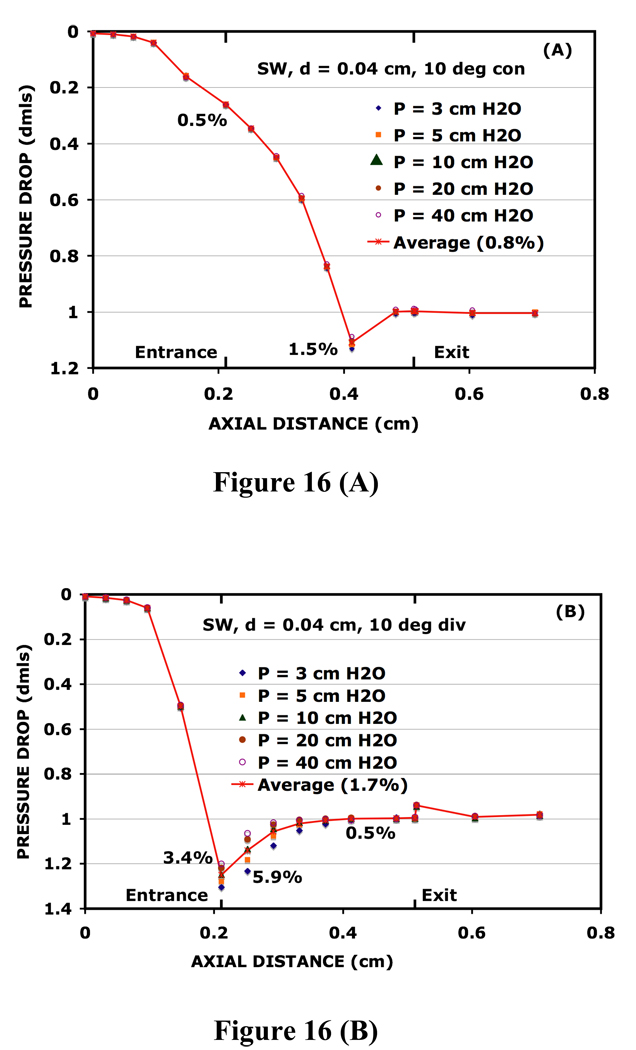
The success of pressure scaling with the uniform glottis suggests it would be useful to test this concept for the rest of the data considered in this study. To this end, dimensionless pressure distributions (by dividing by the transglottal pressure) were determined along the SW for each of the converging and diverging angles of Fig 1. As examples, dimensionless pressures are presented as unconnected points in Fig. 16(A) for a converging angle of 10° and in Fig. 16(B) for a diverging angle of 10°. The averages at each tap and the error bars (not shown) for the averages were determined as in Fig. 15(A). Pressure scaling was highly successful for the converging angle of Fig 16(A), since the individual dimensionless pressures almost coincide at every pressure tap. The maximum variation occurred at tap 11 and was only 1.5%. The average variation for the entire 10° converging data set (d = 0.04 cm) was only 0.8%. The average variation for the 5° converging data set was 0.9% (not shown), and the average for 20° converging data set was 1.1% (not shown).
FIG. 16.
Dimensionless M5 pressure distributions along the SW (A) for a converging angle of 10° and (B) a diverging angle of 10°.
Pressure scaling variations were somewhat larger for the diverging angles of Fig. 1, as illustrated by the case of the 10° diverging angle presented in Fig. 16(B). There the variation at tap 6 was 3.4%,, determined by the ratio of the standard deviation to the average, which was larger than for any of the taps for converging angles. The variation at tap 7 was 5.9%. and for tap 8 larger still. Nevertheless, the overall average variation of pressure scaling was only 1.7% in Fig. 16(B). Pressure scaling variations were comparable for the 5° diverging data set (not shown), where the average variation was 1.6%, and about the same for the 20° diverging case (not shown), where the average variation was 1.8%. Variations of pressure scaling near the glottal entrance for these two diverging angles were smaller than those depicted in Fig. 16(B), but extend over a larger portion of the glottis. It is noted that the pressures in the glottis of Fig. 16(B) (taps 6–10) systematically decreased as transglottal pressure increased, and modelling schemes sensitive to the intraglottal pressures for diverging glottal ducts might use the pressure scaling approach with modifications appropriate for the given transglottal pressure.
Shape of vertical glottal wall
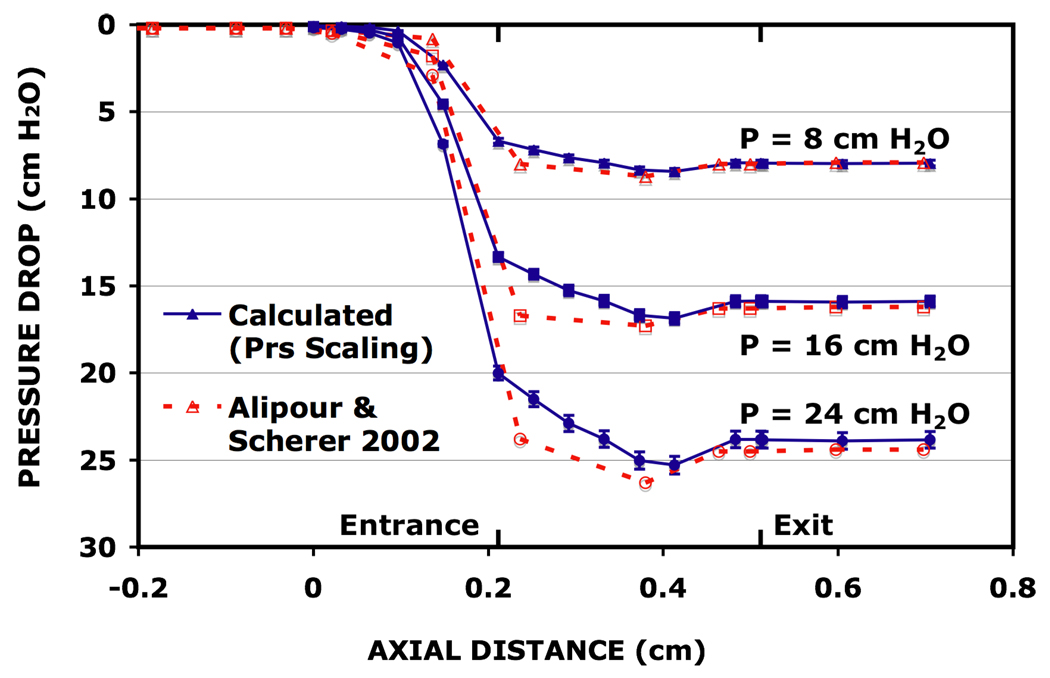
If a surgeon judges that a dysfunctional vocal fold should be immobilized or replaced, there is still the question of the contour of the fixed structure that the mobile vocal fold should oscillate against. Among the possibilities are: (1) a glottal shape like that of Fig. 1(D) where the form of the converging subglottal shape is preserved on both sides, and (2) a shape like the hemilarynx used by Alipour and Scherer in their 2002 study, where the fixed structure is part of a long straight wall, and the symmetric converging channel of Fig. 1(D) is not present. (In this case the vertical wall of the fixed structure would be extended into the subglottal and the supraglottal regions.) Is there some reason for believing that one of these shapes may offer an advantage to the patient? A tentative means of addressing this question is shown in Fig. 17, where pressures measured by Alipour and Scherer for the diameter d = 0.04 cm [data for the vocal fold surface opposite to the long, straight wall of Fig. 4(a) in their paper] are compared with calculations based on the measurements presented in Fig. 15(A) (this paper) and the assumption of consistent pressure scaling. An obstacle to such a comparison is the different axial glottal length used in the two hemilarynx models. In an effort to take this difference into account, the axial coordinate X of Fig. 4(a) of Alipour and Scherer has been scaled according to the formula XM5 = 0.2390 XAS + 0.3033. (See Note #33 below.) The pressure curves for the two models are in reasonable agreement near the glottal exit, suggesting that pressure recovery is similar for the two hemilarynx models. However, the differential pressures between the glottal entrance and the glottal exit are considerably larger for the hemilaryngeal shape of M5 [Fig. 1(D)] than for the hemilarynx with the long straight wall (most likely due to a flatter velocity profile at the glottal entrance of M5). The discussion in connection with Fig. 3 (this paper) pointed out that this pressure differential was important in providing the appropriate forces to excite a wave along the surface of the vocal fold. One possible interpretation of Fig. 17 is that preserving the converging shape in the subglottal region (as in model M5) may make the excitation of a glottal surface wave easier, which would allow phonation to occur at lower threshold pressures, and may very well result in a more efficient transfer of energy from the airflow to the motion of the vocal fold. It is noted that the hemilarynx based on model M5 contains more pressure taps in the intraglottal region than that with the long straight wall.
FIG. 17.
Comparison of pressure distributions collected with the static hemilarynx model of Alipour and Scherer13 with calculations based on the assumption of pressure scaling and the measurements of the uniform hemilarynx of Fig. 1(D). Extending the scale of the axial distance to negative values is required since Alipour and Scherer had more pressure taps in the subglottal region. Error bars of 2% are attached to the calculated pressures, consistent with the error estimates of Fig. 15(A).
VII. FLOW RATES
The volume velocities were measured for all the angles in Fig. 1 for transglottal pressures of 3, 5, 10, 20, and 40 cm H2O using the pneumotech-pressure transducer system described in connection with Fig. 3 of Fulcher et al.34. These flow rates are listed in Table I. Most of the converging and diverging angles have two entries, which consider the side that the flow jet prefers, and the differences between these two entries are generally quite small. The pressure-averaged differences for the 10° con, 5° con, 5° div, 10° div, and 20° div rows of Table I are 1.4%, 0.6%, 3.8%, 2.4%, and 2.2%, respectively. The largest difference for diverging angles is 5.1% for P = 40 cm at 5°, and the largest difference for the converging angles is 2.0% for P = 10 cm at 10°. All the pressures at the 20° converging angle and the 3 cm H2O pressure at the 20° diverging angle have only one entry, since these pressures and angles did not support bistable flow. The symmetry of the walls in the uniform case determine the same flow rate results regardless of which wall the jet favors, in spite of the fact that the intraglottal pressures are slightly different on the opposing walls (Fig. 3).
TABLE I.
Angle and pressure dependence of the hemilaryngeal flow rates (at d = 0.04 cm). All flow rates are in cm3/s. The first row (a) refers to conditions when the VW is the FW, and the second row (b) when the SW is the FW.
| Angle | P = 3 cm H2O |
P = 5 cm H2O |
P = 10 cm H2O |
P = 20 cm H2O |
P = 40 cm H2O |
|
|---|---|---|---|---|---|---|
| 20° con | (a) | 87.4 | 116.2 | 176.5 | 259.3 | 374.3 |
| 10° con | (a) | 85.9 | 114.1 | 172.1 | 250.9 | 373.7 |
| (b) | 84.8 | 112.4 | 168.8 | 253.6 | 370.5 | |
| 5° con | (a) | 79.4 | 105.8 | 161.8 | 238.7 | 359.8 |
| (b) | 80.1 | 107.3 | 161.1 | 239.1 | 359.2 | |
| 0° | (a) | 72.4 | 98.5 | 154.5 | 225.1 | 353.4 |
| 5° div | (a) | 92.4 | 124.4 | 190.0 | 278.9 | 423.8 |
| (b) | 89.3 | 120.5 | 184.9 | 267.6 | 403.1 | |
| 10° div | (a) | 94.1 | 124.1 | 186.3 | 262.2 | 402.2 |
| (b) | 92.1 | 121.8 | 179.6 | 264.3 | 387.0 | |
| 20° div | (a) | 87.6 | 115.4 | 176.4 | 253.5 | 382.8 |
| (b) | 118.6 | 181.8 | 256.5 | 377.2 | ||
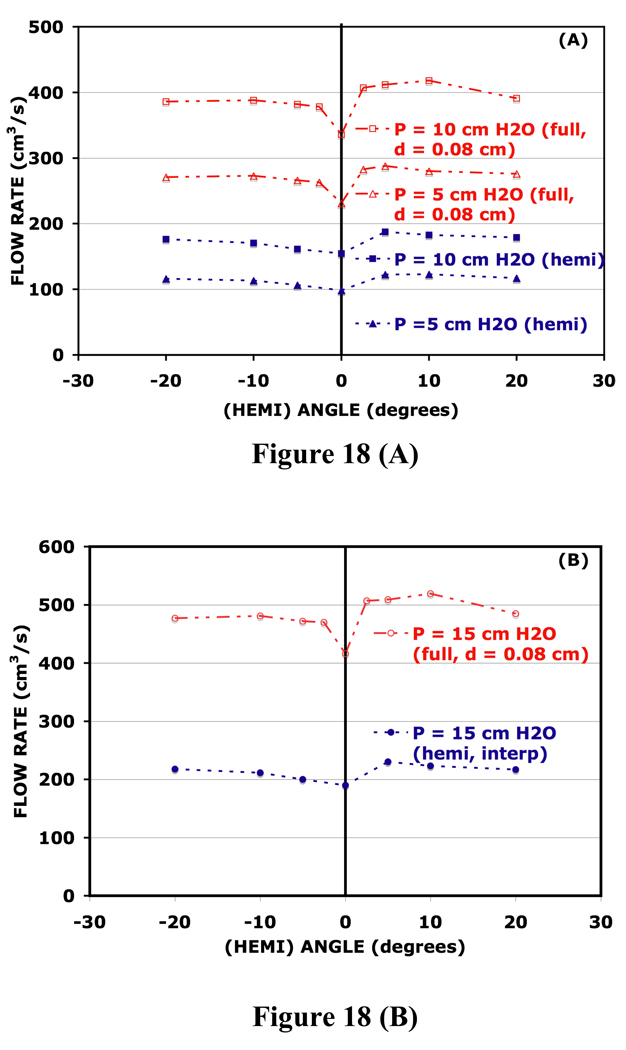
Because none of the differences in Table I is too large, the entries there were averaged before displaying their angle dependence in Fig. 18(A) for the P = 5 and 10 cm H2O transglottal pressures, where the hemilaryngeal results are compared with flow rates for the full larynx at d = 0.08 cm. The hemilaryngeal flow rates for the uniform glottis are smallest for each of the transglottal pressures, which is expected because more of the glottal walls are close to each other for the uniform case than for the other angles. Proximity of the walls leads to larger viscous shear forces that retard the flow more effectively. Each of the hemilaryngeal curves in Fig. 18(A) has a maximum flow rate between the diverging angles of 5° and 10°, a behavior consistent with that of an efficient diffuser15. The 20° convergent hemilaryngeal flow rates are slightly larger than those for the 10° convergent case, and the 20° divergent hemilaryngeal flow rates are slightly smaller than those for 10° divergent, another general manifestation of the asymmetry between converging and diverging angles.
FIG. 18.
Comparison of the angle dependence of the hemilaryngeal flow rates (A) for P = 5 and 10 cm H2O and (B) for P = 15 cm H2O with those of the full larynx at d = 0.08 cm. The included angle of the full laryngeal flow rates is divided by a factor of 2 for display purposes. Positive angles are divergent, negative angles are convergent.
The hemilaryngeal flow rates of Fig. 18(A) tend to be lower than those for the symmetric larynx with d = 0.04 cm and at the same angle34. For example, the symmetric flow rates at 5 cm H2O transglottal pressure for a convergent angle of 10° and for a divergent angle of 20° are 3.3% and 7.7% higher, respectively, than the corresponding hemilaryngeal flow rates. These differences tend to become less as the transglottal pressure increases to 10 cm H2O; at the same angles the symmetric flow rates are 2.1% and 4.4% higher, respectively.
In their study of the connections between the physiological measures of canine hemilaryngeal phonation and full-laryngeal phonation, Jiang and Titze1 found that the average airflows for the hemilarynx were about half of those for the larynx. In Fig. 12 of their paper, Jiang and Titze presented average glottal flow rates for a range of subglottal pressures between 0.8 kPa (8.2 cm H2O) and 4.0 kPa (40.8 cm H2O). In order to compare our hemilaryngeal flow data with laryngeal flow data34, it is necessary to make some assumption about the relationship of the glottal diameters and the glottal angles in the two cases. The simplest assumptions are that the glottal diameter and the glottal angle for normal laryngeal phonation are twice as large as those quantities for hemilaryngeal phonation. Thus, in Fig. 18 we compare hemilaryngeal flow rates for d = 0.04 cm with full laryngeal flow rates for d = 0.08 cm. The full-larynx included angles in Fig. 4(D) of Fulcher et al.34 were divided by a factor of 2. To obtain the flow rates for the hemilarynx for 15 cm H2O, it was necessary to interpolate between the flow rates for the 10 and 20 cm H2O conditions of Table I. The full laryngeal flow curves of Fig. 18 have shapes that are similar to the hemilaryngeal flow curves, although the minima of the former set are deeper. To compare the magnitudes in general, the flow rates for each pressure in Fig. 18 were averaged over the angles. The flow values for the angle averages for the full laryngeal curves of Fig. 18 are 2.37, 2.24, and 2.26 times, respectively, as large as the hemilaryngeal flows for the angle averages for the 5, 10, and 15 cm H2O pressures. These numbers are close enough to 2 to be consistent with Jiang and Titze’s observation1 of the flow rates for laryngeal and hemilaryngeal phonation, when one considers the scatter of the canine data presented in Fig. 12 of their paper.
VIII. SUMMARY
The Plexiglas model M5 was used to allow for asymmetric configurations of the glottal walls appropriate for a hemilarynx with one fixed vertical glottal wall. Pressure distributions and glottal flow rates were collected for transglottal pressures of 3, 5, 10, 20, and 40 cm H2O, and 7 angles (uniform or 0°, converging angles of 5, 10, and 20°, and diverging angles of 5, 10, and 20°) for a minimal glottal diameter of 0.04 cm. The uniform case was the only symmetric case. The flow jet emerging from the glottal exit was bistable in most cases, meaning that the flow could exit the glottis toward the right or toward the left. The 20° convergent angle exhibited no bistablility. At P = 3 cm H2O, the 20° divergent flow was also not bistable.
For converging angles most of the intraglottal pressures are higher than those in the supraglottal region, especially near the glottal entrance. Since the pressures near the glottal exit tend to be lower than those in the supraglottal region, the pressure distributions for converging angles are conducive to the excitation of medial surface waves, in addition to their tendency to push the vocal folds away from the midline. The pressure distributions for the uniform glottis also have these properties, although the pressure drops within the glottis are not as large as those for the converging angles. For diverging angles, the glottal shapes create a partial vacuum within the glottis (that is, pressure lower than in the supraglottal region) that contributes to the kinetic energy of glottal fold motion by pulling the vocal folds toward the midline. A comparison of hemilaryngeal pressure distributions at a transglottal pressure of 10 cm H2O with those for the symmetric glottis (Fig. 14) at the same transglottal pressure (for diameters of 0.04 cm and 0.08 cm) reveals that the pressure variations with angle for hemilaryngeal and laryngeal phonation are similar. Thus, one would expect the pushing and pulling forces for hemilaryngeal phonation to produce the same kind of oscillations as the pushing and pulling forces for (full) laryngeal phonation, in accord with Jiang and Titze’s hypothesis of functional similarity between hemilaryngeal phonation and full laryngeal phonation1.
Numerical calculations based on the laminar flow code FLUENT were also presented. The agreement of the calculated results with the measured pressures for the pressure distributions for the uniform case was excellent. The accuracy of these calculations was measured with a subglottal error index, which is typically a few percent. The accuracy of the FLUENT calculations within the glottis was measured with an intraglottal error index, which was small in most cases. For the 20° converging case, FLUENT failed to record a deep minimum near the glottal exit that was observed at all of the transglottal pressures [Fig. 8(B)]. FLUENT also failed to reproduce an abrupt change in the supraglottal pressure between taps 13 and 14 that was observed for the 10° diverging angle. It is suggested that both of these discrepancies are a consequence of flow structures beyond the scope of the FLUENT calculations.
It was observed that the pressure distributions for a given geometry have similar shapes across a wide range of transglottal pressures. This motivates the introduction of a dimensionless pressure at each angle (for d = 0.04 cm) defined by dividing the pressures at each tap by the transglottal pressure for the distribution. Dimensionless pressure distributions were presented for the uniform case, a representative converging angle, and a representative diverging angle, and the individual data points were seen to almost coincide in many cases. This behavior is referred to as consistent pressure scaling. Pressure scaling was seen to provide an excellent overlap for all the converging glottis cases, and a good overlap for the uniform glottis, where the variations averaged 1.7%, but the differences may be somewhat larger within the glottis. Pressure scaling provided a reasonable overlap of the pressure distributions for the 5° diverging glottis, and the variations for the 10° diverging glottis became as large as 5.9%. For the 20° diverging glottis the variations averaged about the same as in the 10° case, but they were distributed differently within the glottis.
The angle dependence of the glottal flows was also presented. For each pressure the flow rate had a minimum when the glottis was uniform and a maximum for divergent angles between 5 and 10°. Comparison of the observed flow rates (d = 0.04 cm) with data collected for the symmetric glottis at d = 0.08 cm suggests that one should expect a difference of a factor of approximately two when comparing hemilaryngeal and laryngeal phonation, which is consistent with the results Jiang and Titze1 obtained in their studies with canine larynges.
In general, then, (a) the hemilarynx model with a vertical fixed side (for the restricted condition of one minimal glottal diameter of 0.04 cm) appears to provide pressure conditions for relatively normal oscillation of the healthy vocal fold, intraglottal pressures nearly equal to the full larynx, and flows approximately half that of the full larynx of twice the minimal diameter, suggesting functional similarity with the full larynx; (b) typically bistable flow from the glottis; and (c) relatively successful pressure scaling of the pressure distributions, with modification required for pressures within diverging glottal shapes.
ACKNOWLEDGEMENTS
This work was supported by the National Institutes of Health grant number R01 DC03577. We gratefully acknowledge useful conversations with Byron Erath and Marco Nardone. This paper is presented in memory of Dr. Kenneth de Witt, a great friend and valued colleague.
LIST OF ABBREVIATIONS
- VW
vertical wall
- SW
slanted wall
- FW
flow wall (side of tunnel to which flow is directed)
- NFW
nonflow wall (side of tunnel to which flow is not directed)
- ESUB
subglottal error index, a measure of how well FLUENT values match measured values for taps 1–6
- EINT
intraglottal error index, a measure of how well FLUENT values match measured values for taps 6–13
Footnotes
Publisher's Disclaimer: This is a PDF file of an unedited manuscript that has been accepted for publication. As a service to our customers we are providing this early version of the manuscript. The manuscript will undergo copyediting, typesetting, and review of the resulting proof before it is published in its final citable form. Please note that during the production process errors may be discovered which could affect the content, and all legal disclaimers that apply to the journal pertain.
REFERENCES
- 1.Jiang J, Titze I. A methodological study of hemilaryngeal phonation. Laryngoscope. 1993;103:872–882. doi: 10.1288/00005537-199308000-00008. [DOI] [PubMed] [Google Scholar]
- 2.Alonso J. Conservative surgery of cancer of the larynx. Trans. Am. Acad. Opthal, Otolaryngol. 1947;51:633. [PubMed] [Google Scholar]
- 3.Bailey B, Biller H. Surgery of the Larynx. Philadelphia: Saunders; 1985. [Google Scholar]
- 4.Jiang J, Titze I. Measurements of vocal fold intraglottal pressure and impact stress. J. Voice. 1994;8:132–144. doi: 10.1016/s0892-1997(05)80305-4. [DOI] [PubMed] [Google Scholar]
- 5.Arnold G. Vocal nodules and polyps: laryngeal tissue reaction to habitual hyperkinetic dysphonia. J. Speech Hear. Disord. 1962;27:205–217. doi: 10.1044/jshd.2703.205. [DOI] [PubMed] [Google Scholar]
- 6.Nagata K, Kurita S, Yasumoto S, Maeda T, Kawasaki H, Hirano M. Vocal fold polyps and nodules, a 10 year review of 1156 patients. Auris Nasus Larynx. 1983;(suppl 10):S27–S35. doi: 10.1016/s0385-8146(83)80003-0. [DOI] [PubMed] [Google Scholar]
- 7.Jiang J, Shah A, Hess M, Verdolini K, Banzali F, Hanson D. Vocal fold impact stress analysis. J. Voice. 2001;15:4–14. doi: 10.1016/S0892-1997(01)00002-9. [DOI] [PubMed] [Google Scholar]
- 8.Alipour F, Scherer R, Finnegan E. Pressure-flow relationships as a function of adduction. J. Voice. 1997;11:187–194. doi: 10.1016/s0892-1997(97)80077-x. [DOI] [PubMed] [Google Scholar]
- 9.Alipour F, Scherer R. Dynamic glottal pressures in an excised hemilarynx model. J. Voice. 2000;14:443–454. doi: 10.1016/s0892-1997(00)80002-8. [DOI] [PubMed] [Google Scholar]
- 10.Scherer R, Shinwari D, DeWitt K, Zhang C, Kucinschi B, Afjeh A. Intraglottal pressure profiles for a symmetric and oblique glottis with a divergence angle of 10 degrees. J. Acoust. Soc. Am. 2001;109:1616–1630. doi: 10.1121/1.1333420. [DOI] [PubMed] [Google Scholar]
- 11.Scherer R, Shinwari D, DeWitt K, Zhang C, Kucinschi B, Afjeh A. Intraglottal pressure distributions for a symmetric and oblique glottis with a uniform duct (L) J. Acoust. Soc. Am. 2002;112:1253–1256. doi: 10.1121/1.1504849. [DOI] [PubMed] [Google Scholar]
- 12.Shinwari D, Scherer R, DeWitt K, Afjeh A. Flow visualization and pressure distributions in a model of the glottis with a symmetric and oblique divergent angle of 10 degrees. J. Acoust. Soc. Am. 2003;113:487–497. doi: 10.1121/1.1526468. [DOI] [PubMed] [Google Scholar]
- 13.Alipour F, Scherer R. Pressure and velocity profiles in a static mechanical hemilarynx model. J. Acoust. Soc. Am. 2002;112:2996–3003. doi: 10.1121/1.1519540. [DOI] [PubMed] [Google Scholar]
- 14.The FW (flow wall) is the glottal wall (right or left) that lies on the side to which the flow jet heads after leaving the glottal exit. The NFW (nonflow wall) is the opposite side. Since the jet has separated from the NFW side upstream from its separation in the glottis from the FW side, a stall is expected on the NFW side, as described by Kline15
- 15.Kline S. On the nature of the stall. J. Basic Eng. Series D. 1959;81:302–322. [Google Scholar]
- 16.Thapa P. Pressure distributions in a static hemilarynx model. Bowling Green, OH: Bowling Green State University; 2005. [master’s thesis] [Google Scholar]
- 17.Zemlim W. Speech and Hearing Science. 4th edition. Boston: Allyn and Bacon; 1998. pp. 144–160. [Google Scholar]
- 18.Ishizaka K, Flanagan J. Synthesis of voiced sounds from a two-mass model of the vocal cords. Bell Syst. Tech. J. 1972;51:1233–1267. [Google Scholar]
- 19.Titze I. Current topics in voice production mechanisms. Acta Otolaryngol. 1993;113:421–427. doi: 10.3109/00016489309135838. (Stockh.) [DOI] [PubMed] [Google Scholar]
- 20.Bo Y. A numerical study of the fluid physics in an oblique static hemilarynx model. Toledo, OH: University of Toledo; 2006. [master’s thesis] [Google Scholar]
- 21.Taylor J. An Introduction to Error Analysis. Mill Valley, CA: University Science Books; 1982. [Google Scholar]
- 22.It is worth noting that these small differences are visible near tap 11 of Fig. 2 of Scherer et al.11, although they were not discussed, since the focus of that paper was the substantially larger differences between a uniform symmetric and a uniform oblique glottis.
- 23.The behavior of the 40 cm H2O case differed from that of the lower pressures in that the largest difference for the FW and the NFW distributions (3.6%) occurred at tap (16), which is farthest downstream. This was most likely an artifact of the location of tap 16, in that this tap may not have been sufficiently downstream to be removed from local effects of the flow structures near the end of the wind tunnel for large rates of flow.
- 24.Kucinschi B, Scherer R, De Witt K, Ng T. Flow visualization of air moving through a model of the larynx. J. Biomech. Eng. 2006;128:380–390. doi: 10.1115/1.2187042. [DOI] [PubMed] [Google Scholar]
- 25.Khosla S, Murugappan S, Raju R, Gutmark E. Aerodynamics at the glottal exit using particle image velocimetry method in a canine larynx. J. Acoust. Soc. Am. 2007;121:3137. [Google Scholar]
- 26.Gauffin J, Binh N, Ananthapadmanabha T, Fant G. Glottal geometry and volume velocity waveform. In: Bless D, Abbs J, editors. Vocal Fold Physiology: Contemporary Research and Clinical Issues. San Diego: College-Hill Press; 1983. pp. 194–201. [Google Scholar]
- 27.Titze I. The physics of small amplitude oscillation of the vocal folds. J. Acoust. Soc. Am. 1988;83:1536–1552. doi: 10.1121/1.395910. [DOI] [PubMed] [Google Scholar]
- 28.Fulcher L, Scherer R, Melnykov A, Gateva G, Limes M. Negative Coulomb damping, limit cycles, and self-oscillation of the vocal folds. Am. J. Phys. 2006;74:386–394. [Google Scholar]
- 29.The curves in each of the figures showing FLUENT distributions are spline fits to the FLUENT results calculated at each of the pressure taps.
- 30.Rubin J, Scherer R. Van De Water Thieme, editor. Basics of Voice Production. Basic Science Review for Otolaryngology. 2005:524–535. [Google Scholar]
- 31.Scherer R. unpublished data. [Google Scholar]
- 32.Street R, Watters G, Vennard J. Elementary Fluid Mechanics. 7th edition. 1995. pp. 619–620. [Google Scholar]
- 33.Thus, tap 6 of Fig. 4 of Alipour and Scherer (on the rounded side of their hemilarynx) occurs at an axial distance of 0.136 cm, near the location of tap 5 of Fig. 3(A) (this paper), and tap 9 of Fig. 4 of Alipour and Scherer occurs at 0.463 cm, near the location of tap 12 of Fig. 3(A). These assignments should provide a reasonable match to the locations of the rounded surfaces near the glottal entrance and the glottal exit for the two hemilarynx models.
- 34.Fulcher L, Scherer R, Zhai G, Zhu Z. Analytic representation of volume flow as a function of geometry and pressure in a static physical model of the glottis. J Voice. 2006;20:489–512. doi: 10.1016/j.jvoice.2005.07.006. [DOI] [PubMed] [Google Scholar]


