Mol Med Rep 12:7992–8002, 2015; DOI: 10.3892/mmr.2015.4449
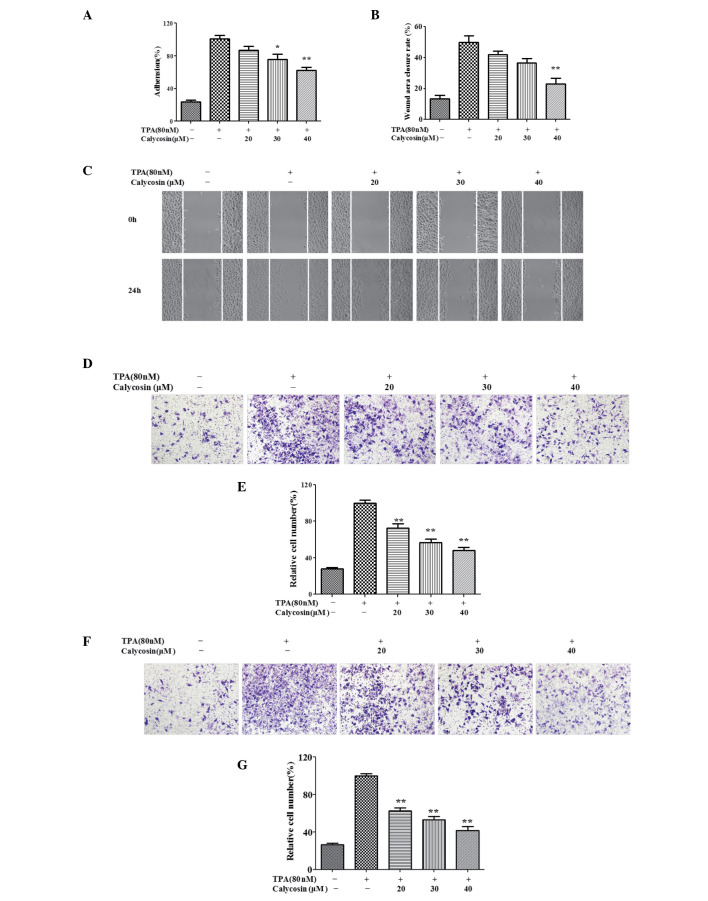
Following the publication of this article, an interested reader drew to our attention an anomaly associated with the presentation of Fig. 2; essentially, an image had been inadvertently selected from the same original photomicrograph to represent Fig. 2D, the centre panel [+80 nM phorbol-12-myristate-13-acetate (TPA), + 20 μM calycosin (Cal)] and Fig. 2F, the second panel from the right (+ 80 nM TPA, + 30 μM Cal). After having re-examined our original data, the panel originally featured in Fig. 2F was identified as having been selected incorrectly for the Figure. A corrected version of Fig. 2 is presented on next page, which features the proper data for Fig. 2F. Fig. 2D and F showed the effect of different concentrations of Cal on the migration and invasive ability of the TPA-treated A549 cells, respectively; Cal was demonstrated to inhibit the migration, and to suppress the invasive ability, of the A549 cells induced by TPA. Therefore, this error did not affect the overall conclusions reported in the present study. We sincerely apologize for this mistake, and thank the reader of our article who drew this matter to our attention. Furthermore, we regret any inconvenience this mistake has caused.
Figure 2.
Effect of Cal on the adhesion, migration and invasion of TPA-induced A549 cells. The A549 cells were treated with 0, 20, 30 or 40 μM Cal in the presence or absence of TPA (80 nM) for 24 h, and were analyzed for (A) adherent ability and (B) wound healing. (C) Migration ability was determined by the closure rate of migrating cells at 24 h, vs. 0 h. (D) A549 cells were inoculated in Transwell chambers treated with Cal for 10 h to assess migration with an IX73 microscope and crystal violet staining (magnification, ×100). (E) Permeated cells, compared with the TPA-induced group. (F) A549 cells were inoculated into Matrigel-coated Transwell chambers and treated with Cal for 24 h to assess cell invasiveness with an IX73 microscope following staining with crystal violet (magnification, x100). (G) Rate of cell invasion through the membrane, compared with the TPA-induced group. The results were obtained from triplicate experiments and are presented the mean ± standard deviation (n=3). *P≤0.05, vs. control; **P≤0.01 vs. control. Cal, calycosin; TPA, phorbol-12-myristate-13-acetate.


