Abstract
Recent in vivo studies have established ultrasmall (< 3 nm) gold nanoparticles coated with glutathione (AuGSH) as a promising platform for applications in nanomedicine. However, systematic in vitro investigations to gain a more fundamental understanding of the particles’ biointeractions are still lacking. Herein we examined the behavior of ultrasmall AuGSH in vitro, focusing on their ability to resist aggregation and adsorption from serum proteins. Despite having net negative charge, AuGSH particles were colloidally stable in biological media and able to resist binding from serum proteins, in agreement with the favorable bioresponses reported for AuGSH in vivo. However, our results revealed disparate behaviors depending on nanoparticle size: particles between 2 and 3 nm in core diameter were found to readily aggregate in biological media, whereas those strictly under 2 nm were exceptionally stable. Molecular dynamics simulations provided microscopic insight into interparticle interactions leading to aggregation and their sensitivity to the solution composition and particle size. These results have important implications, in that seemingly small variations in size can impact the biointeractions of ultrasmall AuGSH, and potentially of other ultrasmall nanoparticles as well.
Keywords: ultrasmall gold nanoparticles, glutathione, protein adsorption, nanoparticle characterization, analytical ultracentrifugation, molecular dynamics simulations
Graphical Abstract
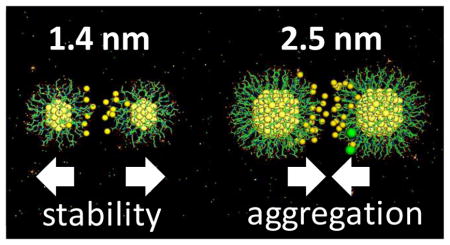
Small size differences can affect the colloidal stability of ultrasmall AuNPs, underscoring the importance of particle uniformity in nanomedicine.
1. INTRODUCTION
Gold nanoparticles (AuNPs) constitute a versatile platform supporting a wide array of therapeutic applications in nanomedicine1–2. AuNPs are typically synthesized with core diameters ranging from 1 to 100 nm. Within this range, a subclass of “ultrasmall” nanoparticles can be approximately defined as those being less than 3 nm in diameter3–4. Recently, several studies have argued that AuNPs in this ultrasmall size regime can present distinct advantages for use in vivo4–17. In particular, ultrasmall AuNPs coated with the natural tripeptide glutathione (GSH) have emerged as an important nanoparticle system, since they have been found to display favorable physiological properties such as renal clearance and tumor accumulation, thus holding promise for use in vivo6, 14–15.
Clearly, the continued development of ultrasmall GSH–coated AuNPs (AuGSH) for potential applications in vivo should greatly benefit from a more fundamental understanding of the particles’ biointeractions. For example, the favorable bioresponses observed for AuGSH in vivo may be somewhat surprising considering the nanoparticles are negatively charged. Indeed, compared to zwitterionic or PEGylated nanoparticles, charged AuNPs are much more prone to nonspecific binding with serum proteins and aggregation in high ionic strength biological fluid18–23.
Herein we probe the biointeractions of ultrasmall AuGSH in vitro, focusing on their ability to resist aggregation and binding from serum proteins. First, we prepare 2-nm diameter AuGSH nanoparticles by producing molecularly defined Au144(p-mercaptobenzoic acid)60 particles (AuMBA) followed by ligand exchange with GSH. We then investigate ultrasmall AuGSH alongside AuMBA, pointing out these particles have shown contrasting behavior in vivo, since the latter are not renal clearable and accumulate in the liver and spleen24. In parallel, we also synthesize differently sized ultrasmall AuGSH nanoparticles (1.4 and 2.5 nm in core diameter) to underscore the effect of small size variations on their biointeractions. Finally, we perform computer simulations to gain atomic–level insight into the effect of size and solution composition on interparticle interactions.
2. MATERIALS AND METHODS
Gold (III) chloride trihydrate (HAuCl4·3H2O; ≥ 99.9%), sodium borohydride (NaBH4; ≥ 98%), ammonium acetate (≥ 98%), glutathione (GSH; ≥ 98%), DMEM cell culture media (#D2906 and #D9785; media formulation can be found at: http://www.sigmaaldrich.com/life-science/cell-culture/learning-center/media-formulations.html), fetal bovine serum (FBS; #F6178), and FBS dialyzed by ultrafiltration against 0.15 M NaCl (dFBS; #F0392) were purchased from Sigma-Aldrich. Para-mercaptobenzoic acid (pMBA, > 95%) was purchased from TCI America.
Nanoparticle synthesis
AuMBA-2.0 was synthesized by first mixing HAuCl4·3H2O with pMBA in a water–methanol mixture followed by reduction of the resulting Au(I)–pMBA compound with NaBH4. This produces highly uniform AuNPs with the defined molecular composition of Au144(pMBA)60. A thorough step–by–step description for the synthesis of Au144(pMBA)60 has been set forth by Ackerson, and the reader is referred to Ackerson’s publications for details25. AuGSH-2.0 was produced by ligand exchange of AuMBA-2.0 with GSH in PBS as previously described by us26. Typically, 6 μmol of GSH was added to 10 nmol AuMBA-2.0 in a reaction scale of 1 mL, leading to a 10:1 feed ratio of GSH relative to pMBA ligands. The reaction was left to proceed for 2–3 h at room temperature. To purify the resulting AuGSH-2.0 nanoparticles, they were induced to aggregate by adding 1 mL ethanol and 200 μL of ammonium acetate (2.0 M). The particles were then precipitated by centrifugation, the supernatant decanted and the pellet washed with water. This precipitation–wash cycle was repeated 3 times. Using H1-NMR, we have shown in our previous work that the ligand exchange reaction with GSH leads to complete exchange of the original pMBA ligands26. AuGSH-1.4 was prepared by reduction of Au(III) with NaBH4 in the presence of GSH. Specifically, 19.7 mg of HAuCl4·3H2O were first added to a 1:1 water:methanol mixture (50 mL) supplemented with 1 mL NaOH (6 M), followed by addition of a 3x molar excess of GSH (46.1 mg). This resultant stock solution was left stirring overnight. In day 2, 0.12 mL of NaBH4 (0.1 M) were added to 2 mL of the stock, amounting to a 6x molar excess of reducing agent relative to Au. Because NaBH4 was supplied as large chunks, it was first ground to a fine powder before dissolving in water (this speeds up dissolution time in water and increases reproducibility25). In day 3, the resulting AuGSH-1.4 nanoparticles were precipitated and washed as described above for AuGSH-2.0. The final pellet was dried in air and resuspended in 100μL PBS. The synthesis of AuGSH-2.5 was identical except that a 1:4 water:methanol ratio and a 12x molar excess of NaBH4 were used.
STEM imaging
High–angle annular dark–field (HAADF) STEM images of AuNPs were recorded in a 300 kV Tecnai TF30 transmission electron microscope (FEI Company) equipped with a Schottky field emission gun and a model–3000 HAADF detector (Fischione Instruments). AuNPs were deposited onto ultrathin carbon support films of 5 nm in thickness. In HAADF STEM imaging of ultrasmall AuNPs, the intensity at each pixel is proportional to the projected mass of Au at that pixel (after background subtraction). We used this proportionality between image intensity and mass to first confirm the number of Au atoms in AuMBA-2.0. For this, we drew small boxes around 600 individual AuMBA-2.0 particles, integrated their image intensities, and subtracted the background signal due to the carbon support film. The average of the net intensities was compared to that obtained from the “standard” ~ 67–Au atom nanoparticle Nanogold®27, yielding ~ 144 atoms for AuMBA-2.0 as expected from the formula Au144(pMBA)6028. The numbers of core Au atoms for the GSH–coated AuNPs were measured in the same way. Next, assuming a core diameter of 2.0 nm for AuMBA-2.029, and also assuming a constant core density, the diameters of the GSH–coated particles were estimated according to the equation
| (1) |
where N is number of core Au atoms.
Analytical ultracentrifugation
Sedimentation velocity experiments were carried out in an Optima XL-I analytical ultracentrifuge equipped with GUI version 5.7 and firmware version 5.06 (Beckman Coulter, Indianapolis) using standard protocols30. 400 μL of sample and equal amount of reference buffer were inserted in an Epon charcoal–filled double–sector centerpiece, cell assemblies mounted in an 8-hole An-50 Ti rotor, and temperature equilibrated to 20 °C while resting in the evacuated rotor chamber for 2–3 h. Samples for characterization of AuNP uniformity were prepared in PBS (2 μM in 400 μL). To characterize AuNP interactions in biological media, either FBS or dFBS was added to AuNP solutions to a final concentration of 10% by volume, and the samples were pre–incubated for 3 h at room temperature prior to measurements. After acceleration to 25,000 or 30,000 rpm, absorbance scans at 520 nm were acquired in ~ 6 min intervals for 4–5 h. Data were analyzed in the software SEDFIT with a c(s) sedimentation coefficient distribution31. Regularization was tailored to the comparison of distributions by taking the c(s) of the control as a Bayesian prior32. The negligible contribution of FBS components to the sedimentation coefficient distributions of AuNPs in serum (in the range of 7–50 S) was confirmed by recording data for 10% dFBS/FBS–PBS under identical experimental conditions as described above (Fig. S1). Sedimentation coefficients are reported under experimental conditions, but to allow direct comparison they were corrected for relative viscosity of FBS relative to PBS as measured through sedimentation of a BSA standard. Figures were created using the freeware GUSSI (C. Brautigam, UTSouthwestern Medical Center). Fig. S2 shows characteristic raw sedimentation velocity profiles and the resulting sedimentation coefficient distributions for ultrasmall AuNPs (shown for AuGSH-1.4).
UV–visible spectroscopy
Absorbance spectra of AuNPs in PBS, in pure cell culture medium and in various serum–containing solutions were acquired in an UV–1800 Shimadzu spectrophotometer. To properly analyze the changes in the UV–vis spectrum of AuNPs in the presence of FBS, the contributions of serum to absorbance were made negligible by using sufficiently high nanoparticle concentrations in solution (typically yielding 1 absorbance unit at 500 nm).
Modeling of aqueous solutions and nanoparticles
Simulations were performed in pure PBS (137 mM NaCl, 2.7 mM KCl, 10 mM Na2HPO4, and 1.8 mM KH2PO4), 50% PBS, 2 mM CaCl2 in PBS, and aqueous CaCl2 at 2, 4 and 8 mM. A pre–equilibrated cell of TIP3P water with a density of 1 g/cm3 was used for the aqueous phase. AuNP cores consisted of spherical crystals of gold atoms in an fcc lattice with parameters of crystalline gold. NPs of 1.4 nm and 2.5 nm in diameter yielded 55 and 250 atoms, in agreement with Eq. 1. Anionic GSH molecules were designed by chemical analogy using the all–atom CHARMM force field33, with charges optimized by quantum chemical calculations at the DFT level using the B3LYP functional and the 6-31G* basis set. A total of 40 (AuNP-1.4) and 100 (AuNP-2.5) GSH molecules were attached to the NP surface one at a time through a series of short dynamics simulations using the SCP continuum solvent model33, starting with random configurations of the molecule being attached. For each simulation harmonic constraints with increasingly larger force constants were applied between the Au atoms and the deprotonated sulfur atoms. This protocol led to equilibrated coating layers of rather homogeneous surface densities, with relaxed GSH conformations and GSH–GSH interactions (Fig. S3).
Molecular dynamics simulations
Simulations were carried out with the all–atom (PARAM22) representation of the CHARMM force field (version c38), in the NPT ensemble at 25 °C and 1 atm in a 95 × 95 × 190 Å cell, using orthorhombic PBC and PME. Bond lengths and angles were constrained (SHAKE algorithm), and a 2-fs time step used in a leapfrog integrator. Additional specifications as reported earlier34–35. Two kinds of NP pairs were considered: one with AuNP-1.4 and the other with AuNP-2.5. Each pair was introduced in water at an initial center–to–center separation r = r0 of 5 nm (AuNP-1.4) and 7 nm (AuNP-2.5) along the longest axis of the simulation cell. Fully dissociated ions and counterions (40 and 100 Na+) were then added randomly in the liquid phase, and water molecules overlapping NP atoms or ions removed. The system was equilibrated for 2 ns, and the NPs then brought together gradually by decreasing r in steps Δr of 0.5 Å; a short equilibration and a productive run of 0.5 ns followed to calculate the mean inter-particle force <F>, as described previously35. This setup resulted in a total simulation length of 40–50 ns, depending on the NPs. Potentials of mean force V were then calculated as V(r) = V(r0) − ∫τ <F(r)> · dr, where τ is the reaction path, here a straight line connecting the NP centers. Details of the calculations, including error estimates, as reported35.
3. RESULTS
3.1. Nanoparticle characterization
We synthesized a set of three ultrasmall GSH–coated AuNPs: AuGSH-1.4, AuGSH-2.0 and AuGSH-2.5. In this nomenclature, the numbers refer to the average particle diameter in nanometers. AuGSH-2.0 was derived by ligand exchange of molecularly defined Au144(pMBA)60 (AuMBA-2.0) with GSH, whereas AuGSH-1.4 and AuGSH-2.5 were prepared by direct synthesis with GSH.
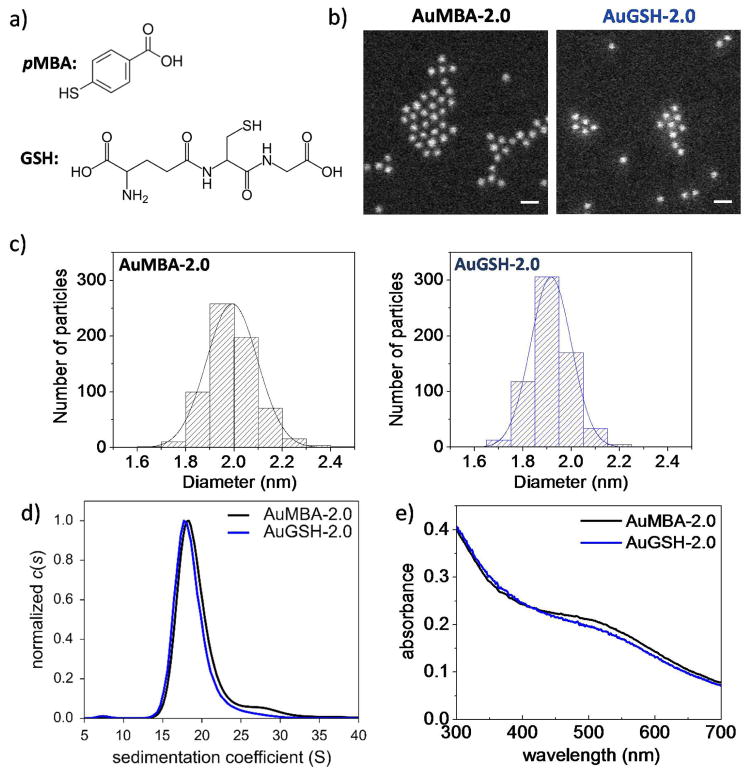
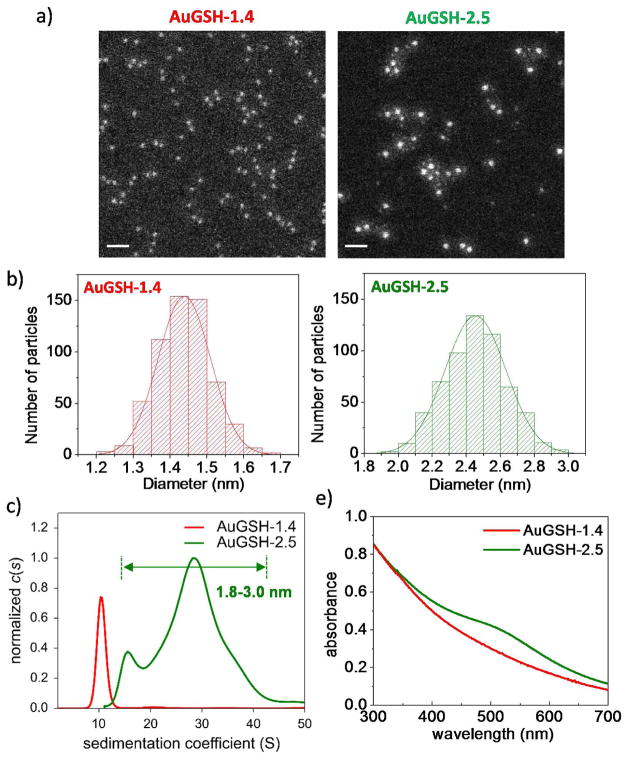
The AuNPs were characterized by annular dark–field scanning transmission electron microscopy (STEM), analytical ultracentrifugation (AUC) and UV–vis spectroscopy (Figs. 1 and 2). The STEM images were analyzed quantitatively yielding numbers of core Au atoms and particle diameters according to Eq. 1 (Table 1; Figs. 1, 2 and S4). Taken together, the STEM, AUC and UV-vis spectroscopy analyses allowed the following set of conclusions to be drawn. (i) The AuMBA-2.0 and AuGSH-2.0 nanoparticles had virtually identical size distributions, therefore only significantly differing in the nature of their passivating layers (Fig. 1). (ii) The smaller AuGSH-1.4 AuNPs were extremely uniform, as evident both from the narrow full width at half maximum (FWHM) of the STEM histogram (0.17 nm) and from the narrow width of their sedimentation coefficient distributions (Fig. 2). An additional STEM image of AuGSH-1.4 nanoparticles is included in Fig. S5 illustrating their high uniformity. We note that random noise in STEM mass measurements (due to shot noise of the electron gun and uncertainties introduced by background subtraction) contributes to the data spread in histograms of particle size; thus, the real FWHM for AuGSH-1.4 is expected to be slightly narrower than 0.17 nm. (iii) The AuGSH-2.5 AuNPs were non–uniform as mainly apparent from the broadness of their sedimentation coefficient distributions (Fig. 2). The majority of particles had a diameter around 2.5 nm as determined by STEM. Their maximum size extended up to approximately 3.0 nm, indicating that even the largest particles in the population could be classified as ultrasmall. We also detected a sub–population of very small AuNPs in the sample of AuGSH-2.5. For simplicity, however, we did not include those in the current analysis since we were only interested in the larger particles (~ 1.8–3.0 nm) present in the preparation.
Figure 1.
Characterization of ultrasmall AuMBA-2.0 and AuGSH-2.0. (a) Structure of ligands. (b) STEM images of AuNPs. Scale bar, 5 nm. (c) Histograms of STEM measurements of nanoparticle diameter. (d) Analytical ultracentrifugation and (e) UV-vis spectroscopy analyses of AuNPs. Collectively, results show that AuMBA-2.0 and AuGSH-2.0 had nearly identical size distributions.
Figure 2.
Characterization of ultrasmall AuGSH-1.4 and AuGSH-2.5. (A) STEM images of AuNPs. Scale bar, 10 nm. (B) Histograms of STEM measurements of nanoparticle diameter. (C) Analytical ultracentrifugation analysis of AuNPs. The high uniformity of AuGSH-1.4 nanoparticles is evident from the narrow width of their sedimentation coefficient distributions. AuGSH-2.5 particles were non-uniform as apparent from the broadness of their sedimentation coefficient distributions. It can be estimated that AuGSH-2.5 particles in the ~ 1.8–3.0 nm size range cover the observed S range from ~ 15 to 40 S. (D) UV-vis spectroscopy analysis of AuNPs. Lack of distinct surface plasmon resonance peak for AuGSH-1.4 is consistent with its smaller size.
Table 1.
Numbers of core Au atoms and core diameters (according to Eq. 1) determined from a quantitative analysis of STEM images of AuNPs.
| number of core gold atoms | core diameter (nm) | |
|---|---|---|
| AuMBA-2.0 | 144 ± 23 | 2.0 ± 0.1 |
| AuGSH-2.0 | 127 ± 17 | 1.9 ± 0.1 |
| AuGSH-1.4 | 54 ± 8 | 1.4 ± 0.1 |
| AuGSH-2.5 | 270 ± 59 | 2.5 ± 0.2 |
3.2. Biointeractions of AuMBA-2.0 and AuGSH-2.0 in biological media
Aggregation assessed by UV–vis spectroscopy
We used UV–vis spectroscopy to assess the colloidal stability of the AuNPs after 24h incubation in pure cell culture medium, FBS supplemented–medium, and FBS–supplemented PBS. Cell culture medium is a complex mixture of various salts and small molecules such as amino acids, vitamins and glucose, whereas FBS additionally contains close to 4000 different proteins spanning 10 orders of magnitude in relative concentration36–38.
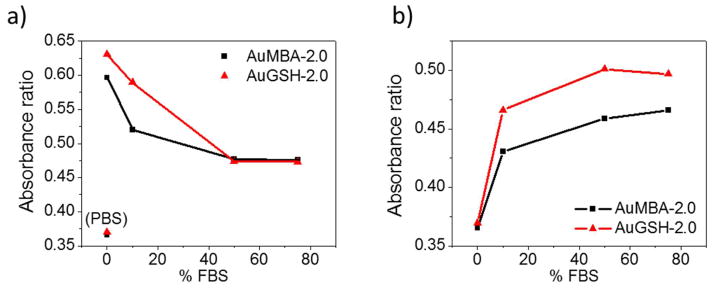
Both AuNPs aggregated rapidly in pure cell culture medium, a typical behavior for charged nanoparticles. Aggregation was reduced with increasing amounts of FBS in media, suggesting that FBS proteins bound the nanoparticles preventing them from aggregating (Fig. 3a).
Figure 3.
Aggregation of AuMBA-2.0 and AuGSH-2.0 in biological media assessed by UV-vis spectroscopy. (a) Aggregation in cell culture medium supplemented with FBS. PBS controls are shown for reference. (b) Aggregation in PBS supplemented with FBS. Aggregation is computed as the ratio between absorbances at 700 and 550 nm.
Next, we evaluated the behavior of the AuNPs in FBS–supplemented PBS. The nanoparticles were found to aggregate with increasing amounts of FBS (Fig. 3b), which at first may seem to contradict the stabilizing effect of FBS on aggregation as seen in Fig. 3a. However, we note that FBS is a complex mixture comprising not only serum proteins but also various salts and other small molecular weight components. Thus, nanoparticle aggregation in FBS–PBS will depend on a competition between stabilizing and destabilizing forces contributed by proteins and small molecules/salts, respectively. To see this more clearly, we evaluated the AuNPs in dialyzed FBS (dFBS), which consisted of serum proteins of molecular weight higher than 10 kDa in 150 mM NaCl. The AuNPs were colloidally stable in 50% dFBS–PBS (Fig. S6; see also AUC analysis, Fig. 5), therefore confirming that aggregation in FBS–PBS was mediated by molecular components < 10 kDa and/or ionic species other than Na+ (likely Ca2+ and Mg2+). As a further test, we incubated the AuNPs in cell culture medium lacking Ca2+ and Mg2+ species. The AuNPs remained stable in solution up to 24h as determined by UV–vis measurements, thus suggesting a role for the divalent cations in driving aggregation (data not shown). Indeed, incubation of the AuNPs in a solution of 2 mM CaCl2 led to rapid particle aggregation and sedimentation (not shown).
Figure 5.
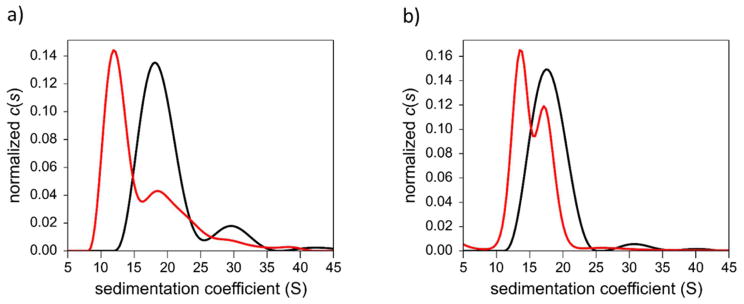
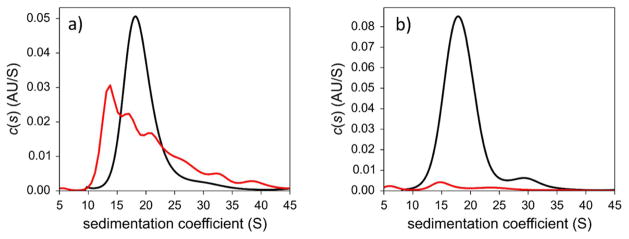
Analytical ultracentrifugation analysis of (a) AuMBA-2.0 and (b) AuGSH-2.0 in PBS supplemented with dialyzed FBS. Serum protein associations with both AuNPs are observed. Black, AuNPs in PBS; red, AuNPs in 10% dFBS-PBS.
Overall, the above results showed that both AuNPs were not colloidally stable in biological fluid, which, on the one hand, was unsurprising considering their negative charge. On the other hand, the aggregation of AuGSH-2.0 contradicts the high rates of renal clearance that have been observed for GSH–coated particles in vivo. We return to this issue below.
Aggregation and serum protein binding assessed by analytical ultracentrifugation
AUC can be used to simultaneously characterize nanoparticle aggregation and nanoparticle–serum protein interactions in PBS supplemented with FBS. Due to the significantly lower density of protein relative to the AuNPs, binding will lead to a reduction of sedimentation velocity due to an increased hydrodynamic friction of the liganded particle. AuNP aggregation, in turn, will cause a large increase in sedimentation velocity with a concomitant reduction in area under the sedimentation coefficient distributions at the sedimentation coefficients of non–aggregated particles.
First, we employed AUC to investigate AuMBA-2.0 and AuGSH-2.0 in 10% FBS–supplemented PBS. Serum proteins bound to AuMBA-2.0, partly shifting the distribution to smaller sedimentation coefficients relative to control (Fig. 4a). The occurrence of larger sedimentation coefficients in the range of 25–45 S, in turn, can be attributed to protein–bound AuNP aggregates likely formed by only a few clustered particles. The data also indicates the absence of bulky aggregates in solution, which we can safely conclude on the basis that the areas under the two traces were almost identical. Increasing the pre–incubation time for AuMBA-2.0 in FBS from 3 to 24 h led only to a 30% reduction in area under the sedimentation coefficient distributions, i.e., only 30% of the nanoparticles formed sufficiently dense aggregates that sedimented beyond 45 S (not shown). In contrast to AuMBA-2.0, extensive aggregation of AuGSH-2.0 in the presence of FBS was observed, since only a very small percentage of nanoparticles were left to sediment in the range of 10–45 S (Fig. 4b).
Figure 4.
Analytical ultracentrifugation analysis of AuMBA-2.0 and AuGSH-2.0 in PBS supplemented with FBS. (a) Serum protein associations with AuMBA-2.0 and some nanoparticle aggregation are observed (see text for details). (b) Extensive precipitation of AuGSH-2.0 is observed. Black, AuNPs in PBS; red, AuNPs in 10% FBS-PBS.
Next, we repeated the experiment using dialyzed FBS (at 10% dFBS–PBS) to minimize interference from the formation of aggregates (Fig. 5). The main peak for AuMBA-2.0 in dFBS, shifted to lower sedimentation coefficients relative to control, represents the formation of AuNP–protein complexes. AuGSH-2.0 in dFBS contained two distinctive peaks, with the leftmost peak corresponding to a protein–bound AuNP fraction and the rightmost peak to a population of pristine nanoparticles. For both AuMBA-2.0 and AuGSH-2.0, the absence of additional peaks at larger sedimentation coefficients suggests that oligomeric nanoparticle–protein structures were not formed.
While the AUC data in Fig. 5 showed that serum proteins can associate both with AuMBA-2.0 and AuGSH-2.0, we presume that protein interactions with AuGSH-2.0 are “weak” and, thus, insufficient to prevent the formation of nanoparticle clusters that sediment in the ultracentrifuge too quickly to be observed (Fig. 4b). On the other hand, serum protein complexation with AuMBA-2.0 is apparently “stronger” leading to more effective colloidal stabilization (Fig. 4a). Sequestration of ions by serum proteins could also diminish the aggregating effect of ions on the AuNPs (see Section 3.4).
We observe again that the aggregation and serum protein interactions demonstrated for AuGSH-2.0 in biological media were unexpected (Figs. 3–5), given the favorable physiological responses that have been reported for AuGSH particles in vivo.
3.3. Biointeractions of differently sized AuGSH in biological media
We prepared ultrasmall AuGSH of slightly different sizes (AuGSH-1.4 and AuGSH-2.5) through reduction with NaBH4 of a Au(III) chloride solution in the presence of GSH. Direct synthesis with GSH was pursued here (instead of ligand exchange from other ligand-stabilized AuNPs) to ensure that the surfaces of the new nanoparticles were as identical as possible.
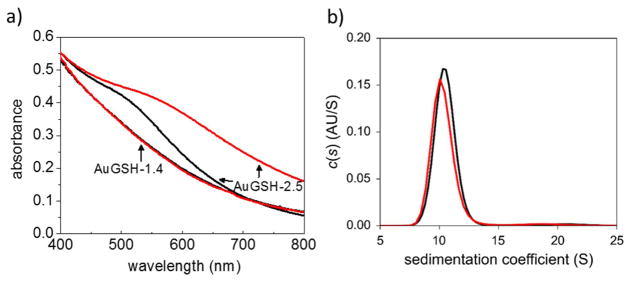
We found that the larger AuGSH-2.5 particles aggregated in pure cell culture medium, whereas the smaller AuGSH-1.4 remained colloidally stable up to 24h as evidenced by UV–vis spectroscopy (Fig. 6a). That such dramatic difference should be observed for such closely sized particles was surprising. Thus, we also pursued AUC as another way to assess the presumed colloidal stability of AuGSH-1.4 in culture medium. The high resolution and sensitivity afforded by this technique would enable detection of the smallest nanoparticle agglomerates down to the size of a dimer. The areas under the solid and dashed traces in Fig. 6b differed by only 6%, thus confirming that AuGSH-1.4 remained dispersed as single nanoparticles in cell culture medium (at 25% in PBS).
Figure 6.
Aggregation of AuGSH-1.4 and AuGSH-2.5 in cell culture medium. (a) No changes are observed in the absorbance spectrum of AuGSH-1.4 in pure culture medium relative to PBS. Extensive aggregation is apparent for AuGSH-2.5 in culture medium. (b) AUC analysis of AuGSH-1.4 confirmed the stability of AuGSH-1.4 in culture medium. Black traces, particles in PBS; red, particles in medium.
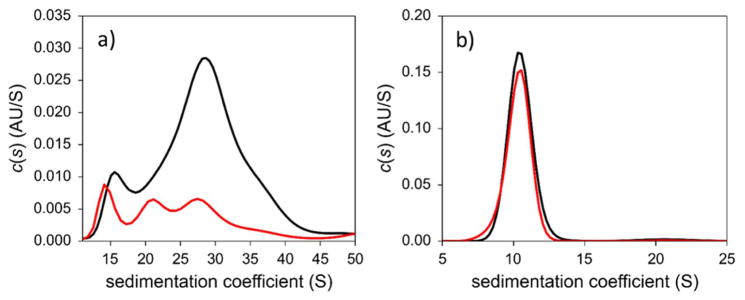
We next utilized AUC to investigate the behavior of the closely sized AuGSH-1.4 and AuGSH-2.5 in 10% FBS–PBS (Fig. 7). Approximately 70% of AuGSH-2.5 formed aggregates that sedimented beyond 50 S. Remarkably, AuGSH-1.4 was resistant against both aggregation and binding from serum proteins, as evidenced by the nearly identical sedimentation coefficient distributions in Fig. 7b (see Fig. S7 for further analysis). We finally characterized the AuNPs by AUC in dialyzed FBS (Fig. S8). As expected, AuGSH-2.5 was now colloidally stable due to the lack of divalent cations in dFBS. We also detected no obvious interactions of serum proteins to both AuGSH-1.4 and AuGSH-2.5. Here we thus observe a different behavior between AuGSH-2.0 and AuGSH-2.5 regarding protein binding, since serum proteins were found to interact with the former but not with the later in dFBS. It can be concluded that different synthetic routes used to prepare AuNPs can lead to differences in their biointeractions. Previous studies have indeed reported the influence of synthesis and purification methods on the biointeractions (mostly toxicity) of nanoparticles39–40.
Figure 7.
Analytical ultracentrifugation analysis of AuGSH-1.4 and AuGSH-2.5 in PBS supplemented with FBS. (a) Extensive aggregation is observed for AuGSH-2.5. (b) No signs of aggregation or serum protein interactions are observed for AuGSH-1.4. Black traces, AuNPs in PBS; red, AuNPs in 10% FBS-PBS.
Most significantly, the above results have revealed an unexpected influence of small size differences on the colloidal stability of ultrasmall AuGSH in biological fluid. We next performed computer simulations to attempt to understand this behavior.
3.4. Computer simulations: Effects of particle size and solution composition on aggregation
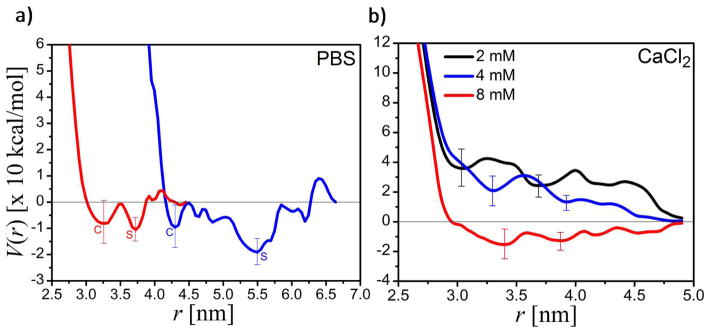
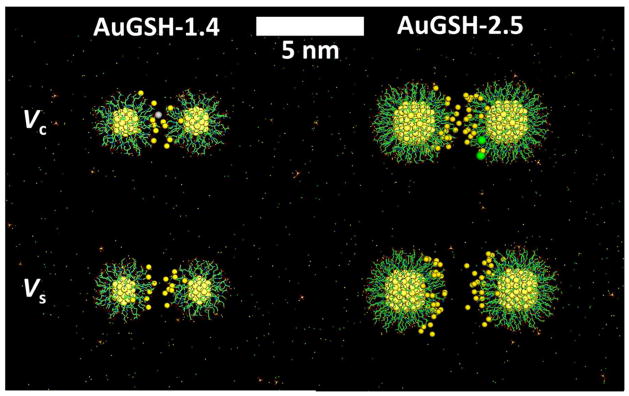
We carried out molecular dynamics simulations to provide microscopic insight into AuGSH interparticle interactions. Fig. 8a shows the interparticle potentials of mean force in pure PBS for both nanoparticle (NP) pairs. The interactions are characterized by two minima, one corresponding to a close–contact (with a potential Vc at a center–to–center separation rc) and the other to a solvent–separated (Vs at rs) configuration (Fig. 9). The existence of two competing minima seems to be a general feature of NP pairs regardless of size, surface chemistry, or solution conditions41–42. Overall, AuGSH-2.5 tend to attract each other more strongly than AuGSH-1.4, but in both cases Vs < Vc, implying that tight clusters do not develop. This may explain the absence of aggregates in PBS suggested by AUC data and also the ease of clearance from the body, as highly hydrated solvent–separated clusters may be more labile and prone to decay by the action of hydrodynamic or mechanical forces. This behavior contrasts with that of other GSH–coated NPs in physiological NaCl solutions, for which previous simulations showed a deep well at rc, with Vc < Vs < 0, and aggregation is thus expected42. In general, the balance between Vc and Vs and their values with respect to the fully dissociated state are quite sensitive to the concentration and type of ions. Fig. 8b shows the potential for AuGSH-1.4 in CaCl2 at 2, 4 and 8 mM; similar for AuGSH-2.5 (not shown). The trend suggests that adding Ca2+ stabilizes the interactions, and aggregation occurs above a critical concentration. Conversely, calcium ions sequestered from the solution are expected to weaken the interactions; this could be the case if Ca2+ form ion clusters43 with other species or if they bind to proteins either directly or as part of the counterion atmosphere. Calcium ion clusters were not observed in our simulations, but they may occur in more complex fluids such as serum. On the other hand, sequestration of critical ions by serum proteins was demonstrated here for albumin in PBS at physiological pH (data not shown): Dynamics simulations revealed the existence of a complex hydration layer about 2–nm deep containing high concentrations of Na+ and Cl−, but also K+, H2PO4− and HPO42, thus depleting the medium of critical components known to mediate the interparticle forces (see below). Therefore, the mere presence of ion–sequestering proteins could affect the interparticle forces even in the absence of direct NP–protein interactions. This could partially explain the effects of FBS–supplemented medium reported in Section 3.2 (Fig. 3a).
Figure 8.
(a) Interparticle potentials of mean force (PMF) of NP pairs in pure PBS at 25 °C: AuGSH-1.4 (red) and AuGSH-2.5 (blue); error bars indicated only at the close-contact (c) and at the solvent-separated (s) minima. AuGSH-1.4: Vc ~ 8 kcal/mol at rc ~ 3.3 nm and Vs ~ 11 kcal/mol at rs ~ 3.8 nm; AuGSH-2.5: Vc ~ 10 kcal/mol at rc ~ 4.3 nm and Vs ~ 19 kcal/mol at rs ~ 5.5 nm. (b) PMF for AuGSH-1.4 NP pairs in aqueous CaCl2 at different salt concentrations, suggesting that aggregation occurs above a critical concentration; similarly for AuGSH-2.5 (not shown) but dependence of Vc with concentration is not monotonic.
Figure 9.
Snapshots obtained from the simulations showing the configuration of NP pairs at rc and rs. Ions at the NP/NP interfacial region shown as van der Waals spheres (gold atoms, light yellow; Na+, dark yellow; K+, gray; Cl−, green); all other atoms/ions and bonds indicated by dots and lines (C, green; N, blue; O, red; S, yellow).
Further insight into the NP–NP interactions can be obtained by decomposing the mean forces into the contributions by the individual species. Ions induce interparticle attraction regardless of their charge or type (Fig. S9a). Positive ions screen the direct interparticle repulsion, and their positions at the NP/NP interface bridge the NPs thus generating an attractive interparticle force. The increased surface area of larger NPs leads to an increase in interfacial cation concentration, which partially explains the observed size–dependent effect on aggregation (Section 3.3). Negative ions tend to be excluded from the interface into the bulk, thus generating an external electrostatic “pressure” that also contribute to the interparticle attraction. The exception is HPO42, which forms clusters with Na+ and are brought towards the negatively charged NP surfaces. Water itself displays a complex behavior, inducing attraction or repulsion depending on the interparticle separation (Fig. S9b). Neither Vc nor Vs can be ascribed to a particular component of the solution, as suggested for Na+ and Cl− ions bridging SO3− or NH3+ surface groups in other NPs42, and observed in the interactions of small polar/charged molecules44; instead, both local minima are the result of a delicate competition of non–specific forces. A similar analysis for aqueous CaCl2 shows that Ca2+ tend to be statistically attracted towards the NP/NP interface, and bind directly to one or more CO2− surface groups, thus inducing strong, localized interparticle forces despite the relatively small salt concentrations. Because of the strong interactions with glutathione, Ca2+ can be internalized into the coating layer (Fig. S10), with evidence of chelation; this was observed in AuGSH-2.5 but not in AuGSH-1.4. Other divalent ions (e.g., Mg2+) are expected to display similar behavior.
It must be noted, however, that the present simulations did not specifically address two important effects that operate in complex aqueous solutions and are known to favor non–specific association of larger colloidal particles over smaller ones, namely, crowding and depletion. Both have traditionally been viewed as entropic in nature, originating in the restriction of volume available to the particles; an enthalpic component has more recently been discussed45. Recent studies have shown that crowding of smaller components of the solution can also have a significant effect and induce association46–47. These forces could then be important in determining the aggregation state of ultrasmall NP in serum and cell culture, especially if Vc and Vs differ by only a few kcal/mol, as shown here for PBS and aqueous CaCl2. Small components of the solution, including ions, could also induce aggregation through depletion forces. For a given medium these forces are stronger for larger NPs48, and in the current case by a factor of ~1.7 in favor of AuGSH-2.5 over AuGSH-1.4. An estimate of the relative importance of crowding and depletion forces in driving NP aggregation and its dependence on NP size requires a realistic, yet computationally tractable representation of the biological medium. This can be accomplished by multiscale Monte Carlo simulations49 and will be reported in a follow up study.
4. Discussion and conclusions
It is instructive to consider the above findings in light of recent in vivo studies on the excretion and biodistribution of pMBA– and GSH–coated ultrasmall AuNPs. For example, Ackerson and co–workers studied the excretion and organ distribution of Au102(pMBA)44, which had very similar composition and size to AuMBA-2.0 (Au144(pMBA)60). They found their AuNPs mostly localized to the liver and spleen, which suggests the particles bound serum proteins and were cleared from circulation by macrophages of the mononuclear phagocyte system24. In another study, Feldheim and co–workers investigated the excretion and biodistribution profile of ultrasmall GSH–coated AuNPs of average size 1.2 ± 0.9 nm6. They found that over 30% of the AuNPs were cleared through the renal system within 1h and over 60% within 8h, which suggests that the nanoparticles did not aggregate or bind serum proteins to any significant degree in vivo. Similar observations have been described by others, in particular by Zheng and co–workers7, 14.
Despite the contrasting bioresponses reported for pMBA– and GSH–coated ultrasmall AuNPs in vivo, our investigations initially revealed little differences in their in vitro biointeractions both in terms of protein binding and particle aggregation. This apparent contradiction between in vitro and in vivo results could be reconciled based on two subsequent findings. First, while AuGSH particles prepared initially by ligand exchange were not fully stealth–like (AuGSH-2.0), those prepared by a direct synthesis protocol (AuGSH-2.5) were resistant against serum protein binding in agreement with published in vivo studies. Second, and most significantly, we found that small differences in size greatly affected the colloidal stability of AuGSH in vitro, with nanoparticles going from colloidally stable to entirely unstable when crossing a size threshold around 2 nm (AuGSH-1.4 vs. AuGSH-2.5). With the help of computer simulations, this intriguing result could be partially understood on the basis that positive ions tend to bridge the AuNPs and thus create attractive interparticle forces. The effective interparticle potential, however, is the result of a critical balance of attractive and repulsive non–specific forces elicited by both the ions and water. Due to the increased number of CO2− groups and ions concentration at the NP/NP interface (Fig. 9), these forces tend to be stronger for larger NPs, especially in the presence of divalent ions, which tend to bind strongly to the GSH layer. At low concentrations of CaCl2 this attractive force results in aggregation of only AuGSH-2.5, and both AuGSH-1.4 and AuGSH-2.5 aggregate above certain concentration threshold. Depletion and crowding effects may also contribute to non–specific NP-NP association, especially between larger NPs, and their relative importance will be reported in a future study.
The synthesis of ultrasmall AuNPs as underlined in this work must be accompanied by the application of proper characterization tools. This is especially important considering that small size differences might impact the biointeractions of the AuNPs as we have shown. In this regard, we point out that conventional transmission electron microscopy (TEM) and dynamic light scattering (DLS), as commonly employed, are typically not sensitive enough to adequately characterize ultrasmall AuNPs. For example, AuNPs of 1.4 nm in core diameter contain only around 50–60 Au atoms. Such nanoparticles yield very weak contrast when imaged under bright-field TEM, thus making it difficult to accurately measure their size and uniformity. In fact, we believe the weak contrast afforded by TEM may lead casual users of the technique to inadvertently select those marginally larger and more easily visible AuNPs (e.g., ~ 2.0) that may occur in a polydisperse population, thus overestimating both the size of the synthesized particles and the uniformity of the preparation. Conversely, ultrasmall AuNPs can be visualized with high contrast under dark–field STEM28, 50. This technique has the additional advantage relative to TEM in that images can be readily quantified to yield numbers of core Au atoms, provided that a AuNP standard of known composition is available. DLS, in turn, does not afford the necessary resolution to probe the size uniformity of ultrasmall nanoparticles. In contrast, AUC is highly sensitive to subtle differences in AuNP size: for example, AuGSH particles of 1.4, 2.0, and 2.5 nm diameters have well separated sedimentation coefficients at approximately 10, 18 and 25 S. Additional examples in the use of AUC to characterize nanoparticles and their conjugates can be found in the literature51–54. Thus, both TEM and DLS should be used with caution to characterize ultrasmall AuNPs, while dark–field STEM and AUC constitute more suitable choices.
In this work we have utilized AUC to evaluate the colloidal stability of ultrasmall AuNPs in biological media. Compared with UV–vis spectroscopy, AUC is much more sensitive for detecting aggregates. It can be estimated that AUC would detect the occurrence of “aggregation” even if only nanoparticle dimers were present at a concentration of at least 10%. It is therefore noteworthy that negatively charged AuGSH nanoparticles < 2 nm were found to be stable in the presence of cell culture medium.
We also employed AUC to evaluate ultrasmall AuNP interactions with serum proteins. We first note that characterization of serum protein adsorption onto larger nanoparticles is often accomplished by first isolating nanoparticle–protein complexes from excess serum through repeated centrifugation and washing steps, followed by application of DLS and zeta potential to measure the changes in nanoparticle size and charge that take place upon protein adsorption55–58. However, the need for complete separation of nanoparticles from excess serum leads inevitably to detachment of weakly bound proteins, thus enabling detection of only “permanently” bound proteins (the so–called hard protein corona)59–61. But most importantly, application of this strategy to ultrasmall AuNPs is impractical because such particles are not heavy enough to be precipitated and isolated by centrifugation62. We point out that AUC is able to partly circumvent these limitations: the fact that AUC experiments are carried out in the presence of 10% FBS, combined with the sensitivity and resolution of the technique, enables detection of transient protein binding onto ultrasmall AuNPs. Notwithstanding these advantages, it is clear that drawing a complete picture on ultrasmall AuNP–serum protein interactions would necessarily entail a more global analysis through the combination of several methodologies. For example, we presently don’t know which serum proteins interact with AuMBA (and which might be associating weakly to some AuGSH) and the order of magnitude of these interactions. Work is ongoing to address these important questions.
In summary, the natural tripeptide glutathione has emerged as a promising ligand for passivating the surface of ultrasmall AuNPs intended for in vivo applications. However, we have found that colloidal stability in biological media can be critically conditioned on AuNP size, which highlights the need for the synthesis of AuNP populations of well–defined sizes and exceptional uniformity. In this regard, we have learned a straightforward synthetic route for the preparation of GSH–coated particles of suitable size (1.4 nm) and narrow size distribution, which might be of interest to other researchers studying ultrasmall nanoparticles in vivo.
Supplementary Material
Acknowledgments
We would like to acknowledge Prof. M.L.V. Oliva for providing access to instrumentation. We acknowledge the Spectroscopy and Calorimetry facility at Brazilian Biosciences National Laboratory (LNBio), CNPEM, Campinas, Brazil, for their support with the analytical ultracentrifuge. This study utilized the high-performance computer capabilities of the Biowulf PC/Linux cluster at the NIH. This work was supported by the São Paulo Research Foundation (FAPESP: 2013/18481-5), São Paulo, Brazil, by the Brazilian National Council for Scientific and Technological Development (CNPq: 476784/2013-1), and by the Intramural Research Programs of the National Institute of Biomedical Imaging and Bioengineering and the Center for Information Technology, National Institutes of Health, Bethesda, U.S.A.
Footnotes
ASSOCIATED CONTENT
Electronic supplementary information (ESI) available.
References
- 1.Rana S, Bajaj A, Mout R, Rotello VM. Adv Drug Deliv Rev. 2011 doi: 10.1016/j.addr.2011.08.006. [DOI] [PMC free article] [PubMed] [Google Scholar]
- 2.Dreaden EC, Mackey MA, Huang X, Kangy B, El-Sayed MA. Chem Soc Rev. 2011;40:3391–3404. doi: 10.1039/c0cs00180e. [DOI] [PMC free article] [PubMed] [Google Scholar]
- 3.Leifert A, Pan-Bartnek Y, Simon U, Jahnen-Dechent W. Nanoscale. 2013;5:6224–6242. doi: 10.1039/c3nr00916e. [DOI] [PubMed] [Google Scholar]
- 4.Tan X, Jin R. Wiley Interdisc Rev: Nanomed Nanobiotech. 2013;5:569–581. doi: 10.1002/wnan.1237. [DOI] [PubMed] [Google Scholar]
- 5.Zhang XD, Wu D, Shen X, Liu PX, Fan FY, Fan SJ. Biomaterials. 2012;33:4628–4638. doi: 10.1016/j.biomaterials.2012.03.020. [DOI] [PubMed] [Google Scholar]
- 6.Simpson CA, Salleng KJ, Cliffel DE, Feldheim DL. Nanomedicine: Nanotechnology, Biology and Medicine. 2013;9:257–263. doi: 10.1016/j.nano.2012.06.002. [DOI] [PubMed] [Google Scholar]
- 7.Zhou C, Long M, Qin Y, Sun X, Zheng J. Angew Chem Int Ed. 2011;50:3168–3172. doi: 10.1002/anie.201007321. [DOI] [PMC free article] [PubMed] [Google Scholar]
- 8.Huang K, Ma H, Liu J, Huo S, Kumar A, Wei T, Zhang X, Jin S, Gan Y, Wang PC, He S, Zhang X, Liang XJ. ACSNano. 2012;6:4483–4493. doi: 10.1021/nn301282m. [DOI] [PMC free article] [PubMed] [Google Scholar]
- 9.Kumar R, Korideck H, Ngwa W, Berbeco RI, Makrigiorgos GM, Sridhar S. Transl Cancer Res. 2013:2. doi: 10.3978/j.issn.2218-676X.2013.07.02. [DOI] [PMC free article] [PubMed] [Google Scholar]
- 10.Alric C, Miladi I, Kryza D, Taleb J, Lux F, Bazzi R, Billotey C, Janier M, Perriat P, Roux S, Tillement O. Nanoscale. 2013;5:5930–5939. doi: 10.1039/c3nr00012e. [DOI] [PubMed] [Google Scholar]
- 11.Luo Z, Zheng K, Xie J. Chem Commun. 2014;50:5143–5155. doi: 10.1039/c3cc47512c. [DOI] [PubMed] [Google Scholar]
- 12.Zhang XD, Yang J, Song SS, Long W, Chen J, Shen X, Wang H, Sun YM, Liu PX, Fan S. Int J Nanomed. 2014;9:2069–2072. doi: 10.2147/IJN.S64301. [DOI] [PMC free article] [PubMed] [Google Scholar]
- 13.Zhang XD, Chen J, Luo Z, Wu D, Shen X, Song SS, Sun YM, Liu PX, Zhao J, Huo S, Fan S, Fan F, Liang XJ, Xie J. Adv Healthcare Mat. 2013;3:133–141. doi: 10.1002/adhm.201300189. [DOI] [PubMed] [Google Scholar]
- 14.Liu J, Yu M, Zhou C, Yang S, Ning X, Zheng J. J Am Chem Soc. 2013;135:4978–4981. doi: 10.1021/ja401612x. [DOI] [PMC free article] [PubMed] [Google Scholar]
- 15.Zhang X-D, Luo Z, Chen J, Song S, Yuan X, Shen X, Wang H, Sun Y, Gao K, Zhang L, Fan S, Leong DT, Guo M, Xie J. Scientific Reports. 2015:5. doi: 10.1038/srep08669. [DOI] [PMC free article] [PubMed] [Google Scholar]
- 16.Shang L, Nienhaus GU. Biophy Rev. 2012;4:313–322. doi: 10.1007/s12551-012-0076-9. [DOI] [PMC free article] [PubMed] [Google Scholar]
- 17.Huo S, Jin S, Ma X, Xue X, Yang K, Kumar A, Wang PC, Zhang J, Hu Z, Liang XJ. ACSNano. 2014;8:5852–5862. doi: 10.1021/nn5008572. [DOI] [PMC free article] [PubMed] [Google Scholar]
- 18.Jiang S, Cao Z. Adv Mater. 2010;22:920–932. doi: 10.1002/adma.200901407. [DOI] [PubMed] [Google Scholar]
- 19.Albanese A, Tang PS, Chan WCW. Annu Rev Biomed Eng. 2012;14:1–16. doi: 10.1146/annurev-bioeng-071811-150124. [DOI] [PubMed] [Google Scholar]
- 20.Tonga GY, Saha K, Rotello VM. Adv Mater. 2014;26:359–370. doi: 10.1002/adma.201303001. [DOI] [PMC free article] [PubMed] [Google Scholar]
- 21.García KP, Zarschler K, Barbaro L, Barreto JA, O’Malley W, Spiccia L, Stephan H, Graham B. Small. 2014;10:2516–2529. doi: 10.1002/smll.201303540. [DOI] [PubMed] [Google Scholar]
- 22.Susumu K, Oh E, Delehanty JB, Blanco-Canosa JB, Johnson BJ, Jain V, Hervey WJ, Algar WR, Boeneman K, Dawson PE, Medintz IL. J Am Chem Soc. 2011;133:9480–9496. doi: 10.1021/ja201919s. [DOI] [PubMed] [Google Scholar]
- 23.Murthy AK, Stover RJ, Hardin WG, Schramm R, Nie GD, Gourisankar S, Truskett TM, Sokolov KV, Johnston KP. J Am Chem Soc. 2013;135:7799–7802. doi: 10.1021/ja400701c. [DOI] [PMC free article] [PubMed] [Google Scholar]
- 24.Wong OA, Hansen RJ, Ni TW, Heinecke CL, Compel WS, Gustafson DL, Ackerson CJ. Nanoscale. 2013;5:10525–10533. doi: 10.1039/c3nr03121g. [DOI] [PMC free article] [PubMed] [Google Scholar]
- 25.Heinecke CL, Ackerson CJ. Methods Mol Biol. 2013;950:293–311. doi: 10.1007/978-1-62703-137-0_17. [DOI] [PubMed] [Google Scholar]
- 26.Sousa AA, Morgan JT, Brown PH, Adams A, Jayasekara MPS, Zhang G, Ackerson CJ, Kruhlak MJ, Leapman RD. Small. 2012;8:2277–2286. doi: 10.1002/smll.201200071. [DOI] [PMC free article] [PubMed] [Google Scholar]
- 27.Hainfeld JF, Furuya FR. J Histochem Cytochem. 1992;40:177–184. doi: 10.1177/40.2.1552162. [DOI] [PubMed] [Google Scholar]
- 28.Sousa AA, Leapman RD. Ultramicroscopy. 2012;123:38–49. doi: 10.1016/j.ultramic.2012.04.005. [DOI] [PMC free article] [PubMed] [Google Scholar]
- 29.Ackerson CJ, Jadzinsky PD, Sexton JZ, Bushnell DA, Kornberg RD. Bioconj Chem. 2010;21:214–218. doi: 10.1021/bc900135d. [DOI] [PMC free article] [PubMed] [Google Scholar]
- 30.Zhao H, Brautigam CA, Ghirlando R, Schuck P. Curr Protoc Protein Sci. 2013;7:20.12.21. doi: 10.1002/0471140864.ps2012s71. [DOI] [PMC free article] [PubMed] [Google Scholar]
- 31.Schuck P. Biophys J. 2000;78:1606–1619. doi: 10.1016/S0006-3495(00)76713-0. [DOI] [PMC free article] [PubMed] [Google Scholar]
- 32.Brown PH, Balbo A, Schuck P. Biomacromolecules. 2007;8:2011–2024. doi: 10.1021/bm070193j. [DOI] [PMC free article] [PubMed] [Google Scholar]
- 33.BRB, et al. J Comput Chem. 2009;30:1545–1614. doi: 10.1002/jcc.21287. [DOI] [PMC free article] [PubMed] [Google Scholar]
- 34.Hassan SA. J Chem Phys. 2011;134:114508. doi: 10.1063/1.3560637. [DOI] [PMC free article] [PubMed] [Google Scholar]
- 35.Hassan SA. J Phys Chem B. 2004;108:19501. [Google Scholar]
- 36.Lynch I, Dawson KA. Nano Today. 2008;3:40–47. [Google Scholar]
- 37.Issaq HJ, Xiao Z, Veenstra TD. Chem Rev. 2007;107:3601–3620. doi: 10.1021/cr068287r. [DOI] [PubMed] [Google Scholar]
- 38.Treuel L, Nienhaus GU. Biophy Rev. 2012;4:137–147. doi: 10.1007/s12551-012-0072-0. [DOI] [PMC free article] [PubMed] [Google Scholar]
- 39.Harper B, Sinche F, Wu RH, Gowrishankar M, Marquart G, Mackiewicz M, Harper SL. Nanomaterials. 2014;4:355–371. doi: 10.3390/nano4020355. [DOI] [PMC free article] [PubMed] [Google Scholar]
- 40.Fadeel B, Garcia-Bennett AE. Adv Drug Deliv Rev. 2010;62:362–374. doi: 10.1016/j.addr.2009.11.008. [DOI] [PubMed] [Google Scholar]
- 41.Villareal OD, Chen LY, Whetten RL, Yacaman MJ. Phys Chem Chem Phys. 2015;17:3680–3688. doi: 10.1039/c4cp05137h. [DOI] [PMC free article] [PubMed] [Google Scholar]
- 42.Alsharif SA, Chen LY, Tlahuice-Flores A, Whetten RL, Yacaman MJ. Phys Chem Chem Phys. 2014;16:3909–3913. doi: 10.1039/c3cp54503b. [DOI] [PMC free article] [PubMed] [Google Scholar]
- 43.Hassan SA. J Phys Chem B. 2008;112:10573–10584. doi: 10.1021/jp801147t. [DOI] [PMC free article] [PubMed] [Google Scholar]
- 44.Hassan SA. J Phys Chem B. 2005;109:21989–21996. doi: 10.1021/jp054042r. [DOI] [PMC free article] [PubMed] [Google Scholar]
- 45.Sapir L, Harries D. Curr Opin Colloid Interface Sci. 2015;20:3–10. [Google Scholar]
- 46.Benton LA, Smith AE, Young GB, Pielak GJ. Biochemistry. 2012;51:9773–9775. doi: 10.1021/bi300909q. [DOI] [PubMed] [Google Scholar]
- 47.Sharp KA. Proc Natl Acad Sci USA. 2015;112:7990–7995. doi: 10.1073/pnas.1505396112. [DOI] [PMC free article] [PubMed] [Google Scholar]
- 48.Yodh AG, Lin KH, Crocker JC, Dinsmore AD, Verma R, Kaplan PD. Phil Trans R Soc Lond A. 2001;359:921–937. [Google Scholar]
- 49.Bhirde AA, Hassan SA, Harr E, Chen X. J Phys Chem C. 2014;118:16199–16208. doi: 10.1021/jp5034068. [DOI] [PMC free article] [PubMed] [Google Scholar]
- 50.Wall JS. J Struct Biol. 1999;127:161–168. doi: 10.1006/jsbi.1999.4148. [DOI] [PubMed] [Google Scholar]
- 51.Carney RP, Kim JY, Qian H, Jin R, Mehenni H, Stellacci F, Bakr OM. Nature Comm. 2011:2. doi: 10.1038/ncomms1338. [DOI] [PMC free article] [PubMed] [Google Scholar]
- 52.Walter J, Löhr K, Karabudak E, Reis W, Mikhael J, Peukert W, Wohlleben W, Cölfen H. ACSNano. 2014;8:8871–8886. doi: 10.1021/nn503205k. [DOI] [PubMed] [Google Scholar]
- 53.Falabella JB, Cho TJ, Ripple DC, Hackley VA, Tarlov MJ. Langmuir. 2010;26:12740–12747. doi: 10.1021/la100761f. [DOI] [PubMed] [Google Scholar]
- 54.Calabretta M, Jamison JA, Falkner JC, Liu Y, Yuhas BD, Matthews KS, Colvin VL. Nano Lett. 2005;5:963–967. doi: 10.1021/nl047926f. [DOI] [PubMed] [Google Scholar]
- 55.Walkey CD, Chan WCW. Chem Soc Rev. 2012;41:2780–2799. doi: 10.1039/c1cs15233e. [DOI] [PubMed] [Google Scholar]
- 56.Casals E, Pfaller T, Duschl A, Oostingh GJ, Puntes V. ACSNano. 2010;4:3623–3632. doi: 10.1021/nn901372t. [DOI] [PubMed] [Google Scholar]
- 57.Maiorano G, Sabella S, Sorce B, Brunetti V, Malvindi MA, Cingolani R, Pompa PP. ACSNano. 2010;4:7481–7491. doi: 10.1021/nn101557e. [DOI] [PubMed] [Google Scholar]
- 58.Moyano DF, Saha K, Prakash G, Yan B, Kong H, Yazdani M, Rotello VM. ACSNano. 2014;8:6748–6755. doi: 10.1021/nn5006478. [DOI] [PMC free article] [PubMed] [Google Scholar]
- 59.Wang J, Jensen UB, Jensen GV, Shipovskov S, Balakrishnan VS, Otzen D, Pedersen JS, Besenbacher F, Sutherland DS. Nano Lett. 2011;11:4985–4991. doi: 10.1021/nl202940k. [DOI] [PubMed] [Google Scholar]
- 60.Lartigue L, Wilhelm C, Servais J, Factor C, Dencausse A, Bacri JC, Luciani N, Gazeau F. ACSNano. 2012;6:2665–2678. doi: 10.1021/nn300060u. [DOI] [PubMed] [Google Scholar]
- 61.Monopoli MP, Wan S, Bombelli FB, Mahon E, Dawson KA. Nano LIFE. 2013:3. [Google Scholar]
- 62.Åkesson A, Cárdenas M, Elia G, Monopoli MP, Dawson KA. RSC Adv. 2012;2:11245–11248. [Google Scholar]
Associated Data
This section collects any data citations, data availability statements, or supplementary materials included in this article.


