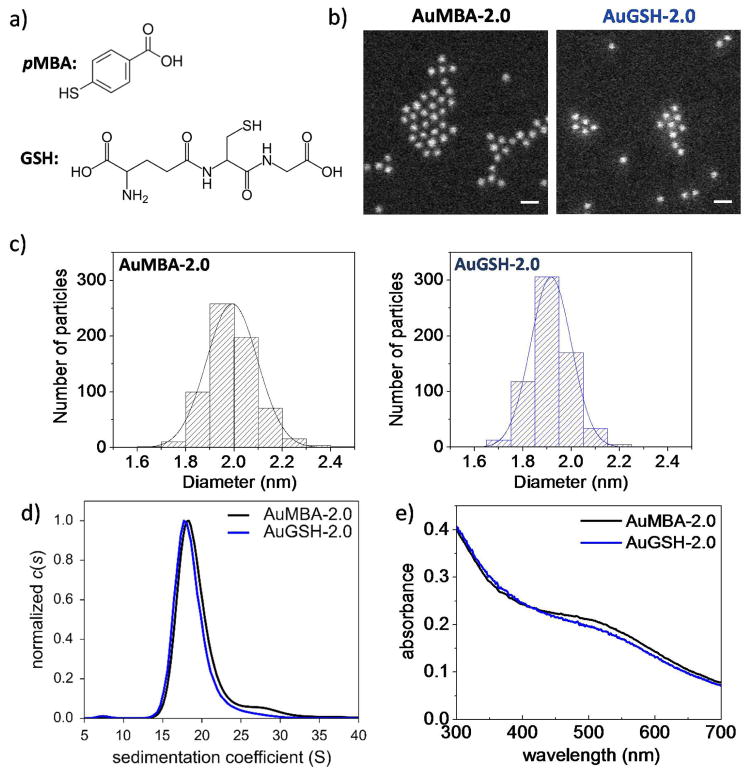
Figure 1.
Characterization of ultrasmall AuMBA-2.0 and AuGSH-2.0. (a) Structure of ligands. (b) STEM images of AuNPs. Scale bar, 5 nm. (c) Histograms of STEM measurements of nanoparticle diameter. (d) Analytical ultracentrifugation and (e) UV-vis spectroscopy analyses of AuNPs. Collectively, results show that AuMBA-2.0 and AuGSH-2.0 had nearly identical size distributions.

