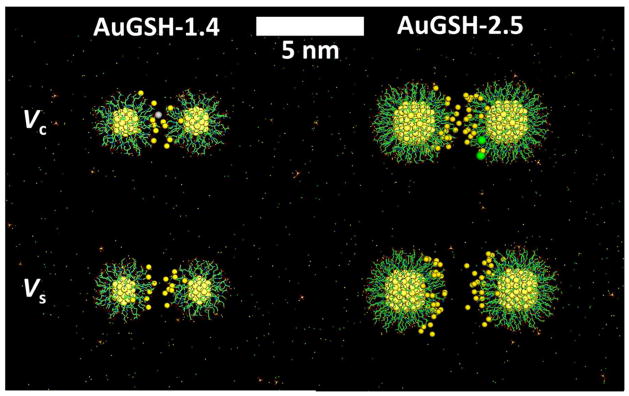
Figure 9.
Snapshots obtained from the simulations showing the configuration of NP pairs at rc and rs. Ions at the NP/NP interfacial region shown as van der Waals spheres (gold atoms, light yellow; Na+, dark yellow; K+, gray; Cl−, green); all other atoms/ions and bonds indicated by dots and lines (C, green; N, blue; O, red; S, yellow).

