Abstract
Although seminiferous tubule maturation in horses begins in the central area of the testis, this process is thought to occur randomly throughout the testis in most mammals. Studies in our laboratory revealed that the establishment of spermatogenesis may not be a synchronous event in the testicular parenchyma of pigs. The objectives of the present study were to evaluate the pattern of seminiferous cord/tubule maturation and the morphological and functional characteristics of testicular somatic cells during postnatal development in three regions of the pig testis: a) near the tunica albuginea (TA); b) in the transitional area between the seminiferous tubules and mediastinum (TR); and c) in the intermediate area (ID) between the TA and TR. Based on the diameter of seminiferous cords/tubules, nucleus size of Sertoli cells and fluid secretion, mainly at 90 and 120 d of age, seminiferous tubule maturation was more advanced in the ID and TR. The mitotic activity of Sertoli cells was higher (P < 0.05) in the TR than the ID and TA at 7 and 120 d. Except for the mitotic index of the Leydig cells, which was lower (P < 0.05) in the ID at 7, 30, and 180 d than in the TA and TR, other Leydig cell ebd points, e.g., individual cell size, nuclear volume, and cytoplasmic volume, were consistently higher (P < 0.05) in the ID, suggesting that steroidogenesis was more active in this region during the period investigated. Overall, we inferred that Leydig cells in the ID may play a pivotal role in postnatal testis development in pigs and this type of cell is likely related to asynchronous testicular parenchyma development, with the transitional area providing the primary zone for growth of seminiferous tubules.
Keywords: Pigs, Postnatal testis development, Sertoli cells, Leydig cells, Peritubular myoid cells
1. Introduction
The Sertoli cell is the first somatic cell type to differentiate in the embryonic gonad and plays a crucial role in testis differentiation and development [1,2]. During this period, the functional interactions between Sertoli cells and other somatic cells in the testis, such as peritubular myoid cells and Leydig cells, are essential to seminiferous cord/tubule integrity, the testis environment, and development of the male reproductive tract [3–6].
In mammals, Sertoli cell proliferation generally starts soon after gonad differentiation and ends before puberty [7–9]. Specifically in pigs, there are two evident peaks of postnatal Sertoli cell proliferation: the first during neonatal life and the second right before puberty, which usually occurs at ~4 mo of age [3]. In contrast to Sertoli cells, there appear to be two distinct Leydig cell populations in most mammalian species: fetal Leydig cells that originate soon after testis differentiation, and adult-type Leydig cells present in the pre-pubertal period [10,11]. In pigs, however, and probably in humans and other primates as well, three phases of Leydig cell development have been described [10,12,13]; two transient phases, including one during the early fetal period and the other during the perinatal period, and a final phase from 3 mo of age through pubertal development and adulthood [3,12,13]. Individual Leydig cell volume in pigs changes remarkably throughout testis development [3,13,14]; these changes were probably related to the higher densities of LH [14,15] and androgen receptors [16].
In most mammalian species, the establishment of spermatogenesis is thought to occur randomly throughout the testis [17]. However, macroscopic differences in color within the testis have been described in prepubertal horses, which exhibit light testicular parenchyma in the center and dark parenchyma in the periphery [18–21]. This development pattern was attributed to the temporal relationship between the reduction in volume density of macrophages or other interstitial cells, and the distinctive pattern of seminiferous tubule development [21]. In a more qualitative investigation on pigs, Ford and Wise [22] recently reported a maturation gradient of Sertoli cells from the mediastinum (central area) toward the tunica albuginea.
In every species, the number of Sertoli cells in the testis determines the ultimate number of sperm produced and thus the overall efficiency of male reproduction [3,23,24]. Particularly for pigs, in which the use of AI is a key tool for increasing reproduction efficiency, understanding the regulation of postnatal testis development is crucial to increasing the total number of sperm per ejaculate. However, studies related to the regulation of mitotic activity of Sertoli cells in pigs are inconclusive [3,25,26], although important advances have recently been made regarding the possible role of estrogens in Sertoli cell proliferation and maturation [27–30]. Based on ongoing studies in our laboratory, we inferred that the establishment of spermatogenesis may not be a synchronous event in the testicular parenchyma in pigs.
The objectives of the present study were to perform a careful morphofunctional investigation of somatic elements in the testis and seminiferous cord/tubule maturation during postnatal testis development in pigs. In that regard, fragments from three different regions of the testicular parenchyma (situated between the mediastinum and tunica albuginea) were evaluated.
2. Materials and methods
2.1. Pigs
Twenty prepubertal (7, 30, 60, 90, and 120 d of age) and four postpubertal (180 d of age) Landrace × Large White crossbred pigs from the Experimental Farm of the Veterinary School of the Federal University of Minas Gerais were orchidectomized. Prior to surgery, all pigs received an intramuscular injection of 1 mg/kg of azaperone (Destress, Des-Far Laboratórios LTDA, São Paulo, SP, Brasil) and were anesthetized with 3 mg/kg zolazepam with tiletamin (Zoletil50; Virbac do Brasil, São Paulo, SP, Brazil). All surgical procedures were performed by a veterinarian and followed approved guidelines for the ethical treatment of animals (Ethics Committee in Animal Experimentation of the Federal University of Minas Gerais—CETEA/UFMG).
The testes were separated from the epididymis, weighed, and cut longitudinally (with a razor blade or sharp knife). Tissue samples were obtained from three regions of the testicular parenchyma: a) near the tunica albuginea (TA); b) from the transitional area between the seminiferous cords/tubules and the mediastinum (rete testis) (TR); and c) from the intermediate area (ID) between TA and TR (Fig. 1). Tissue samples were fixed by immersion in 5% buffered glutaraldehyde, embedded in plastic (glycol methacrylate), and routinely prepared for histological and morphometrical evaluations.
Fig. 1.
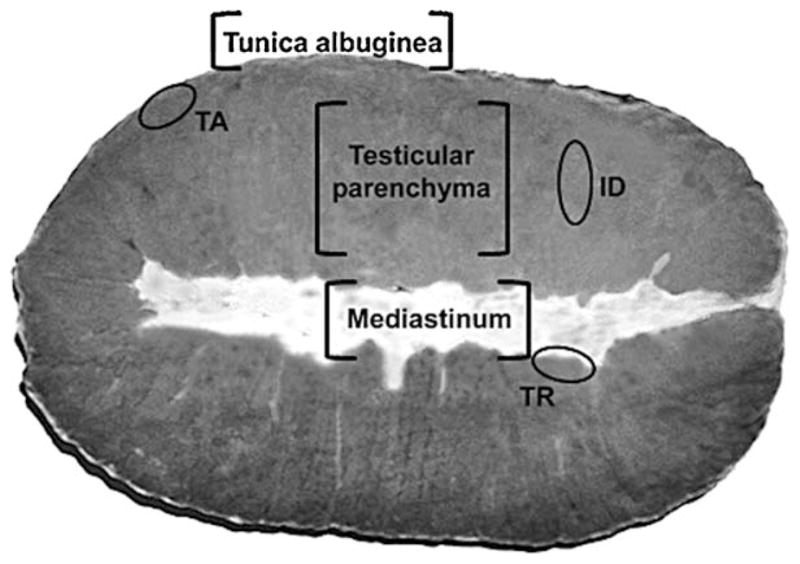
Illustration of the three testicular parenchyma regions in pigs from which the samples were taken; TA, tunica albuginea region; ID, intermediate region; TR, transitional region.
2.2. Testis morphometry
2.2.1. Volume density and diameter of seminiferous cords/tubules
The volume densities of the testicular components in the tree regions of the testicular parenchyma were determined by light microscopy, using a 441-intersection grid placed in the ocular of the microscope. Three fragments from each region were used. Fifteen fields were randomly chosen for each region (6615 points) and scored at 400× magnification. As the volume density of the tunica albuginea and mediastinum in pigs varies depending on age [31], the values for these features used in the present study were 9.5, 10.1, 10.7, 10.2, 8.0, and 5.7% at 7, 30, 60, 90, 120, and 180 d of age, respectively [31]. The diameter of the seminiferous cords/tubules was measured at 400× magnification using an ocular micrometer calibrated with a stage micrometer. For each pig, 30 round (or nearly round) tubule profiles were randomly chosen and measured for each region.
2.2.2. Establishment of spermatogenesis
For the investigation of postnatal germ cell development, 30 cross-sections of seminiferous cords/tubules were evaluated per testis region in each pig at each prepubertal age. The presence of the following germ cell types was assessed: gonocytes, spermatogonia (including type A, intermediate, and type B), early primary spermatocytes (preleptotene to zygotene), intermediate and late primary spermatocytes (pachytene and diplotene), round spermatids, and elongated spermatids. This evaluation was performed at 1000x.
2.2.3. Leydig cell morphometry
Individual Leydig cell volume was obtained from the nucleus volume and the proportion between nucleus and cytoplasm. As the Leydig cell nucleus in pigs is spherical, the nucleus volume was calculated from the mean nuclear diameter. For this purpose, 30 nuclei with an evident nucleolus were measured for each region of the testicular parenchyma investigated. Leydig cell nuclear volume was expressed in μm3 and obtained by the formula 4/3 μR3, in which R = nuclear diameter/2. To calculate the proportion between the nucleus and cytoplasm, a 441-point square grid was placed over the sectioned material at 1000× magnification and 1000 points over Leydig cells were counted for each region.
2.2.4. Volume of Sertoli cell nucleus
The volume of the Sertoli cell nucleus was also expressed in μm3 and obtained by the formula 4/3 μR3, in which R = nuclear diameter/2. However, since the shape of the Sertoli cell nucleus in pigs at the ages evaluated is either ovoid or elongated [3], the mean nuclear diameter was obtained from the measurement of the short and long nucleus axes.
2.2.5. Proliferation index of testicular somatic cells
The proliferation index for Sertoli, Leydig, and peritubular myoid cells was determined as the number of mitotic figures for ≥1000 cells analyzed for each somatic cell type considered per each testicular parenchyma region evaluated. These cells were accurately characterized according to their location, overall morphology, and nucleus shape.
2.3. Statistical analysis
All data are presented as mean ± SEM and were analyzed using ANOVA (with Newman-Keuls test used to locate significant differences). Pearson’s correlation was performed for somatic cell proliferation indices and volume density of the testicular parenchyma components. All analyses were performed using the Statistica 3.11 program for Windows (StatSoft, Inc, Tulsa, OK, USA, 1995; www.statsoftinc.com). The significance level was set at P < 0.05.
3. Results
3.1. Biometric data
As expected, from the first postnatal week to 180 d of age, body weight increased approximately 25-fold (Fig. 2A). A remarkable increase in testis weight also occurred. At 7 d of age, mean testis weight was 0.5 ± 0.1 g, reaching 224 ± 24 g at 180 d (Fig. 2B). The gonadosomatic index (testis mass divided by body weight) increased noticeably from 7 to 30 d, and again from 120 to 180 d (Fig. 2C).
Fig. 2.
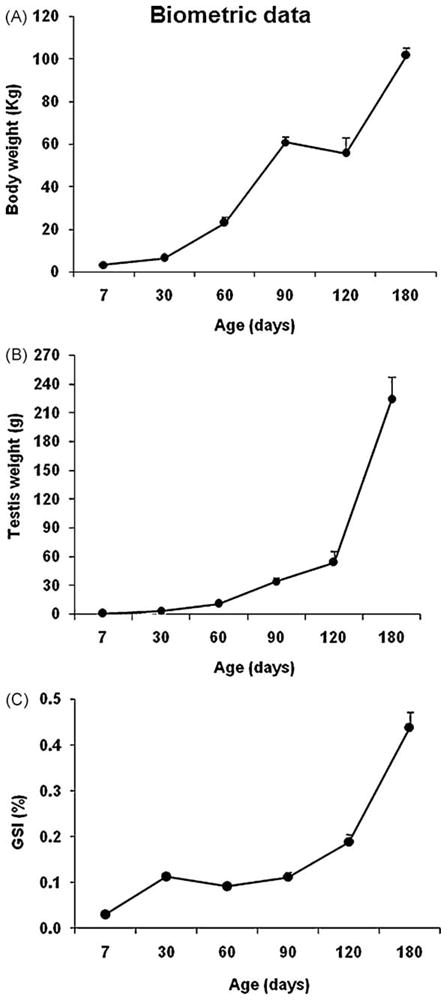
Biometric data (mean ± SEM) during postnatal development in pigs. (A) body weight; (B) testis weight; (C) gonadosomatic index (GSI).
3.2. Diameter of seminiferous cord/tubules and testicular parenchyma volume density
At all ages investigated, the diameter of the seminiferous cords/tubules was similar among the three regions of the testis (Fig. 3). However, in comparison to the TA, the seminiferous cords/tubules in the TR and ID had a tendency toward a greater diameter, especially at 90 and 120 d. The diameter of seminiferous cords/tubules was similar from 7 to 60 d. However, at 90 d of age, an increase of approximately 65% (P < 0.05), 80% (P < 0.05), and 40% in this end point occurred in the TR, ID, and TA, respectively. At 180 d, another remarkable increase (P < 0.05) in tubule diameter occurred in the three regions.
Fig. 3.
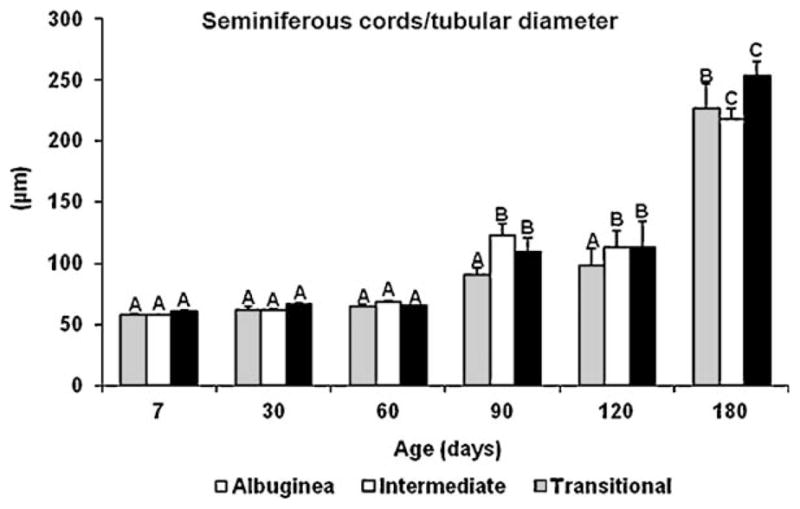
Seminiferous cords and tubular diameter (mean ± SEM) in three regions of the testicular parenchyma during postnatal development in pigs. Different uppercase letters denote significant differences between ages for the same region (P < 0.05).
Volume densities of the testicular parenchyma components investigated at different ages in the three regions are shown (Figs. 4 and 5). The percentage of the tubular compartment ranged from approximately 25 to 40% at 7 d, and was lower (P < 0.05) in the ID (Fig. 4A). A similar trend occurred for the seminiferous epithelium and tunica propria (Fig. 4B, 4C). For all three regions investigated, the tubular compartment reached its nadir when the pigs were 30 d old, particularly in the TR (P < 0.05). From 30 to 180 d of age, tubular compartment volume density increased gradually, reaching nearly 80% of the testicular parenchyma. Although the lowest percentage values generally occurred in the TR, there were no significant differences among the three regions. The same trend was apparent with the seminiferous epithelium. In contrast to the other tubule elements, the volume density of the tunica propria decreased from 60 to 180 d of age and the values found for the ID were significantly higher only at the latter age (Fig. 4C).
Fig. 4.
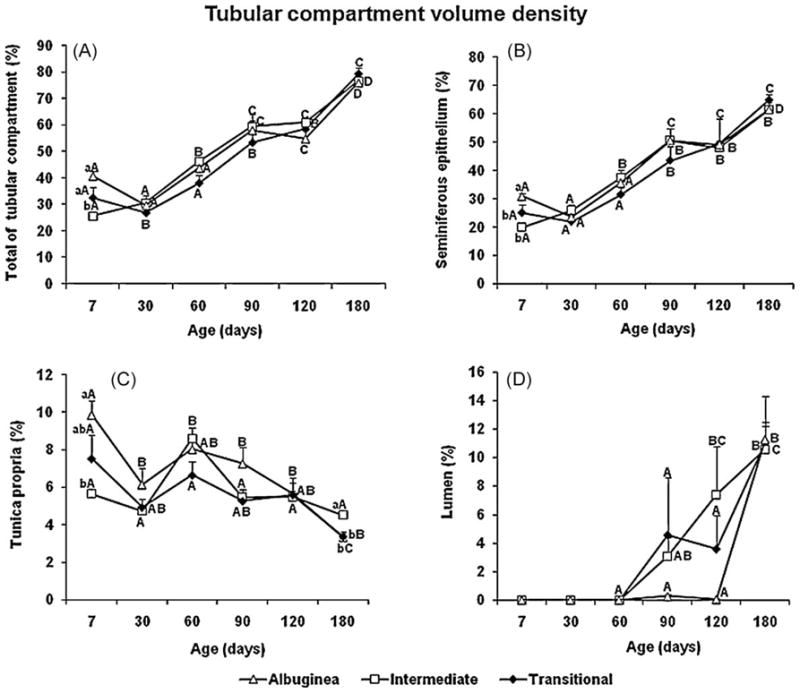
Tubular compartment volume density (mean ± SEM) in three regions of testicular parenchyma during postnatal development in pigs. Different lowercase letters denote significant differences between regions, whereas different uppercase letters denote significant differences between ages for the same region (P < 0.05).
Fig. 5.
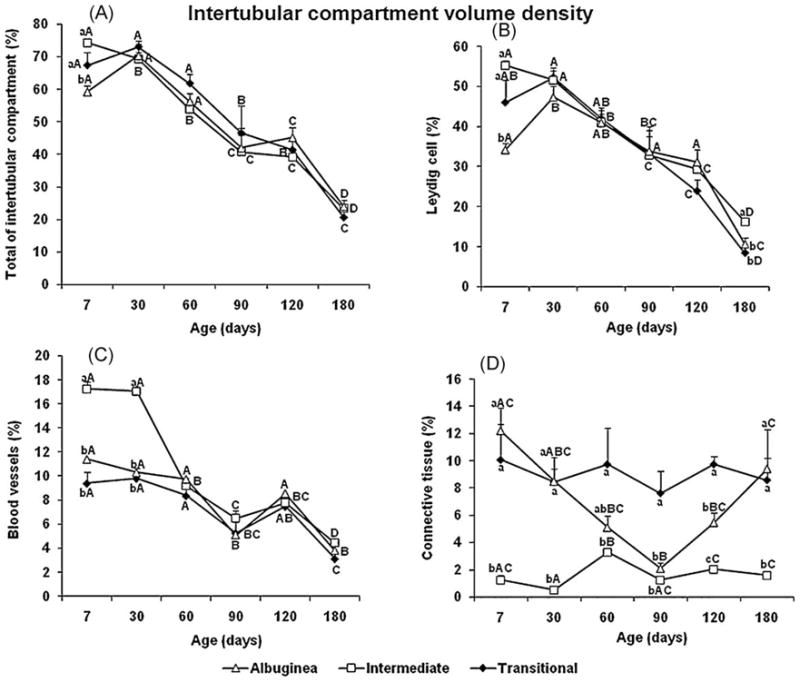
Intertubular compartment volume density (mean ± SEM) in three regions of testicular parenchyma during postnatal development in pigs. Different lowercase letters denote significant differences between regions, whereas different uppercase letters denote significant differences between ages for the same region (P < 0.05).
The tubular lumen was first observed at 90 d of age, with a very high degree of variation among the three regions and even within a single region (Fig. 4D). From 90 to 120 d, a very low degree of lumen formation of the seminiferous tubule occurred in the TA. However, at 180 d, lumen volume density was approximately 10% in all three regions.
As expected, volume density of the intertubular compartment from 7 to 180 d exhibited the opposite trend as the tubular compartment (Fig. 5A). In comparison to the ID and TR, the percentage of this compartment was lower in the TA at 7 d of age. A similar result was also found for Leydig cell volume density, the main component of this compartment (Fig. 5B). Overall, the percentage of this very important steroidogenic somatic cell was the highest at all ages investigated, decreasing approximately 80% during postnatal testis development, with a volume density around 10–15% at 180 d (significantly higher in the ID than in the other regions). Following the same trend as most elements in the interstitium, blood vessel volume density decreased from 7 to 180 d (Fig. 5C). However, blood vessel volume density was much higher in the ID (P < 0.05) during early postnatal testis development (7 to 30 d), whereas no differences among regions were observed for this end point thereafter. Connective tissue volume density in the intertubular compartment was lower (P < 0.05) in the ID at all ages (Fig. 5D).
3.3. Establishment of spermatogenesis
In the three regions studied, only gonocytes were observed at 7 d of age in all seminiferous cords investigated. The percentage of this very immature germ cell type per seminiferous cord cross-section decreased to approximately 60 and 30% at 30 and 60 d, respectively, with no obvious difference among the three regions. At these two ages, type A spermatogonia was the most advanced germ cell type present in the other seminiferous cords. Although primary spermatocytes, particularly pachytene spermatocytes, were the predominant germ cell type present in approximately 70% of the seminiferous cords/tubules at 90 d, elongated spermatids were found only in the ID and TR and few tubules in the TA had round spermatids. This trend was all the more evident at 120 d, when nearly 50% of the tubules had spermatids in both the ID and TR, whereas this figure was only 5% in the TA. There was substantial individual variation regarding the progression of spermatogenesis, particularly at 120 d of age. For example, although spermatogenesis was virtually complete in two pigs, germ cells were still in the meiotic phase in the other two animals. However, the progression of germ cells was always delayed in the TA, whereas germ cells were slightly more advanced in the ID than in the TR.
3.4. Sertoli cells
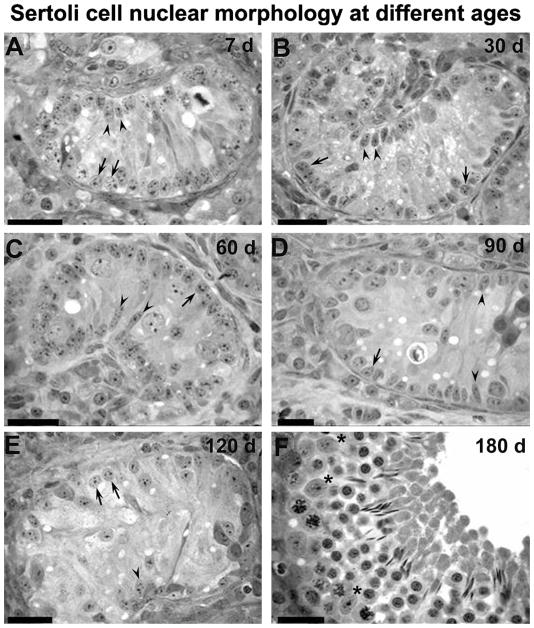
Regardless of the testicular parenchyma region, Sertoli cell nuclei changed their morphology from a typically immature to mature status between the prepubertal and postpubertal periods. Immature Sertoli cells had nuclei that expressed two morphological patterns [round/ovoid and elongated/columnar (Fig. 6A–E)] and spotted heterochromatin, which were observed at all prepubertal ages (7–120 d). Mature Sertoli cell nuclei (Fig. 6F) were elongated/ovoid and contained a prominent nucleolus, but only at the postpubertal age (180 d). Sertoli cell nuclear volume did not change significantly from 7 to 90 d of age, but a remarkable increase (P < 0.05) occurred in this end point from 120 to 180 d in all three regions (Fig. 7). Sertoli cell nuclear volume was lower in the TA in comparison to the ID and TR (P < 0.05), particularly at 30 and 90 d of age.
Fig. 6.
Sertoli cell nuclei at 7 (A), 30 (B), 60 (C), 90 (D), 120 (E) and 180 (F) d of age in pigs. In all prepubertal ages investigated (A to E), immature Sertoli cells exhibited two different nuclear patterns: round/ovoid (arrows) or elongated (arrowheads). After puberty (F), only typically mature Sertoli cell nuclei (*) with evident nucleolus were found. A–E, bar = 30 μm; F, bar = 20 μm.
Fig. 7.
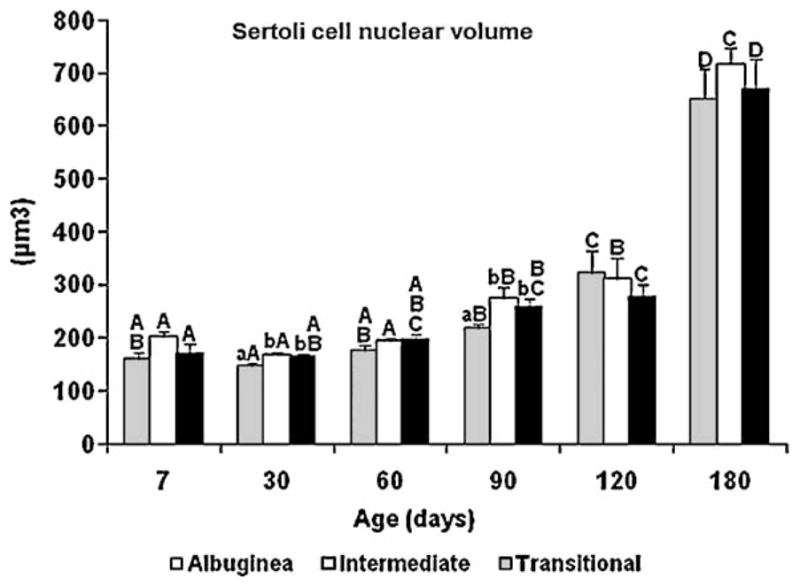
Sertoli cell nuclear volume (mean ± SEM) in three regions of the testicular parenchyma during postnatal development in pigs. Different lowercase letters denote significant differences between regions, whereas different uppercase letters denote significant differences between ages for the same region (P < 0.05).
As fluid secretion/lumen formation and Sertoli cell nucleus size are good markers of Sertoli cell maturation [32], there was a positive correlation (P < 0.05) between Sertoli cell nuclear volume and lumen volume density in two testis regions (ID, r = 0.83; and TR, r = 0.47).
3.5. Leydig cell end points
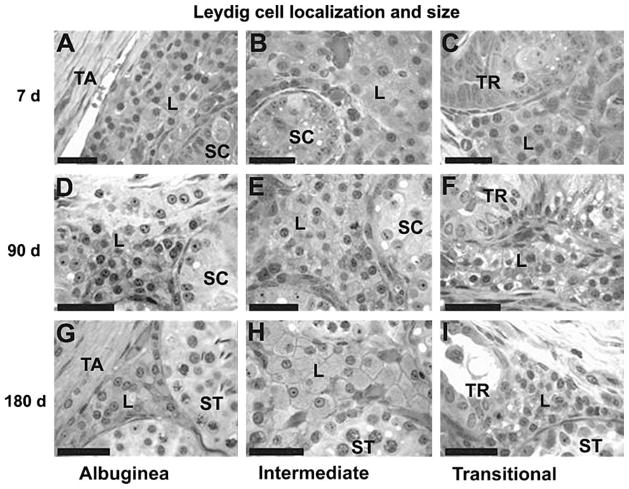
There were striking differences in Leydig cell size during the development of the testis in the three testicular parenchyma regions evaluated (Figs. 8 and 9). Regardless of age, Leydig cells in the ID were always larger (P < 0.05) in comparison to those in the TR and TA (Fig. 9C). The same pattern occurred for Leydig cell nuclear volume and cytoplasmic volume (Fig. 9A–B). In all three testis regions, the morphometric end points of the Leydig cells were highest at 7 d and lowest at 60–90 d (Fig. 9).
Fig. 8.
Leydig cells in different regions of testicular parenchyma in pigs at 7, 90 and 180 days of age. Leydig cells near or under the tunica albuginea (A, D, G) and near the mediastinum (transitional region, C, F, I) are smaller in comparison to those in the intermediate region (B, E, H). TA, tunica albuginea; TR, transitional region; SC, seminiferous cords; ST, seminiferous tubules; L, Leydig cell (bar = 40 μm).
Fig. 9.
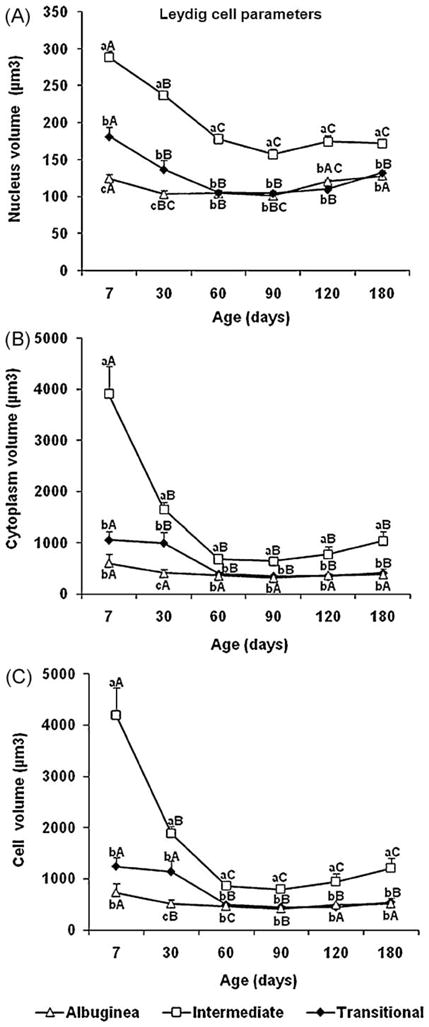
Leydig cell end points (mean ± SEM) in three regions of testicular parenchyma during postnatal development in pigs. Different lowercase letters denote significant differences between regions, whereas different uppercase letters denote significant differences between ages for the same region (P < 0.05).
3.6. Proliferation rate of somatic cells
As Sertoli cells are believed not to divide after puberty, the Sertoli cell proliferation index was assessed from 7 to 120 d of age in the testicular parenchyma regions investigated (Fig. 10A). The proliferation rate of this key somatic cell was higher (~5%; P < 0.05) at 7 d, becoming relatively stable (1–2%) thereafter in the TR, with a similar trend in the TA. In contrast, the mitotic index of Sertoli cells in the ID increased remarkably (~1 to ~6%; P < 0.05) at 60 d, but slowed considerably (~1%) at subsequent ages. The Sertoli cell proliferation rate at 7 d was higher (P < 0.05) in the TR and TA. Although at a lower magnitude, the values obtained for this end point at 120 d were higher (P < 0.05) in the ID and TR than in the TA (Fig. 10A).
Fig. 10.
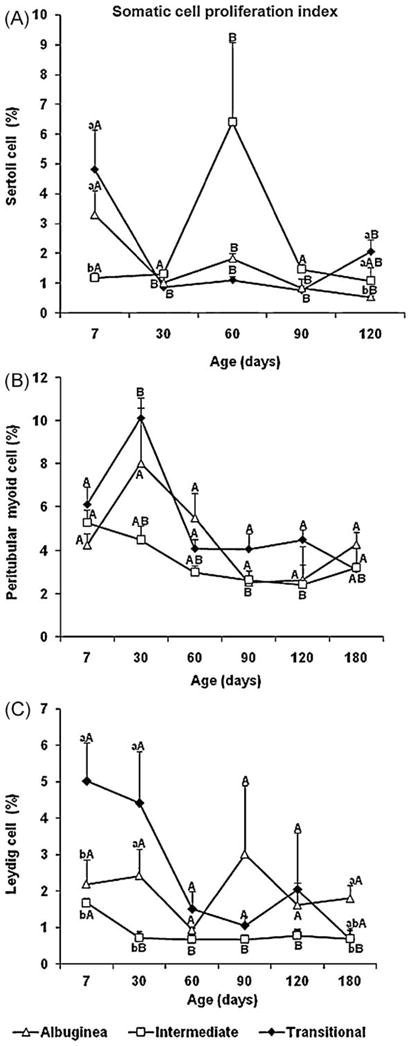
Testicular somatic cell proliferation index (mean ± SEM) in three regions of testicular parenchyma during postnatal development in pigs. Different lowercase letters denote significant differences between regions, whereas different uppercase letters denote significant differences between ages for the same region (P < 0.05).
There were no significant differences in the mitotic index regarding peritubular myoid cells in the three testis regions (Fig. 10B). The highest proliferation rates for this somatic cell type occurred at the earlier ages (7–30 d), whereas the lowest rates occurred mainly at 90–120 d (Fig. 10B).
Leydig cell proliferation rates are displayed in Fig. 10C. Except for the ID, which had a higher mitotic index (P < 0.05) at 7 d, no significant differences were found for the other two regions among the six ages investigated. More Leydig cells were dividing in the TR at 7 d (P < 0.05) and in the TR and TA at 30 d of age, whereas mitotic figures predominated in the TA in postpubertal pigs (P < 0.05). Interestingly, the ID region exhibited the lowest Leydig cell proliferation rate at all ages, whereas the opposite trend was generally observed for the Leydig cells in the TR.
There was a significant positive correlation between the proliferation rate of Leydig cells and blood vessels volume density (TR, r = 0.48; ID, r = 0.55), as well as between the mitotic activity of peritubular myoid cells and blood vessels (TR, r = 0.59; ID, r = 0.67). The mitotic activity of Leydig cells in the ID region were correlated (P < 0.05) with Sertoli cell proliferation rates in the TR and TA (r = 0.60 and r = 0.70, respectively).
4. Discussion
This is the first study to describe region-specific differences in the testicular parenchyma in pigs during postnatal development and associate this event with the pattern of somatic cell proliferation and function, and maturation of the seminiferous tubules. The knowledge obtained in the present study could serve as a baseline for studies investigating testis function in pigs, and even those aimed at increasing spermatogenic efficiency in this species.
Based on several end points, we inferred that seminiferous tubule maturation first begins in the ID and TR and appears to be associated with an increase in Leydig cell size and function in the ID. Moreover, as Sertoli cells had the highest mitotic index at 7 and 120 d of age in the TR, coinciding with the periods related to the two postnatal peaks in Sertoli cell proliferation previously described for pigs [3], we concluded from the present study that the primary growth in seminiferous tubule length occurred in this region.
Regardless of region, the overall pattern of postnatal testis development in pigs regarding several end points, e.g., testis weight, tubule diameter, volume densities of various testicular parenchyma components, tubular fluid secretion, individual Leydig cell size, and the establishment of puberty and the first sperm release from the seminiferous epithelium, followed the previously described trends for several pig breeds [3,33,34].
Growth in the length of the seminiferous cords/tubules, which begins with the proliferation of Sertoli cells [3], eventually provided the niche environment for self-renewing spermatogonial stem cells [35]. However, to maintain continuous production of sperm throughout adulthood, the seminiferous tubule must establish the “wave of the seminiferous epithelium” [36]. Therefore, some Sertoli cells must stop dividing and differentiate earlier than other Sertoli cells. These early differentiated Sertoli cells supported the beginning phases of spermatogenesis, which includes the differentiation of the early spermatogonia and subsequent maturation of germ cells through meiosis in the first wave of the cycle. Other Sertoli cells during this first wave, however, continued to proliferate in order to allow the testis to grow to adult size and spermatogonial stem cells to self-renew and migrate into these new regions of Sertoli cell niches, where sequential stages of spermatogenesis begin to extend the forming wave. There was an evident trend for more Sertoli cell proliferation in the TR after birth and prior to puberty and more seminiferous tubules containing spermatids and the first formation of sperm were observed in the ID at 3 and 4 mo of age, respectively. Therefore, based on the present data, we concluded that the first wave of spermatogenesis in pigs occurred in the ID, and this first wave extended predominantly to the TR, where more new Sertoli cells provided new niches. The overall low proliferation rate of Sertoli cells in the ID corroborated the hypothesis that Sertoli cells in this region cease to divide in order to support the differentiation of the seminiferous epithelium during the first wave of spermatogenesis. Also supporting this hypothesis, the mature appearance of Leydig cells in the ID was thought to increase testosterone concentration in this region. This was consistent with the present data, which revealed that the ID was the first area to support germ cell proliferation through spermiogenesis, which is the spermatogenic phase most dependent on androgens [37–39].
The cessation of Sertoli cell mitotic activity coincided with the increase in Sertoli cell nuclear volume, the onset of tubular fluid secretion, lumen formation, appearance, and extensive proliferation of primary spermatocytes, and formation and development of the Sertoli cell barrier and cytoskeleton. These end points were also good markers of Sertoli cell differentiation/maturation [3,32,40,41]. Thus, the significant correlation between Sertoli cell nuclear volume and the percentage occupied by the tubular lumen in the TR, and particularly in the ID, was further evidence of the more mature status of Sertoli cells in these two regions in pigs. Corroborating this finding, the diameter of the seminiferous cords/tubules was significantly higher at 90 d of age in the both ID and TR when compared to 60 d of age. Perhaps this pattern for the establishment of the tubular lumen is necessary in order to allow the seminiferous tubule fluid to flow toward the mediastinum [22].
The Sertoli cells in the TA were functionally more immature in comparison to the other two regions, particularly at 90 d, and the progression of germ cells through spermatogenesis was delayed. Although we carried out a very careful, comprehensive stereological and morphometric evaluation of the testicular parenchyma, we do not have an adequate explanation for the delayed Sertoli cell maturation/differentiation in the TA. As Leydig cell mitotic activity in the ID had a significant correlation with Sertoli cell proliferation rates in both the TA and TR, this stereoidogenic cell may play an important role in Sertoli function, as well as overall testis development.
In agreement with the literature [3,13–15], the percentage of Leydig cells in the testicular parenchyma was very high in the present study, particularly at 7–30 d after birth, and individual cell volume changed substantially during postnatal testicular development. However, there was a dramatic regional difference regarding several Leydig cell end points. Except for the mitotic index, which was lower in the ID, the volume of the Leydig cell nucleus and cytoplasm and individual Leydig cell size were strikingly higher in this region throughout the entire period investigated, which was reflected in the overall high volume density of this cell in the ID. In the absence of any association between Leydig cell size and other end points, these results were very difficult to interpret, as this trend was observed at all ages from birth to after puberty, which prevented us from associating these findings with puberty and the establishment of spermatogenesis. However, similar to peritubular myoid cells, the Leydig cell proliferation rate in the ID was significantly correlated with the blood vessels and, in contrast to blood vessels, connective tissue volume density was always lower in the ID. As Leydig cells in the ID seem to be functionally more active, this correlation with blood vessels and the lower percentage of connective tissue was somewhat expected. Finally, it should be mentioned that, regardless of the testis region, Leydig cells are also functionally related to Sertoli and peritubular myoid cells [3–6]. However, from these results, we inferred that these interactions may have a distinctive gradient from the center to the periphery of the testicular parenchyma in pigs, which is a hypothesis that should be more mechanistically investigated [22], taking into account the importance of blood vessels on testis development [42]. Horses have a distinctive pattern of testis development during the postnatal period [21], now corroborated by the present findings in pigs; therefore, this peculiarity should also be investigated in other mammalian species. This gradient of testis development and growth may already be established during gonadal differentiation in the fetal period [43,44] and is clearly observed in some lower vertebrates, even during adulthood [45].
It needs to be considered whether the three testis regions investigated were adequately chosen. Besides several other end points, the particular results for Leydig cells, which were noticeably significant in the ID at all ages investigated, clearly demonstrated that at least this region had particular characteristics in pigs. When grouping the TA plus ID or ID plus TR, the results were statistically significant in approximately 25 and 30%, respectively. Therefore, we inferred that the experimental design was appropriate. However, this does not exclude other potential functionally different regions in the testicular parenchyma of pigs during postnatal development.
In summary, the results of the present investigation revealed a region-specific gradient in seminiferous tubule maturation and somatic cell development in pigs, particularly for Leydig cells, which may play a pivotal role in postnatal testis development. These findings were functionally important and offered a new perspective regarding the investigation of testis development in this species. For instance, the knowledge obtained in the present work could be useful in studies involving a testis graft methodology as a tool for investigating testis function in pigs [46] because the area from which tissue fragments for grafting are obtained may influence their development. Furthermore, the observations presented here may also help interpreting the unexpected results involving Sertoli cell proliferation/differentiation in transient hyperthyroid-ism and hypothyroidism conditions in pigs [23,25,47]. However, many questions remain, such as why Leydig cells are apparently always functionally more active in the ID. Might this result only reflect some differences in the functional status of this important steroidogenic cell and/or are there different Leydig cell populations in particular testis regions that may be regulated by distinct extrinsic or intrinsic/local factors? These and other relevant questions related to testis development and function are particularly important to understand the establishment and regulation of spermatogenesis and also testis somatic cells proliferation in pigs, in which the total number of sperm per ejaculate is crucial for reproductive efficiency in the swine industry.
Acknowledgments
Financial support from the Brazilian National Council for Research (CNPq) and the Minas Gerais State Foundation (FAPEMIG) is gratefully acknowledged. The scholarships awarded to Gleide Fernandes Avelar from CNPq and Jaqueline Soares Melo and Carolina Felipe Alves de Oliveira from FAPEMIG are greatly appreciated. Technical help from Adriano Moreira and Mara L. Santos is also highly appreciated.
References
- 1.Karl J, Capel B. Sertoli cells of the mouse testis originate from the coelomic epithelium. Dev Biol. 1998;203:323–33. doi: 10.1006/dbio.1998.9068. [DOI] [PubMed] [Google Scholar]
- 2.Cool J, Capel B. Mixed signals: development of the testis. Semin Reprod Med. 2009;27:5–13. doi: 10.1055/s-0028-1108005. [DOI] [PubMed] [Google Scholar]
- 3.França LR, Silva VA, Jr, Chiarini-Garcia H, Garcia SK, Debeljuk L. Cell proliferation and hormonal changes during postnatal development of the testis in the pig. Biol Reprod. 2000;63:1629–36. doi: 10.1095/biolreprod63.6.1629. [DOI] [PubMed] [Google Scholar]
- 4.DiNapoli L, Capel B. SRYand the standoff in sex determination. Mol Endocrinol. 2008;22:1–9. doi: 10.1210/me.2007-0250. [DOI] [PMC free article] [PubMed] [Google Scholar]
- 5.Alvarenga ER, França LR. Effects of different temperatures on testis structure and function, with emphasis on somatic cells, in sexually mature Nile tilapias (Oreochromis niloticus) Biol Reprod. 2009;80:537–44. doi: 10.1095/biolreprod.108.072827. [DOI] [PubMed] [Google Scholar]
- 6.Welsh M, Saunders PT, Atanassova N, Sharpe RM, Smith LB. Androgen action via testicular peritubular myoid cells is essential for male fertility. FASEB J. 2009 doi: 10.1096/fj.09-138347. [DOI] [PMC free article] [PubMed] [Google Scholar]
- 7.Orth JM, Gunsalus GL, Lamperti AA. Evidence from Sertoli cell-depleted rats indicates that spermatid number in adults depends on numbers of Sertoli cells produced during perinatal development. Endocrinology. 1988;122:787–94. doi: 10.1210/endo-122-3-787. [DOI] [PubMed] [Google Scholar]
- 8.Sharpe RM, McKinnell C, Kivlin C, Fisher JS. Proliferation and functional maturation of Sertoli cells, and their relevance to disorders of testis function in adulthood. Reproduction. 2003;125:769–84. doi: 10.1530/rep.0.1250769. [DOI] [PubMed] [Google Scholar]
- 9.Plant TM, Ramaswamy S, Simorangkir D, Marshall GR. Post-natal and pubertal development of the rhesus monkey (Macaca mulatta) testis. Ann N Y Acad Sci. 2005;1061:149–62. doi: 10.1196/annals.1336.016. [DOI] [PubMed] [Google Scholar]
- 10.Griswold SL, Behringer RR. Fetal Leydig cell origin and development. Sex Dev. 2009;3:1–15. doi: 10.1159/000200077. [DOI] [PMC free article] [PubMed] [Google Scholar]
- 11.O’Shaughnessy P, Monteiro A, Verhoeven G, De Gendt K, Abel M. Effect of FSH on testicular morphology and spermatogenesis in gonadotrophin-deficient hypogondal (hpg) mice lacking androgen receptors. Reproduction. 2009 doi: 10.1530/REP-09-0377. [DOI] [PMC free article] [PubMed] [Google Scholar]
- 12.Dierichs R, Wrobel KH, Schilling E. Light and electron microscopic studies on the porcine testicular interstitial cells during postnatal development. Z Zellforsch Mikrosk Anat. 1973;143:207–27. [PubMed] [Google Scholar]
- 13.Van Straaten HW, Wensing CJ. Leydig cell development in the testis of the pig. Biol Reprod. 1978;18:86–93. doi: 10.1095/biolreprod18.1.86. [DOI] [PubMed] [Google Scholar]
- 14.Lunstra DD, Ford JJ, Christenson RK, Allrich RD. Changes in Leydig cell ultrastructure and function during pubertal development in the boar. Biol Reprod. 1986;34:145–58. doi: 10.1095/biolreprod34.1.145. [DOI] [PubMed] [Google Scholar]
- 15.Peyrat JP, Meusy-Dessolle N, Garnier J. Changes in Leydig cells and luteinizing hormone receptors in porcine testis during postnatal development. Endocrinology. 1981;108:625–31. doi: 10.1210/endo-108-2-625. [DOI] [PubMed] [Google Scholar]
- 16.Tripepi S, Carelli A, Perrotta E, Brunelli E, Tavolaro R, Facciolo RM, Canonaco M. Morphological and functional variations of Leydig cells in testis of the domestic pig during the different biological stages of development. J Exp Zool. 2000;287:167–75. [PubMed] [Google Scholar]
- 17.Courot M, Hochereau-de Reviers M-T, Ortavant R. Spermatogenesis. In: Johnson AD, Gomes WR, Van Demark NL, editors. The Testis. I. Academic Press; 1970. pp. 339–442. [Google Scholar]
- 18.Bouin P, Ancel P. La glande interstitelle du testicule chez le cheval. Arch Zool Exp Gen. 1905;3:391–437. [Google Scholar]
- 19.Nishikawa Y, Horie T. Studies on the development of the testes and epididymides of the horse. I. Studies on the development of the testes of the horse, with special reference to singularity and the age of sexual maturity. Natl Inst Agric Sci Jpn Bull Ser G Anim Husb. 1955;10:229–349. [Google Scholar]
- 20.Johnson L. Spermatogenesis. In: Cupps PT, editor. Reproduction in Domestic Animals. Academic Press; 1991. pp. 173–219. [Google Scholar]
- 21.Clemmons AJ, Thompson DL, Jr, Johnson L. Local initiation of spermatogenesis in the horse. Biol Reprod. 1995;52:1258–67. doi: 10.1095/biolreprod52.6.1258. [DOI] [PubMed] [Google Scholar]
- 22.Ford JJ, Wise TH. Sertoli cell differentiation in pubertal boars. J Anim Sci. 2009;87:2536–43. doi: 10.2527/jas.2009-1906. [DOI] [PubMed] [Google Scholar]
- 23.Cooke PS, Holsberger DR, França LR. Thyroid hormone regulation of Sertoli cell development. In: Skinner MK, Griswold MD, editors. Sertoli cell Biology. Elsevier Academic Press; 2005. pp. 217–26. [Google Scholar]
- 24.Leal MC, França LR. Slow increase of Sertoli cell efficiency and daily sperm production causes delayed establishment of full sexual maturity in the rodent Chinchilla lanigera. Theriogenology. 2009;71:509–18. doi: 10.1016/j.theriogenology.2008.08.017. [DOI] [PubMed] [Google Scholar]
- 25.Klobucar I, Kosec M, Cebulj-Kadunc N, Majdic G. Postnatal hypothyroidism does not affect prepubertal testis development in boars. Reprod Domest Anim. 2003;38:193–208. doi: 10.1046/j.1439-0531.2003.00423.x. [DOI] [PubMed] [Google Scholar]
- 26.Lunstra DD, Wise TH, Ford JJ. Sertoli cells in the boar testis: changes during development and compensatory hypertrophy after hemicastration at different ages. Biol Reprod. 2003;68:140–50. doi: 10.1095/biolreprod.102.006510. [DOI] [PubMed] [Google Scholar]
- 27.At-Taras EE, Berger T, McCarthy MJ, Conley AJ, Nitta-Oda BJ, Roser JF. Reducing estrogen synthesis in developing boars increases testis size and total sperm production. J Androl. 2006;27:552–9. doi: 10.2164/jandrol.05195. [DOI] [PubMed] [Google Scholar]
- 28.Ramesh R, Pearl CA, At-Taras E, Roser JF, Berger T. Ontogeny of androgen and estrogen receptor expression in porcine testis: effect of reducing testicular estrogen synthesis. Anim Reprod Sci. 2007;102:286–99. doi: 10.1016/j.anireprosci.2006.10.025. [DOI] [PubMed] [Google Scholar]
- 29.At-Taras EE, Kim IC, Berger T, Conley A, Roser JF. Reducing endogenous estrogen during development alters hormone production by porcine Leydig cells and seminiferous tubules. Domest Anim Endocrinol. 2008;34:100–8. doi: 10.1016/j.domaniend.2006.11.003. [DOI] [PubMed] [Google Scholar]
- 30.Berger T, McCarthy M, Pearl CA, At-Taras E, Roser JF, Conley A. Reducing endogenous estrogens during the neonatal and juvenile periods affects reproductive tract development and sperm production in postpuberal boars. Anim Reprod Sci. 2008;109:218–35. doi: 10.1016/j.anireprosci.2007.10.003. [DOI] [PubMed] [Google Scholar]
- 31.Castro ACS. Thesis. Belo Horizonte, Brazil: Federal University of Minas Gerais; 1989. Testicular and epididymal sperm reserves in Piau boars, from puberty to sexual maturity [in Portuguese] [Google Scholar]
- 32.Russell LD, Bartke A, Goh JC. Postnatal development of the Sertoli cell barrier, tubular lumen, and cytoskeleton of Sertoli and myoid cells in the rat, and their relationship to tubular fluid secretion and flow. Am J Anat. 1989;184:179–89. doi: 10.1002/aja.1001840302. [DOI] [PubMed] [Google Scholar]
- 33.Van Straaten HW, Wensing CJ. Histomorphometric aspects of testicular morphogenesis in the pig. Biol Reprod. 1977;17:467–72. doi: 10.1095/biolreprod17.4.467. [DOI] [PubMed] [Google Scholar]
- 34.Flor-Cruz SZ, Lapwood KR. A longitudinal study of pubertal development in boars. Int J Androl. 1978;1:317–30. [Google Scholar]
- 35.Hess RA, Cooke PS, Hofmann MC, Murphy KM. Mechanistic insights into the regulation of the spermatogonial stem cell niche. Cell Cycle. 2006;5:1164–70. doi: 10.4161/cc.5.11.2775. [DOI] [PMC free article] [PubMed] [Google Scholar]
- 36.Perey B, Clermont Y, Leblond CP. The wave of the seminiferous epithelium in the rat. Am J Anat. 1961;108:47–77. [Google Scholar]
- 37.Sharpe RM. Regulation of Spermatogenesis. In: Knobil E, Neill JD, editors. The Physiology of Reproduction. Raven Press; 1994. pp. 1363–434. [Google Scholar]
- 38.De Gendt K, Swinnen JV, Saunders PT, Schoonjans L, Dewerchin M, Devos A, Tan K, Atanassova N, Claessens F, Lécureuil C, Heyns W, Carmeliet P, Guillou F, Sharpe RM, Verhoeven G. A Sertoli cell-selective knockout of the androgen receptor causes spermatogenic arrest in meiosis. Proc Natl Acad Sci USA. 2004;10:1327–32. doi: 10.1073/pnas.0308114100. [DOI] [PMC free article] [PubMed] [Google Scholar]
- 39.Wang RS, Yeh S, Tzeng CR, Chang C. Androgen receptor roles in spermatogenesis and fertility: lessons from testicular cell-specific androgen receptor knockout mice. Endocr Rev. 2009;30:119–32. doi: 10.1210/er.2008-0025. [DOI] [PMC free article] [PubMed] [Google Scholar]
- 40.Gondos B, Berndston WE. Postnatal and pubertal development. In: Russell LD, Griswold MD, editors. The Sertoli Cell. Cache River Press; 1993. pp. 115–54. [Google Scholar]
- 41.Leal MC, França LR. Postnatal Sertoli and Leydig cell proliferation and the establishment of puberty and sexual maturity in Chinchilla lanigera (Rodentia, Chinchillidae) Reprod Fertil Dev. 2008;20:665–73. doi: 10.1071/rd07134. [DOI] [PubMed] [Google Scholar]
- 42.Combes AN, Wilhelm D, Davidson T, Dejana E, Harley V, Sinclair A, Koopman P. Endothelial cell migration directs testis cord formation. Dev Biol. 2009;326:112–20. doi: 10.1016/j.ydbio.2008.10.040. [DOI] [PubMed] [Google Scholar]
- 43.Bowles J, Knight D, Smith C, Wilhelm D, Richman J, Mamiya S, Yashiro K, Chawengsaksophak K, Wilson MJ, Rossant J, Hamada H, Koopman P. Retinoid signaling determines germ cell fate in mice. Science. 2006;312:596–600. doi: 10.1126/science.1125691. [DOI] [PubMed] [Google Scholar]
- 44.Koubova J, Menke DB, Zhou Q, Capel B, Griswold MD, Page DC. Retinoic acid regulates sex-specific timing of meiotic initiation in mice. Proc Natl Acad Sci USA. 2006;103:2474–9. doi: 10.1073/pnas.0510813103. [DOI] [PMC free article] [PubMed] [Google Scholar]
- 45.Schulz RW, de França LR, Lareyre JJ, Legac F, Chiarini-Garcia H, Nobrega RH, Miura T. Spermatogenesis in fish. Gen Comp Endocrinol. 2009 doi: 10.1016/j.ygcen.2009.02.013. [DOI] [PubMed] [Google Scholar]
- 46.Rodriguez-Sosa JR, Dobrinski I. Recent developments in testis tissue xenografting. Reproduction. 2009;138:187–94. doi: 10.1530/REP-09-0012. [DOI] [PubMed] [Google Scholar]
- 47.Tarn CY, Rosenkrans CF, Jr, Apple JK, Kirby JD. Effects of 6-N-propyl-2-thiouracil on growth, hormonal profiles, carcass and reproductive traits of boars. Anim Reprod Sci. 1998;50:81–94. doi: 10.1016/s0378-4320(97)00091-2. [DOI] [PubMed] [Google Scholar]


