. 2016 Mar 14;5:e11903. doi: 10.7554/eLife.11903

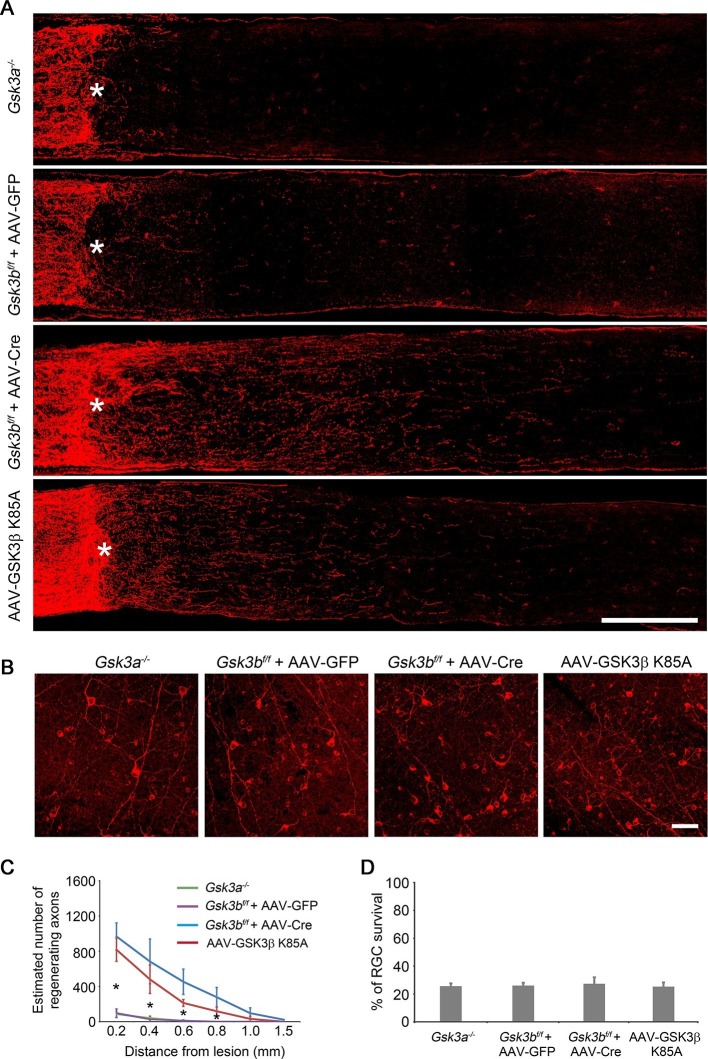
Figure 3. Deletion or inactivation of GSK3β promotes axon regeneration.

(A) Confocal images of optic nerve sections showing regenerating axons labeled by anti-GAP43 immunohistochemistry at 2 weeks after optic nerve crush from Gsk3a−/− mice, Gsk3bf/f mice injected with AAV-GFP or AAV-Cre, or AAV-GSK3β K85A injected wild-type mice. *, crush site. Scale bar, 200 µm. (B) Confocal images of retinal whole-mounts showing surviving Tuj1+ RGCs at 2 weeks after optic nerve injury. Scale bar, 50 µm. (C) Quantification of regenerating axons at different distances distal to the lesion site. Data are presented as mean ± s.d., n=5 per group. *p<0.01, Two-way ANOVA with Bonferroni post hoc test. (D) Quantification of RGC survival at 2 weeks after injury, expressed as a percentage of total Tuj1+ RGCs in the uninjured retina. Data are presented as mean ± s.d., n=5 per group.

DOI: http://dx.doi.org/10.7554/eLife.11903.009

Figure 3.

Figure 3—figure supplement 1. Cre-mediated Gsk3b deletion in RGCs.

Figure 3—figure supplement 1.

(A) Confocal images of retinal sections showing double immunolabeling for Tuj1+ RGCs and GSK3β from AAV-GFP or AAV-Cre-injected Gsk3bf/f eyes, Scale bar, 20 µm. (B) Quantification of GSK3β immunofluorescence intensity. Data are presented as mean ± s.d., n=3 per group. *p<0.01, Student’s t test.
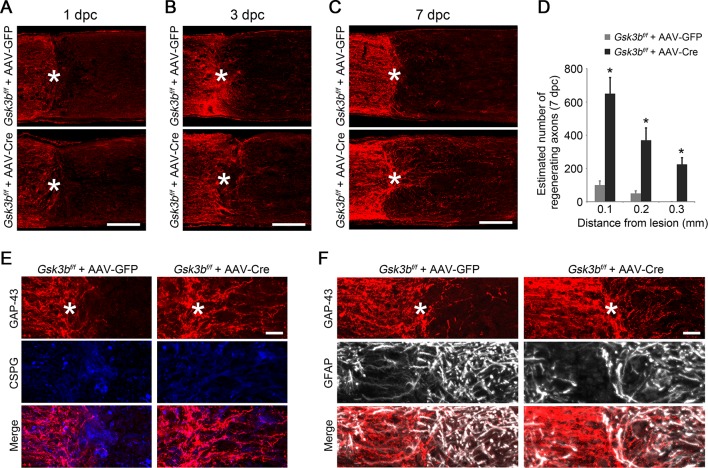
Figure 3—figure supplement 2. A time course study of axon regeneration in Gsk3b-deleted RGCs.

Figure 3—figure supplement 2.

(A-C) Confocal images of optic nerve sections showing regenerating axons labeled by anti-GAP43 immunohistochemistry at 1, 3, or 7 days from Gsk3bf/f mice injected with AAV-GFP or AAV-Cre. *, crush site. Scale bar, 100 µm. (D) Quantification of regenerating axons at 7 days after injury from Gsk3bf/f mice injected with AAV-GFP or AAV-Cre at different distances distal to the lesion site. Data are presented as mean ± s.d., n=4 per group. *p<0.01, Two-way ANOVA with Bonferroni post hoc test. (E) Confocal images of optic nerve sections showing double immunolabeling for GAP43+ regenerating axons and chondroitin sulfate proteoglycan (CSPG). Scale bar, 20 µm. (F) Confocal images of optic nerve sections showing double immunolabeling for GAP43+ regenerating axons and glial fibrillary acidic protein (GFAP). Scale bar, 20 µm.
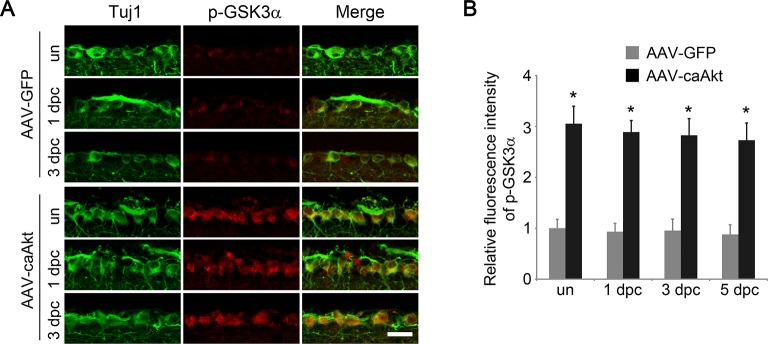
Figure 3—figure supplement 3. AKT activation increases GSK3α phosphorylation.

Figure 3—figure supplement 3.

(A) Immunohistochemical detection of GSK3α phosphorylation at Ser21 in retinal sections from AAV-GFP or AAV-caAkt injected eyes, with or without optic nerve injury. Scale bar, 20 µm. (B) Quantification of RGC phospho-GSK3α immunofluorescence intensity. Data are presented as mean ± s.d., n=4 per group. *p<0.001, Two-way ANOVA with Bonferroni post hoc test.