Abstract
We propose to assess the process of learning a task using electroencephalographic (EEG) measurements. In particular, we quantify changes in brain activity associated to the progression of the learning experience through the functional analysis-of-variances (FANOVA) estimators of the EEG power spectral density (PSD). Such functional estimators provide a sense of the effect of training in the EEG dynamics. For that purpose, we implemented an experiment to monitor the process of learning to type using the Colemak keyboard layout during a twelve-lessons training. Hence, our aim is to identify statistically significant changes in PSD of various EEG rhythms at different stages and difficulty levels of the learning process. Those changes are taken into account only when a probabilistic measure of the cognitive state ensures the high engagement of the volunteer to the training. Based on this, a series of statistical tests are performed in order to determine the personalized frequencies and sensors at which changes in PSD occur, then the FANOVA estimates are computed and analyzed. Our experimental results showed a significant decrease in the power of and rhythms for ten volunteers during the learning process, and such decrease happens regardless of the difficulty of the lesson. These results are in agreement with previous reports of changes in PSD being associated to feature binding and memory encoding.
Keywords: Neurocognitive phenomics, Electroencephalography, Brain rhythms, Power spectral density, Functional ANOVA, Learning
Introduction
A great deal of research in the area of neurosciences is being focused in developing physiological and/or behavioral measurements to provide objective and accurate quantification of the development of new abilities. Recently, a new branch of science called neurocognitive phenomics has been proposed by Duch (2013), which aims to explain, at least qualitatively, the phenomena that link cognitive psychology and learning with brain processes. While some of the ideas behind this new science might seem rather speculative, they serve as inspiration for our proposal.
Changes in the electroencephalogram (EEG) occurring during various mental activities in man have been the subject of many investigations since the beginning of EEG research. The use of spectral analysis for EEG has allowed determination of neurophysiological relationships (Walter 1963), as well as examination of the correlation between EEG and mental processing (Dolce and Waldeier 1974). In terms of learning, there is also much interest in analyzing the variables affecting its performance, and evidence linking spectral parameters of EEG with a number of different factors have been already reported (Harmony et al. 1990). Nevertheless, those studies so far have been more interested in the factors affecting the performance among individuals, and not on how the learning process evolves.
An early attempt to explain the correlation between EEG and learning is the one by Thompson and Obrist (1964), where the link between the active phase of learning and EEG desynchronization is first suggested. There, significant EEG changes were obtained during verbal learning as opposed to non-learning control conditions, while an over-learning condition resulted in a slight return toward control levels. However, the technical limitations of the time only allowed to observe such phenomena on slow brain rhythms, specifically the alpha and beta bands.
More recently, the role of faster brain rhythms in learning has been studied. In particular, the gamma band has been linked with associative (Miltner et al. 1999) and perceptual (Gruber et al. 2002) learning. In both cases, differences on a metric related to the gamma activity (coherence and induced band response, respectively) were found as probable representations of Hebbian cell assembly, which is critical for learning, memory, information processing, perception and the behavior of organisms. Still, both studies work on the basis of a learning/non-learning paradigm similar to the one by Thompson and Obrist (1964), then it is difficult to conclude about the evolution of the learning process.
Aside from that, the use of controlled elevation or suppression of specific EEG frequency components and slow potentials by means of EEG biofeedback (also referred to as neurofeedback) has been employed in research and clinical settings (Yucha and Montgomery 2008). The experimental application of neurofeedback protocols to healthy subjects has been shown to be a useful approach for elucidating protocol-specific effects on behavioral and electrocortical performance measures, as well as for establishing basic tenets regarding the learning process underlying the neurofeedback training rationale (Egner and Gruzelier 2001). However, while evidence delineating the effects of frequency-band neurofeedback has thus accumulated over recent years, the neurophysiological workings underlying those effects are only poorly understood. This further motivates the need of placing more effort in cultivating the area of neurocognitive phenomics.
In this paper (see also Gutiérrez et al. 2015), we propose to study the brain activity measured through EEG during the process of acquiring a new ability. Hence, we analyze the power spectral densities (PSD) of various brain rhythms as a first step to find the link between learning and brain processes. In our case, we are interested in the evolution of the learning process, then we analyze the influence that different difficulty levels of the task to be learned have in the PSD at different stages of the training process.
Since we are interested in the dynamics of the learning process, we require additional tools of statistical analysis that are a function of time. That is the case of functional analysis-of-variances (FANOVA) through which the effects of training on a repetition-to-repetition basis can be accounted for. Hence, the main contribution of this work is the use of the FANOVA estimators of the PSD to measure the effect of training through the process of learning, instead of the “before and after” account that the classical analysis-of-variances (ANOVA) could provide.
Experimental setup
Ten volunteers were trained through a series of twelve daily lessons to type in a computer using the Colemak keyboard layout, which is an alternative to the QWERTY and Dvorak layouts, and it is designed for efficient and ergonomic touch typing in English. Six of our volunteers were female, four male, all of them were right-handed, and their mean age was 29.3 years old with an standard deviation of 5.7 years. The lessons used during our experiment are available on-line at colemak.com/Typing_lessons. In our case, we asked the volunteers to repeat each of them five times (with resting intervals of 2 min in between). We chose Colemak touch typing as the ability to learn because most people are unaware of its existence, then it is a good candidate for a truly new ability to learn. The training process always took place in a sound-proof cubicle in which the volunteers were isolated from distractions. Hence, the volunteers were sitting in front of the computer and were engaged entirely in the typing lesson (see Fig. 1). All the experiments were carried at the same hour of the day, and all volunteers were asked to refrain of doing any additional training anywhere else. Each of the volunteers’ repetitions were chronometred in order to assess the improvement in their ability to type. Note that this included the time used to correctly write all the words in the lesson, as well as the time consumed in erasing and rewriting words due to any mistakes.
Fig. 1.
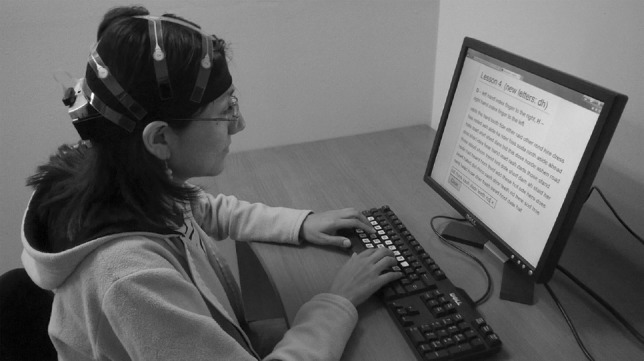
Experimental setup
Each of the volunteers were subjected to four sessions of EEG recordings, all of which were acquired using the B-Alert X10 wireless system from Advanced Brain Monitoring, Inc., which includes a combination of nine EEG sensors with fixed gain referenced to linked mastoids and located at mid-line and lateral positions . Those sensors, based on the international 10–20 reference system, are positioned at F3, Fz, F4, C3, Cz, C4, P3, POz, and P4. All data are acquired at a sampling frequency of 256 Hz and filtered with a fifth-order Butterworth bandpass filter with cutoff frequencies at 0.1 and 100 Hz. Our measurements were acquired as follows:
An initial EEG measurement is performed before starting the training sessions in order to define a baseline state through B-Alert’s Alertness & Memory Profiler (AMP), which corresponds to a comprehensive neurocognitive test battery that synchronizes B-Alert EEG data to evaluate and compare metrics across populations and interventions (Berka et al. 2010).
EEG measurements were acquired during the repetitions of the typing task at the fourth, eighth, and eleventh lessons, in which one-, two-, and three-full horizontal lines of keys in the keyboard were used, respectively. Hence, those three lessons are assumed as representative of low-, medium-, and high-level difficulty in performing the task. During the experiment, the volunteer typed while seated in front of the computer and the corresponding lesson was displayed in the monitor.
The B-Alert software provides a second-to-second estimate of the EEG’s mean PSD for the brain rhythms in the following ranges: 1–2 Hz for , 3–7 Hz for , 8–12 Hz for , 13–29 Hz for , and 30–40 Hz for . The PSD is computed by performing fast Fourier transform (FFT) on a segment of data that is of interest, and calculating the amplitudes of the sinusoidal components for the frequency bins defined previously. The second-to-second estimates of the PSD are the result of applying a 50 % overlapping window which averages the PSD across three overlays to smooth the data. Each overlay contains 256 data points with 128 being shared for each overlay. A Kaiser window is applied to each overlay in order to accentuate the contribution of power from the signal in the middle third of the overlay and minimize the impact of signal near the edge of the overlay. Prior to computing the PSD, the raw signals are processed to eliminate spikes, excursions and amplifier saturation, as well as excessive electromiographic (EMG) contribution. In particular, a combination of high frequency (based off 70–128 Hz for each overlay) and low frequency (based off 35–40 Hz) detectors are used to identify periods with excessive EMG. If only one overlay has EMG, then the PSD for the current epoch is based on the average of the remaining two overlays. If excessive EMG is found in two overlays, the epoch is excluded from the analysis.
Furthermore, the B-Alert software also provides a probabilistic measure of the cognitive state based on the results of the AMP. Hence, in addition to the PSD values, each one-second epoch is assigned one of the following states: sleep onset, distraction, low engagement, and high engagement. More information about the validity of this metric can be found in the paper by Johnson et al. (2011).
Proposed analysis
We propose to perform different statistical tests in order to establish a relationship between changes in PSD during the learning task and (1) frequency of the brain rhythm, (2) EEG sensors, and (3) repetitions of a lesson. Hence, our proposed analysis consists in two-sample t tests, two-way ANOVA, and the calculation of the FANOVA estimators, respectively.
Two-sample t tests
We perform two-sample t tests to check if the PSD estimates from the measurements at the last repetition are significantly different in comparison to those from the first. The statistical tests are performed for all nine measuring channels at the three measured lessons, but only the PSD epochs where the B-Alert software classified the volunteer’s cognitive state as high engagement are considered. Under those conditions, the test statistic under the null hypothesis has a student’s t distribution with degrees of freedom, where and are the number of epochs classified as high engagement during the first and last repetition, respectively. The t tests are performed for each subject and for a specific brain rhythm in order to determine the frequency band in which changes in PSD are linked to the learning task. Only those frequencies for which a majority of sensors show significant change in PSD would be considered for the next statistical test through ANOVA.
Two-way ANOVA
In order to get a better understanding of the relationship between changes in PSD as result of the learning task, we propose to find if the repetitions and the difficulty levels of the tasks have a mixed interaction with changes in the PSD. Hence, for each subject, we perform nine (one for the data acquired at each sensor) two-way ANOVA tests. Those sensors in which a significant mixed effect of the factors (repetitions and difficulty) is found will be selected as a personalized set to be used in the following functional test.
Based on those conditions, the test statistic under the null hypothesis has a F distribution with degrees of freedom, where corresponds to the number of epochs classified as high engagement in the ith repetition and jth difficulty level. Given that is not a constant value, the two-way ANOVA tests here proposed are unbalanced (Fujikoshi 1993). At the end, the personalized sets will be formed with those sensors for which the probability of the test statistic is much more smaller than the significance level assumed (for details behind this reasoning, see Salazar-Varas and Gutiérrez 2015).
FANOVA estimators
With the selected frequencies and sensors in which significant changes in PSD are observed, the final step in the analysis is to assess the evolution of those changes as a function of the repetitions. In this way, we will be able to get some insight about the evolution of the brain rhythms as the process of learning happens. In order to achieve that, we propose to analyze the FANOVA estimators obtained from the data at each lesson.
FANOVA is a “functionalized” version of the standard ANOVA test, in which the observations , for repetitions, and sensors, are modeled by a fixed-effect ANOVA model (Ramsay 2006):
| 1 |
for , where is the main-effect function, are the treatment functions, and are independent zero-mean Gaussian errors. In order for the treatment functions to be uniquely identifiable, they have to satisfy the constraint for all n.
In our case, the idea behind using (1) is to represent the PSD as having a common component, as well as an element of extra variation due to the effect of the ith repetition. Under those conditions, the functions and are estimated as follows:
| 2 |
i.e., the average PSD across all repetitions and sensors, and
| 3 |
with . The FANOVA estimators in (2) and (3) are those that minimize the residual sum of squares:
| 4 |
The problem in (4) corresponds to minimize the discrete version of the least-mean-squared sum of errors (LMSSE). More details on the solution and some computational caveats involved in (4) are discussed in Ramsay’s (2006) book.
Results
Before proceeding with the statistical tests proposed in “Proposed analysis” section, we looked at the time it took our volunteers to complete each repetition. We denote this time at the ith repetition as , for . The mean standard deviation for the first repetition in the fourth, eighth, and eleventh lessons were , , and s, respectively. By the fifth repetition, those times got reduced to , , and s, respectively. Hence, as a measure of the percentage improvement, we compared and for all lessons through the following formula:
| 5 |
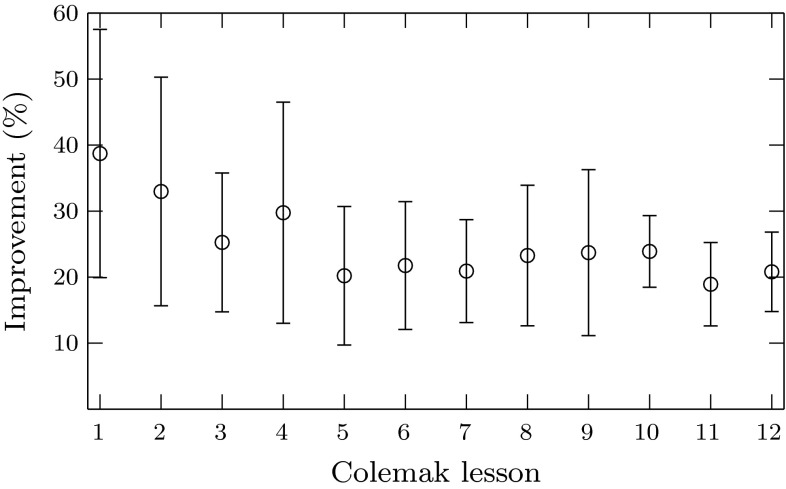
Therefore, a faster last repetition in comparison to the first one is considered as an improvement. In our case, such improvement is assumed to be a reflection of the volunteer’s learning process, and the results can be seen in Fig. 2. There, we note that the improvement gets reduced as the difficulty in the lessons increase. However, there was always an improvement on average for our subjects at all lessons.
Fig. 2.
Average improvement in the lesson’s execution time for our ten subjects. Error bars indicate the mean standard deviation
Next, the t tests proposed in “Two-sample t tests” section were applied to the data of each sensor in order to check if the PSD at the first and last repetition of a lesson were significantly different. Note that the percentage of PSD epochs classified as high engagement was always between 52 and 72 % and, for each volunteer, the standard deviation of that value was never above 5 % between repetitions of the same lesson, then we can guarantee the commitment of the subjects to the experiment and discard tiredness effects. An example of the data used for this analysis is shown in Fig. 3. A total of two-sample t tests were performed for each of the brain rhythms of interest. In all cases, the tests were implemented with the Statistics and Machine Learning Toolbox™ of Matlab (www.mathworks.com), and a significance level of 0.01 was used. As result, the number of those tests (in percentage) that rejected the null hypothesis
| 6 |
where indicates the mean PSD at a given repetition, turned out to be: 18.89 % for , 27.41 % for , 31.11 % for , 54.44 % for , and 71.11 % for . Based on those results, our following analysis focused in the and bands, for which the change was such that in most of the t tests (for more details, see Gutiérrez et al. 2015).
Fig. 3.
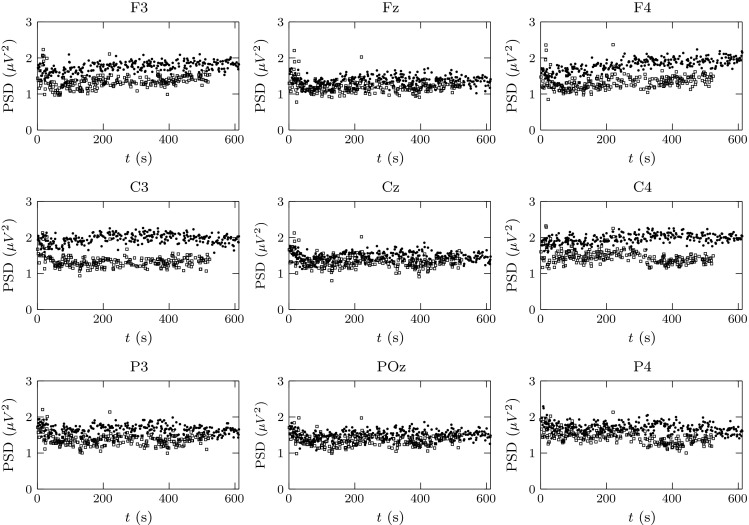
PSD estimates of the rhythm while Subject 5 performed the eleventh Colemak lesson. Points marked with circle correspond to the first attempt of that lesson, while those indicated as square correspond to the fifth
Two-way ANOVA tests were performed on the PSD of the selected brain rhythms. The aim of these tests was to select those EEG sensors in which interaction between repetitions and difficulty level was observed. Again, the tests were implemented with Matlab, and a significance level of 0.01 was used. Overall, two-way ANOVA tests were evaluated for each subject’s data. As result, in most tests, then the sensors with the lowest p-values were selected for the following analysis. However, some cases were above the significance level and the corresponding sensors had to be excluded from the following tests (we even had a couple of cases where ). A list of such cases is shown next, in which the pair of [F, p] values of the corresponding two-way ANOVA test are included as well:
Cz [1.60, 0.119], C4 [1.94, 0.050], POz [2.28, 0.019], and P4 [2.10, 0.032] in the band were excluded for Subject 1;
Fz [1.94, 0.051] and F4 [4.06, 0.043] in the band were excluded for Subject 6;
C3 [1.55, 0.137] and Cz [2.36, 0.016] in the band, and C4 [2.08, 0.034], P3 [1.03, 0.412], and P4 [2.39, 0.015] in the band were excluded for Subject 8;
F3 [1.35, 0.215], Fz [1.42, 0.183], C3 [2.29, 0.019], Cz [2.09, 0.034], P3 [2.38, 0.015], and POz [2.48, 0.011] in the band were excluded for Subject 9.
It is worth mentioning that Subject 8, who was the only one that had sensors excluded in both bands, had experience in formal typing using the QWERTY layout.
Once the personalized sets of sensors had been chosen, we proceeded to compute the FANOVA estimators as described in “FANOVA estimators” section, but with two additional processing steps that were applied to the PSD:
In (1), it is assumed that the samples are equally spaced, but that is not our case due to the constraint of only using PSD values that corresponded to a cognitive state of high engagement. Therefore, we applied a spline interpolation to the PSD in order to have uniformly spaced samples.
In our case, , then an unbalanced FANOVA test would have been required. Instead of that, we decided to “balance” the data by obtaining new time series corresponding to autoregressive (AR) processes fitted from the original PSD values through the method proposed by Schneider and Neumaier (2001). Hence, our data were both fitted and re-synthesized with third-order AR models and the new time series had a number of samples .
Under those conditions, we obtained the FANOVA estimators for each subject, at each difficulty level, and for the selected frequency bands. An example of the result of this process is shown in Fig. 4. There, we can notice that the main difference between treatment functions is on the mean, which is computed as .
Fig. 4.
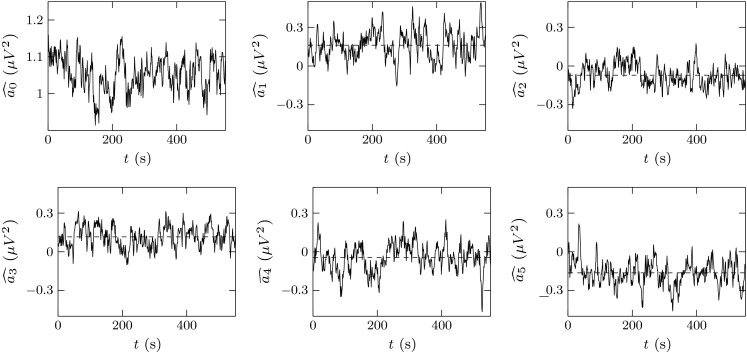
Example of FANOVA estimators for one subject at a given difficulty level. The dashed lines represent the mean value of the corresponding treatment function
A comparison of all the values of for our group of subjects is shown in Fig. 5. Note that each of the values there actually correspond to the grand average of over 100 independent realizations of the synthesized data in order to minimize the effects of the variability introduced by the AR modeling process in our results. Furthermore, we performed one-way ANOVA and multiple-comparison tests in order to asses the effect in our subjects of repeating the lesson. As result, we found a significant decrease () in the and rhythms from the beginning to the end of a lesson, and this result was independent of the level of difficulty. The speed of such decay in power was approximated by the slope (m) of the linear regression of the data.
Fig. 5.
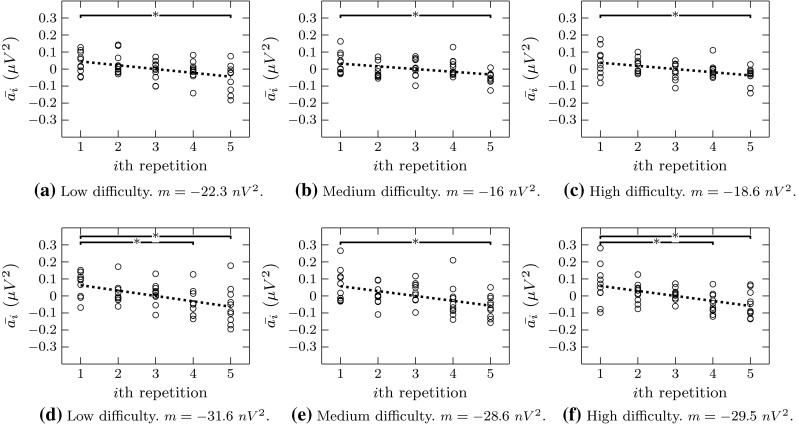
Mean effect of training for our ten subjects according to the proposed analysis of the FANOVA estimators. The top row (a–c) corresponds to band, while the lower row (d–f) corresponds to band. The asterisks indicate those repetitions at which the mean PSD of the subjects is significantly different than the one obtained at the first repetition (). The dotted lines correspond to the linear regressions of the data, for which the corresponding slope (m) is indicated below each graph
Finally, in order to highlight the fact that the decrease in the power of and rhythms is indeed related to an improvement in the ability to type, we observed the relationship between the values of and the time required by all subjects to complete the tasks for the case of the first and last repetition (i.e., ), as those were the repetitions for which all the difficulty levels turned out with significant decrease in and , and those were the times we considered for our measure of improvement shown in Fig. 2. Therefore, we computed the Pearson’s correlation of the pairs , and the results shown in Fig. 6 indicate that there exists a moderately strong to strong correlation between FANOVA estimators and time required in the first and last repetitions, such that positive values of correspond to larger times to execute the task, while negative values correspond to shorter times.
Fig. 6.
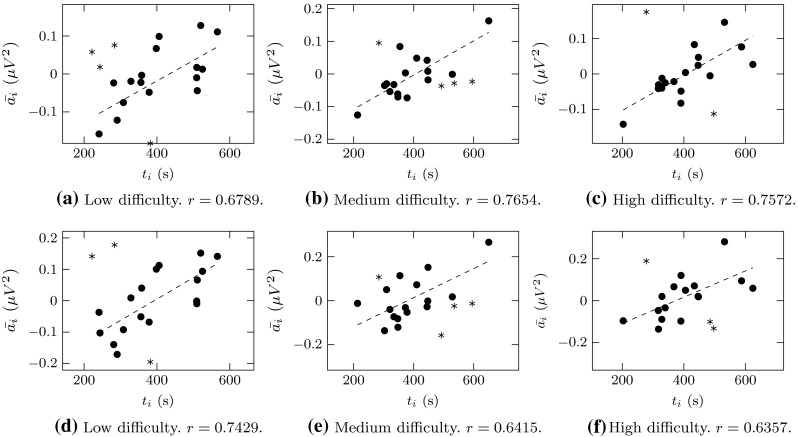
Values of (, ) for all subjects and for . The top row (a–c) corresponds to band, while the lower row (d–f) corresponds to band. The Pearson’s correlation coefficient r is given for each band and difficulty level (with for all cases). Data point considered as outliers are indicated by asterisk
Discussion
The main purpose of introducing a functional analysis of the PSD was motivated by the desire of having a tool capable of describing the time-changing dynamics of the learning process, then the FANOVA estimators were proposed for such task. Perhaps our case of study was not the best example to show the full potential of this type of analysis, given that the observed changes turned out to be only on the mean of the PSD. Nevertheless, we believe that our analysis can be seen as a proof-of-the-concept on how to proceed in the case of more elaborated learning tasks and with longer training periods in which non-stationarity of the processes to be analyzed could be expected.
Now, in terms of the decrease we found in the and rhythms, we strongly believe they can be the result of two phenomena previously observed in the context of (1) motor learning and reduced preparatory or attentional demands, and (2) memory encoding, respectively.
In the first phenomenon, Niemann et al. (1991) reported a decrease of the EEG negativity which was correlated with the increase of motor skill (in their case, of a complex finger motor task). More recently, Erbil and Ungan (2007) showed the correlation between the decrease in amplitude as result of long-duration repetitive hand movements similar to those studied by Niemann et al. (1991). It might seem, therefore, possible to explain the suppression observed in our typing task as the result of the sustained motor activity having the habituation effect of the cortical mechanisms stimulated by the somatosensory stimuli related to the learning task.
In addition to the decrease, multiple studies in humans suggest a role of induced oscillations in coupling perception and learning. That is the case of memory encoding that, in its simplest form, has been shown to appear as a decrease of neural activity upon repeated presentations of the same stimulus. This phenomenon, known as repetition suppression, can be specifically observed in the rhythm (Gruber and Mller 2005). Upon repeated presentation of a stimulus, the synaptic plasticity fostered by oscillations would help selecting the most relevant processes and lead to the creation of a sparse and faster neural route, resulting in a sharpened representation of the learned stimulus. Although repetition suppression might explain the reduction in we observed, further analysis is necessary, as different components of the rhythm (in frequency and space) have been related to either the perceptual or the overall attentional allocation of the stimuli in memory (Chaumon et al. 2009).
Conclusions
We proposed an analysis framework based on multiple statistical tests for EEG data acquired during the process of learning a task, in this case typing in Colemak. However, it is through the use of the FANOVA estimators of the PSD that we propose to get an insight on the effects of different factors (amount of training and difficulty) that the process of learning has in the brain dynamics. We showed the feasibility of examining sustained EEG activity and reinforced the hypothesis that some of its rhythms correlate to the process of learning. Our results were in agreement with previous evidence of the involvement of and rhythms in the process of acquiring a new ability.
In this paper we focused our attention in the decreasing trend of the and rhythms given that such trend was more obvious in those bands through our preliminary analysis (Gutiérrez et al. 2015). However, a less evident increase in the band could be observed in some subjects and in some sensors. Then, we believe it is important also to study this band and its possible interaction with and as others have previously suggested (Canolty and Knight 2010). We strongly believe that the analysis framework here presented has the potential to help to understand the nature of such coupling at different stages of the learning process. Furthermore, the balance between increasing and decreasing and could be studied as the learning task progresses through a combination of the methods here proposed and time-varying AR analysis as the one proposed by Gutiérrez (2013).
Finally, it is also important to study the spatial distribution of the different rhythm’s power in order to better understand the underlying brain processes (Miltner et al. 1999). Therefore, for our future work, we plan to acquire a greater number of EEG sensors, as well as to introduce an analysis of EEG coherence similar to the one proposed by Salazar-Varas and Gutiérrez (2015), but for the case of studying a learning task.
Acknowledgments
This work was supported by the Mexican Council of Science and Technology (Conacyt) through Grant 220145.
References
- Berka C, Levendowski D, Westbrook P, Davis G, Johnson R, Popovic D (2010) Interactive psychophysiological profiler method and system. US Patent App. 12/466,263
- Canolty RT, Knight RT. The functional role of cross-frequency coupling. Trends Cogn Sci. 2010;14(11):506–515. doi: 10.1016/j.tics.2010.09.001. [DOI] [PMC free article] [PubMed] [Google Scholar]
- Chaumon M, Schwartz D, Tallon-Baudry C. Unconscious learning versus visual perception: dissociable roles for gamma oscillations revealed in MEG. J Cogn Neurosci. 2009;21(12):2287–2299. doi: 10.1162/jocn.2008.21155. [DOI] [PubMed] [Google Scholar]
- Dolce G, Waldeier H. Spectral and multivariate analysis of EEG changes during mental activity in man. Electroencephalogr Clin Neurophysiol. 1974;36:577–584. doi: 10.1016/0013-4694(74)90224-7. [DOI] [PubMed] [Google Scholar]
- Duch W (2013) Brains and education: towards neurocognitive phenomics. In: Reynolds N, Webb M, Sysło MM, Dagiene V (eds) Learning while we are connected, vol 3. Citeseer, pp 12–23
- Egner T, Gruzelier JH. Learned self-regulation of EEG frequency components affects attention and event-related brain potentials in humans. Neuroreport. 2001;12(18):4155–4159. doi: 10.1097/00001756-200112210-00058. [DOI] [PubMed] [Google Scholar]
- Erbil N, Ungan P. Changes in the alpha and beta amplitudes of the central EEG during the onset, continuation, and offset of long-duration repetitive hand movements. Brain Res. 2007;1169:44–56. doi: 10.1016/j.brainres.2007.07.014. [DOI] [PubMed] [Google Scholar]
- Fujikoshi Y. Two-way ANOVA models with unbalanced data. Discrete Math. 1993;116(13):315–334. doi: 10.1016/0012-365X(93)90410-U. [DOI] [Google Scholar]
- Gruber T, Mller MM. Oscillatory brain activity dissociates between associative stimulus content in a repetition priming task in the human EEG. Cereb Cortex. 2005;15(1):109–116. doi: 10.1093/cercor/bhh113. [DOI] [PubMed] [Google Scholar]
- Gruber T, Müller MM, Keil A. Modulation of induced gamma band responses in a perceptual learning task in the human EEG. J Cogn Neurosci. 2002;14(5):732–744. doi: 10.1162/08989290260138636. [DOI] [PubMed] [Google Scholar]
- Gutiérrez D. Multivariate time-varying autoregressive modeling of fetal sympatho-vagal balance through gestation. Biomed Eng Appl Basis Commun. 2013;25(01):1350014. doi: 10.4015/S1016237213500142. [DOI] [Google Scholar]
- Gutiérrez D, Ramírez-Moreno MA, Lazcano-Herrera AG (2015) Assessing the acquisition of a new skill with electroencephalography. In: Proceedings of the 7th annual international IEEE EMBS conference on neural engineering. IEEE, pp 727–730
- Harmony T, Hinojosa G, Marosi E, Becker J, Rodriguez M, Reyes A, Rocha C. Correlation between EEG spectral parameters and an educational evaluation. Int J Neurosci. 1990;54(1–2):147–155. doi: 10.3109/00207459008986630. [DOI] [PubMed] [Google Scholar]
- Johnson RR, Popovic DP, Olmstead RE, Stikic M, Levendowski DJ, Berka C. Drowsiness/alertness algorithm development and validation using synchronized EEG and cognitive performance to individualize a generalized model. Biol Psychol. 2011;87(2):241–250. doi: 10.1016/j.biopsycho.2011.03.003. [DOI] [PMC free article] [PubMed] [Google Scholar]
- Miltner WHR, Braun C, Arnold M, Witte H, Taub E. Coherence of gamma-band EEG activity as a basis for associative learning. Nat Lett. 1999;397:434–436. doi: 10.1038/17126. [DOI] [PubMed] [Google Scholar]
- Niemann J, Winker T, Gerling J, Landwehrmeyer B, Jung R. Changes of slow cortical negative dc-potentials during the acquisition of a complex finger motor task. Exp Brain Res. 1991;85(2):417–422. doi: 10.1007/BF00229418. [DOI] [PubMed] [Google Scholar]
- Ramsay JO (2006) Functional data analysis. Wiley Online Library
- Salazar-Varas R, Gutiérrez D. An optimized feature selection and classification method for using electroencephalographic coherence in brain–computer interfaces. Biomed Signal Process Control. 2015;18:11–18. doi: 10.1016/j.bspc.2014.11.001. [DOI] [Google Scholar]
- Schneider T, Neumaier A. Algorithm 808: ARfit—a Matlab package for the estimation of parameters and eigenmodes of multivariate autoregressive models. ACM Trans Math Softw (TOMS) 2001;27(1):58–65. doi: 10.1145/382043.382316. [DOI] [Google Scholar]
- Thompson LW, Obrist WD. EEG correlates of verbal learning and overlearning. Electroencephalogr Clin Neurophysiol. 1964;16:332–342. doi: 10.1016/0013-4694(64)90067-7. [DOI] [PubMed] [Google Scholar]
- Walter DO. Spectral analysis for electroencephalograms: mathematical determination of neurophysiological relationships from records of limited duration. Exp Neurol. 1963;8(2):155–181. doi: 10.1016/0014-4886(63)90042-6. [DOI] [PubMed] [Google Scholar]
- Yucha C, Montgomery D. Evidence-based practice in biofeedback and neurofeedback. Wheat Ridge: AAPB; 2008. [Google Scholar]


