Abstract
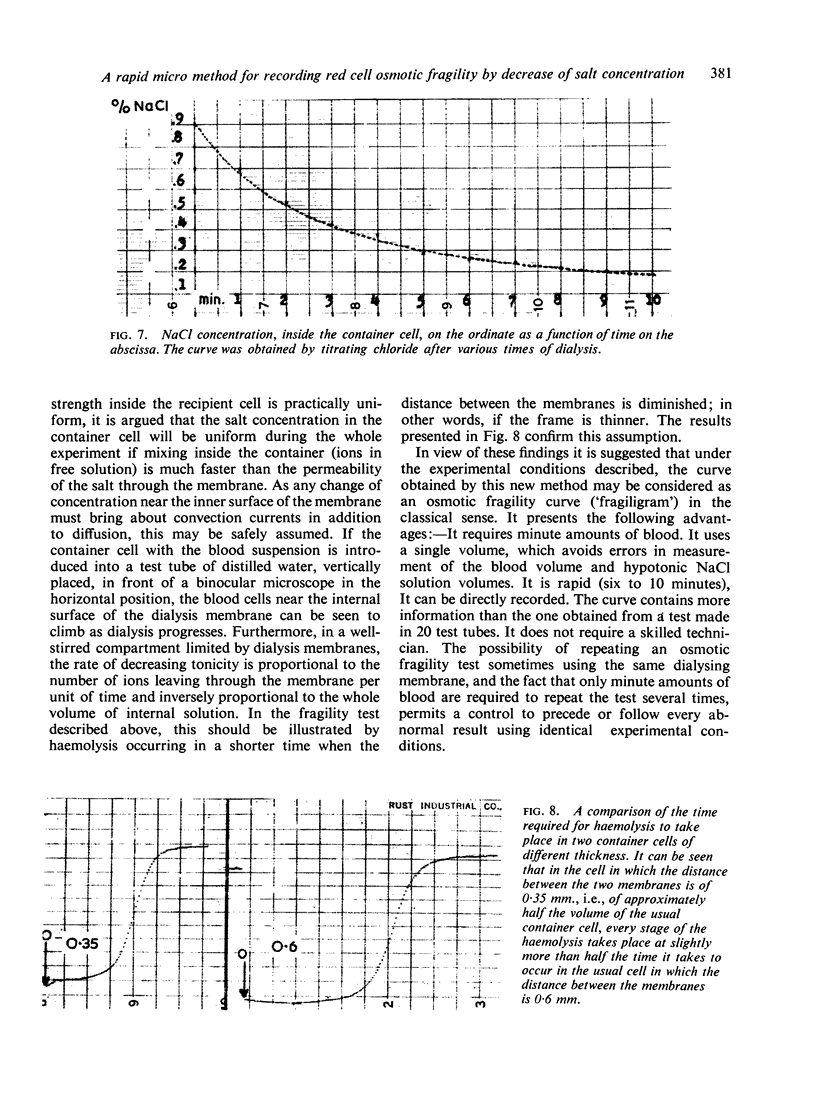
A single volume of 0·075 ml. of a 1 in 10 dilution of whole blood in isotonic NaCl solution is introduced into a container cell, two walls of which are made of a dialysing membrane. The container cell is introduced into a test tube of distilled water, placed in an instrument which is essentially a colorimeter with a recorder, between the source of light and the photoelectric cell. Dialysis through the membrane results in a continuous decrease in the salt concentration of the medium surrounding the erythrocytes. The measurement of the degree of haemolysis is based on the increasing transparency of the erythrocyte suspension while haemolysis takes place. Recording this increasing light transmission as a function of time, i.e., as a function of decreasing salt concentration, yields the osmotic fragility curve. The automatically recorded curve is obtained in less than 10 minutes.
Full text
PDF
Images in this article
Selected References
These references are in PubMed. This may not be the complete list of references from this article.
- DANON D., FREI E. H., FREI Y. F., LIPKIN Y. AN INSTRUMENT FOR AUTOMATICALLY RECORDING THE OSMOTIC FRAGILITY CURVE OF RED CELLS AND/OR ITS DERIVATIVE. IEEE Trans Biomed Eng. 1963 Jan;10:24–28. doi: 10.1109/tbmel.1963.4322778. [DOI] [PubMed] [Google Scholar]


