

Summary
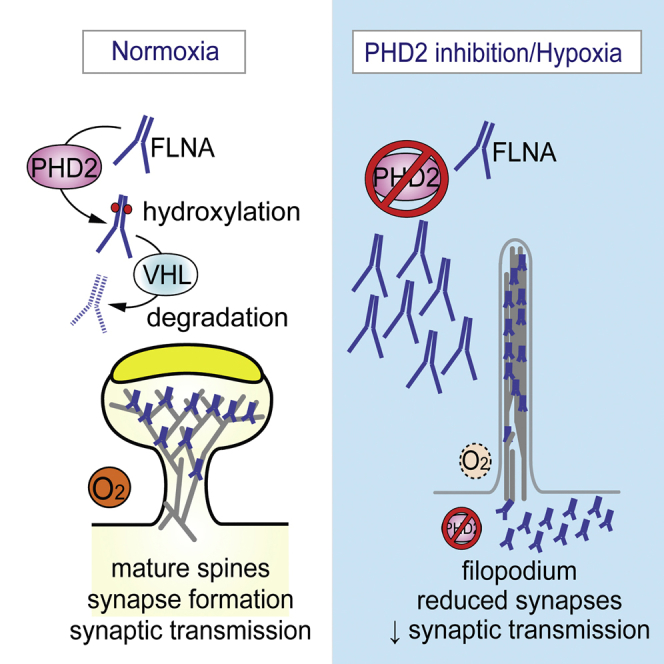
Neuronal function is highly sensitive to changes in oxygen levels, but how hypoxia affects dendritic spine formation and synaptogenesis is unknown. Here we report that hypoxia, chemical inhibition of the oxygen-sensing prolyl hydroxylase domain proteins (PHDs), and silencing of Phd2 induce immature filopodium-like dendritic protrusions, promote spine regression, reduce synaptic density, and decrease the frequency of spontaneous action potentials independently of HIF signaling. We identified the actin cross-linker filamin A (FLNA) as a target of PHD2 mediating these effects. In normoxia, PHD2 hydroxylates the proline residues P2309 and P2316 in FLNA, leading to von Hippel-Lindau (VHL)-mediated ubiquitination and proteasomal degradation. In hypoxia, PHD2 inactivation rapidly upregulates FLNA protein levels because of blockage of its proteasomal degradation. FLNA upregulation induces more immature spines, whereas Flna silencing rescues the immature spine phenotype induced by PHD2 inhibition.
Graphical Abstract
Highlights
-
•
The oxygen sensor PHD2 is present in dendritic spines
-
•
PHD2 inhibition by hypoxia reduces spine maturation, synaptic density, and activity
-
•
Through hydroxylation, PHD2 targets filamin A for proteasomal degradation
-
•
Filamin A stabilization promotes dendritic spine remodeling
Neuronal function is highly sensitive to oxygen levels. Segura et al. show that inhibition of the oxygen sensor PHD2 induces dendritic spine regression in hippocampal neurons, thereby reducing synaptic density and network-wide neuronal activity. We identify the actin cross-linker filamin A as a target of PHD2 mediating these effects.
Introduction
Synaptic transmission is the main energy-consuming process in the brain and requires large amounts of ATP. Because neurons generate energy primarily oxidatively, they require oxygen. Therefore, when oxygen becomes limiting, there is a risk that the ATP pool becomes exhausted. We hypothesized that neurons possess adaptive mechanisms to prevent such an energy crisis during hypoxia and speculated that hypoxia might remodel dendritic spines to reduce the energy-consuming process of synaptic transmission.
The oxygen sensors prolyl hydroxylase domain-containing proteins (PHD1-3) use oxygen to hydroxylate prolines in target proteins, such as hypoxia-inducible transcription factor α (HIFα) (Epstein et al., 2001). Hydroxylated HIFα is ubiquitinated by the E3 ubiquitin ligase von Hippel-Lindau (VHL), triggering proteasomal degradation (Ivan et al., 2001, Jaakkola et al., 2001). In hypoxia, PHDs are inactive, and stabilized HIFα upregulates the transcription of target genes (Epstein et al., 2001). PHDs also have HIF- and hydroxylation-independent functions and targets (Wong et al., 2013).
Dendritic spines are actin-rich protrusions emerging from dendrites and receiving synaptic input. They are implicated in synaptic plasticity, learning, and memory (Hotulainen and Hoogenraad, 2010). Spines sprout as filopodia that search for synaptic contact and develop into mature spines containing the postsynaptic density receiving synaptic input (Ethell and Pasquale, 2005, Hotulainen and Hoogenraad, 2010). Among actin cross-linkers, filamin A (FLNA) promotes the formation of orthogonal networks or parallel actin bundles, depending on the filamin/F-actin ratio (van der Flier and Sonnenberg, 2001). FLNA regulates dendritic morphogenesis (Zhang et al., 2014), the axonal growth cone (Zheng et al., 2011), and neuronal migration (Sarkisian et al., 2006), but it is unknown whether FLNA regulates spine morphology. Notably, under- and overexpression of FLNA impair neuronal migration via distinct mechanisms (Sarkisian et al., 2006, Zhang et al., 2012, Zhang et al., 2013), indicating that neurons require precise regulation of FLNA levels.
Anecdotal observations suggest that PHDs regulate actin rearrangements via an undefined mechanism. PHD2-haplodeficient endothelial cells have impaired migration and actin cytoskeleton reorganization (Mazzone et al., 2009), whereas PHD2-deficient HeLa cells show altered cell migration via an HIF-independent mechanism (Vogel et al., 2010). These findings raised the question whether oxygen, via PHD2, might control actin-dependent spine formation. We thus investigated the role of PHD2 in the morphogenesis and maintenance of dendritic spines and synapses in hippocampal neurons.
Results
Hypoxia and Dimethyl-Oxalylglycine Induce Immature Spines
In mouse hippocampal neurons (MHNs), dendritic spines emerge during 8–11 days in vitro (DIV) and progressively mature to shorter mushroom-shaped spines at 12–15 DIV, with concomitant induction of spontaneous synchronized network-wide spiking activity (Figures S1A–S1E). To evaluate whether physiological levels of hypoxia (which can be as low as 0.5% O2 in the brain (Erecińska and Silver, 2001)) affect dendritic spine formation, 13-DIV MHNs were incubated overnight (o/n) in normoxia (21% O2) or hypoxia (1% O2). To visualize dendritic protrusions, we transfected 10-DIV MHNs with yellow (YFP) or tandem dimer tomato (tdT) fluorescent proteins. Neurons exposed to hypoxia showed reduced protrusion density, and most spines were long filopodium-like protrusions without a head (Figures 1A–1E). Similar effects were seen in established mature spines when treatment started at 20 DIV (Figures S1F–S1J). These alterations were not due to changes in neuronal viability (Figures S1K–S1M) or oxidative stress (Figure S1N).
Figure 1.

The Effect of Hypoxia on Dendritic Spines
(A–E) YFP-transfected MHNs were incubated for 16 hr in normoxia (A) or hypoxia (B) and analyzed for protrusion density (C), protrusion length (D), and percentage of spines with a head (E) (n = 3 experiments, 30 neurons, >800 protrusions). (A′) and (B′) show higher magnifications of the boxes in (A) and (B), respectively.
(F) Snapshot images at the start (0) and after 15, 30, 45, or 60 min of time-lapse recording of 14-DIV tdT-labeled MHNs in control (top) or hypoxia (bottom) conditions. Solid arrowheads indicate spines with a persistent increase or decrease in length. Open arrowheads indicate spines that do not change their length. Each color denotes a distinct spine. The red asterisk indicates a sprouting dendrite.
(G and H) Length of protrusions at 0 and 1 hr of recording in normoxia or hypoxia (G, n ≥ 40) and distribution of spines according to length variation (H). Stable, Δ length ≤ 0.2 μm.
Data are mean ± SEM. ∗∗∗p < 0.001. Scale bars, 10 μm (A–B′) and 5 μm (F). N, normoxia; H, hypoxia (1% O2, A–E, or 0.5% O2, F–H).
Also see Figures S1 and S2.
Time-lapse imaging of 14-DIV YFP-labeled MHNs for 1 hr showed that, in normoxia, 45% of the spines were stable in length (variations ≤ 0.2 μm), whereas the rest slightly increased or reduced their length (Figures 1F–1H). In hypoxia (0.5% O2), most spines became longer or regressed, and only 33% kept their original length (Figures 1F–1H). Similar effects were observed upon o/n treatment of 13-DIV MHNs with the PHD inhibitor dimethyl-oxalylglycine (DMOG), which upregulates hypoxia-responsive genes and the HIF-dependent luciferase reporter (Figures S1O and S1P and S2A–S2I) without causing apoptosis or oxidative stress (Figures S1K–S1N). Neurons did not suffer irreversible damage because washout of DMOG restored spine density and maturation (Figures S2J–S2M′). Thus, inactivation of PHDs (by hypoxia or pharmacologic inhibition) impaired spine maturation, caused spine regression, and reduced spine density without altering viability.
Hypoxia and DMOG Induce Synaptic Impairment
To evaluate whether hypoxia and DMOG altered the electrophysiological properties of neurons, we performed patch-clamp recordings. 13- or 20-DIV MHNs were incubated o/n in normoxia or hypoxia or treated with DMOG. Neither hypoxia nor DMOG altered their passive electrical membrane properties (Figures S3A–S3C) or intrinsic excitability (Figures S3D–S3F), as confirmed by evoking antidromic action potentials (APs) upon repeated extracellular electrical stimulation (Figure S3G). These results show that hypoxia or DMOG did not change the ability of neurons to initiate and propagate APs upon stimulation. They did also not alter the time course of individual APs (Figures S3H–S3K). However, hypoxia and DMOG reduced the frequency of spontaneous AP firing (Figures 2A and 2B; Figure S3L), suggesting that MHNs had fewer functional synaptic connections and received less excitatory synaptic input.
Figure 2.

Synaptic Activity and Density of MHNs in Hypoxia and DMOG
(A) Spontaneous AP firing recorded from single cells by patch-clamp.
(B) Representative APs recorded by patch-clamp.
(C and D) Frequency of spontaneous AP firing (C) and network-wide AP synchronization (D) (n = 4 MEAs/condition) in MHNs in the indicated conditions.
(E–G′), vGlut (green) and PSD-95 (red) immunostaining (E′–G′) of tdT-transfected MHNs (E–G) that were subjected at 20 DIV for 16 hr to the indicated conditions. The contours of the dendrites in (E)–(G) are indicated in (E′)–(G′).
(H) Quantification of dendritic density of vGlut+/PSD-95+ co-clusters (n ≥ 20 neurons) by counting the green and red co-clusters colocalizing or in immediate apposition with the dendrite/spine.
Data are mean ± SEM. ∗p < 0.05 versus normoxia (A) or versus their respective 13-DIV value (C and D). ∗∗∗p < 0.001. Scale bars, 10 μm. H, hypoxia (1% O2); H/N, hypoxia o/n followed by 24 hr of normoxia; D, DMOG (250 μM for A, B, G, and G′ and 1 mM for C and D); WO, washout.
Also see Figure S3.
We also explored whether the morphological changes of dendritic protrusions were reflected by functional alterations in synaptic transmission. Hypoxia and DMOG reduced excitatory synaptic transmission at 14 and 21 DIV, as evidenced by the suppressed spontaneous synchronized network-wide spiking activity (bursts), whereas inhibitory synapses were unaffected because not only burst duration but also burst frequency were reduced (Figures 2C and 2D; Figures S3M–S3O). Neurons recovered from hypoxia or DMOG and restored synchronized spiking activity 24 hr after switching back to control conditions (Figures 2C and 2D; Figures S3M–S3O), consistent with the morphological recovery after DMOG washout (Figures S2J–S2M′).
Immunostaining showed that hypoxia and DMOG reduced synaptic density, as assessed by the decreased co-localization of the presynaptic marker vGlut1 and the postsynaptic marker PSD-95 (Figures 2E–2H), or the density of the presynaptic marker synaptophysin (Figures S3P–S3S). However, no differences in the abundance or (plasma membrane) localization of the α-amino-3-hydroxy-5-methyl-4-isoxazolepropionic acid (AMPA) receptors GluA1 and GluA2 were detected (data not shown), indicating that the reduced excitatory signaling upon hypoxia or DMOG was not due to downregulation of postsynaptic AMPA receptors. Instead, the reduced synaptic transmission upon hypoxia or DMOG results from the remodeling of dendritic spines and the decreased synaptic density.
PHD2 Is Expressed in Hippocampal Neurons
To define which PHDs are involved, we analyzed the expression of PHDs. In situ hybridization, RT-PCR, and RNA sequencing (RNA-seq) revealed that Phd1 (also known as Egln2) and Phd2 (Egln1), but not Phd3 (Egln3), were detected in the brain of mouse embryos or neonates (Figures S4A–S4C). In the adult brain, Phd2 was detected in the hippocampus, cortical layers II, III, and V, and other regions (Figure S4A; data not shown). A low Phd1 signal was detected in the hippocampus (Figure S4A).
We prepared postsynaptic density (PSD) fractions from 2-week-old wild-type (WT) mice (Cho et al., 1992). Protein enrichment was assessed by immunoblotting (IB) for PSD-95 and synaptophysin as post- and pre-synaptic markers, respectively. IB showed that PHD2 was broadly present, including in synaptosomes and PSDs (Figure 3A). Using an antibody specific for PHD2 in immunostainings (Figures S4D–S4H), PHD2 was detected in neurites and dendritic protrusions of MHNs (Figure 3B) and rat hippocampal neurons (RHNs) (data not shown), in close apposition to synaptophysin+ puncta, suggesting postsynaptic localization. A wide distribution was also obtained in MHNs transfected with YFP-tagged PHD2 (PHD2WTYFP) (Figure S4I).
Figure 3.

PHD2 Expression and Silencing in Dendritic Spines
(A) Representative IB of non-PSD fraction (NS), synaptic membranes (S), and PSD-enriched fractions for the indicated proteins.
(B) Staining of MHNs for PHD2 (green) and synaptophysin (red). The bottom panels are higher magnifications (bottom left: PHD2+ signal; bottom right: merged signal). Arrowheads indicate PHD2+ postsynaptic clusters. Dotted lines indicate neighboring cells (high-density cultures were used to maintain neurons in culture for prolonged periods). Green/red dots outside of the soma and dendrite are stainings of neighboring cells.
(C–I) 13-DIV MHNs co-transfected with YFP plus control shRNA (scr) (C and E) or shPhd2 (D and F) were incubated for 16 hr in normoxia (C and D) or hypoxia (E and F) and analyzed for protrusion density (G), protrusion length (H), and percent of spines with a head (I) (n = 3 experiments, 21–30 neurons, 300–1,400 protrusions).
(J–K′) vGlut (green) and PSD-95 (red) immunostaining (J′ and K′) of MHNs co-transfected at 14 DIV with scr (J and J′) or shPhd2 (K and K′) together with tdT (J–L′). The contours of the dendrites in (J) and (K) are indicated in (J′) and (K′), respectively.
(L) Quantification of dendritic density of vGlut+/PSD-95+ co-clusters (n ≥ 20 neurons).
(M–Q), YFP-transfected 14-DIV MHNs isolated from control (M) or PHD2NKO (N) littermates and analyzed for protrusion density (O), protrusion length (P), and number of spines with a head (Q) (n = 6 animals, >30 dendrites, >1,000 protrusions).
(R) Frequency of spontaneous network-wide AP synchronization (n = 4 MEAs/condition) of 14-DIV MHNs isolated from ctrl or PHD2NKO littermates.
(S) Representative dendritic protrusions of 14-DIV MHNs isolated from ctrl or PHD2NKO littermates upon transfection at 7 DIV with YFP (top), PHD2WTYFP (bottom left), or PHD2MUTYFP (bottom right).
(T) Analysis of dendritic protrusion density in the CA1 region of 2-week-old WT mice upon in utero electroporation at E15.5 with control shRNA (scr) or shPhd2 (n = 4–6 animals).
Data are mean ± SEM (G–I, L, and O–R) or single data plus mean ± SEM (T). ∗p < 0.05, ∗∗p < 0.01, ∗∗∗p < 0.001. Scale bars, 10 μm (B) and 5 μm (C–F, J–K′, M, N, and S).
Also see Figures S4–S6.
Phd2 Silencing Impairs Dendritic Spine Maturation
To assess whether PHD2 regulated spine formation, we silenced Phd2 in MHNs. 7-DIV MHNs were co-transfected with YFP and control scrambled (scr) short hairpin RNA (shRNA) or Phd2-specific shRNA (shPhd2). At 14 DIV, Phd2 silencing reduced dendritic protrusion density and the frequency of spines with a head, whereas it increased protrusion length (Figures 3C, 3D, and 3G–3I). Hypoxia did not further alter these parameters in Phd2-silenced MHNs (Figures 3E–3I). Time-lapse imaging showed that scr MHNs behaved as the control and retained most spines (Figures S4J–S4L, compare with Figures S2F–S2I, ctrl), whereas shPhd2 resembled DMOG-treated neurons with lower spine density and longer spines (Figures S4J–S4L). Phd2 silencing did not alter passive and excitable electrical membrane properties, as recorded by patch-clamping, but reduced the frequency of the spontaneously fired APs (Figures S5A–S5J). Phd2 silencing also impaired synaptic density, as revealed by the reduced number of vGlut1+/PSD-95+ co-clusters (Figures 3J–3L) and synaptophysin+ clusters (Figures S4M–S4Q). Silencing of Phd1 did not affect spines (Figures S4R–S4T). Thus, PHD2 regulated the formation and maintenance of spines and synapses.
Loss of PHD2 Impairs Dendritic Spine Maturation
To confirm the shRNA results, we isolated MHNs from Phd2lox/lox embryos and transfected them at 7 DIV with the Brainbow1.0 (BBW) plasmid alone or together with a Cre recombinase (Cre) plasmid. BBW expresses red fluorescent protein (RFP) in the absence of Cre and CFP or YFP in the presence of Cre. Compared with control RFP+ neurons, YFP+ or CFP+ PHD2-deficient cells had reduced protrusion density and increased protrusion length (Figure S4U). Similar results were obtained in MNHs from mice lacking PHD2 in neurons (PHD2NKO) (Figures 3M–3Q; Figure S4V). Also, PHD2 deletion reduced the frequency and synchronicity of spontaneous bursts of APs (Figure 3R; Figure S5K). The phenotype of PHD2NKO spines was rescued by PHD2WTYFP but not by an inactive PHD2 mutant that lacks hydroxylation activity (PHD2MUTYFP) (Vogel et al., 2010; Figure 3S; Figures S4W–S4Y). Thus, PHD2-mediated hydroxylation is required to induce dendritic spine maturation.
Phd2 Regulates Dendritic Spine and Synaptic Density In Vivo
To evaluate the effect of Phd2 silencing on dendritic spines in vivo, we performed shRNA knockdown of Phd2 by in utero electroporation of the hippocampus in embryonic day 15.5 (E15.5) embryos (Pacary et al., 2012) with a bigenic vector co-expressing the shRNA and ZsGreen1 fluorescent protein. Analysis of dendritic spines in the hippocampal CA1 region on postnatal day 15 (P15) revealed that spine density was reduced in shPhd2 neurons in vivo (Figure 3T; Figures S6A and S6B).
Golgi staining showed that spine density was reduced in PHD2NKO mice (Figures S6C–S6E). To gain insight into the role of PHD2 in synapse formation in vivo, we analyzed the stratum radiatum of the hippocampal CA1 region. Transmission electron microscopy (TEM) and immunostaining revealed that PHD2NKO littermates had reduced synaptic density (Figures S6F and S6G) (number of synapses/100 μm2, 38.98 ± 0.90 for control (ctrl) versus 32.95 ± 1.17 for PHD2NKO; n = 3 animals; p < 0.001) and synaptophysin+ and PSD-95+ signals (Figures S6H–S6M). Thus, PHD2 regulates spine morphogenesis and synaptic density in vivo.
Hypoxic Spine Remodeling Occurs Prior to HIF-Mediated Transcription
To identify the molecular mechanism by which PHD2-mediated hydroxylation regulated spine morphogenesis, we explored the involvement of HIF-1α. We evaluated the kinetics of HIF-mediated transcription after PHD blockade by using the 9xHRE::Luciferase reporter. Luciferase (Luc) activity was increased, but only after 20 hr of hypoxia or DMOG, and the blocker acriflavine abolished this effect (Figure S1P). Thus, HIF-mediated transcription occurred later than the onset of spine remodeling, suggesting an HIF-independent mechanism. Also, hypoxia still induced dendritic spine changes in HIF-1αNKO MHNs (obtained by transducing MHNs from Hif-1αlox/lox mice with an adenoviral Cre vector; data not shown), further indicating that spine remodeling occurred independently of HIF-1α.
FLNA Is Expressed in Dendritic Filopodia and Spines
We considered alternative targets for PHD2 and focused on the actin cross-linker FLNA because it interacts with VHL (Tsuchiya et al., 1996), thus providing a putative molecular link between the cytoskeleton and hypoxia. FLNA is detected in the soma and dendrites, although its localization in spines is debated (Nestor et al., 2011, Noam et al., 2012). Staining of RHNs with a specific anti-FLNA antibody (Figures S7A and S7B) used in conjunction with confocal imaging confirmed that FLNA was detectable in the soma and dendrites and in structures resembling dendritic spines, close to synaptophysin+ clusters (data not shown). To enhance spatial resolution of FLNA+ puncta, we used high-resolution structured illumination microscopy (SIM), which showed FLNA+ puncta in filopodium-like protrusions and the head of mature dendritic spines (Figure 4A; Figures S7C and S7D). The use of SIM and YFP-transfected neurons at 14 DIV, when spines are still remodeling, may explain the more prominent detection of FLNA in spines compared with other studies using conventional resolution microscopy of untransfected neurons (which makes precise spine visualization more challenging) at 3–4 weeks in culture, when spines and synapses are mature and stable (Noam et al., 2012, Nwabuisi-Heath et al., 2012).
Figure 4.

Filamin A Expression in Dendritic Spines
(A) SIM micrograph of YFP+ (green) RHNs immunostained for endogenous FLNA (red; gray at the right). Arrowheads indicate FLNA+ puncta in filopodium (top). The green dashed line indicates the contour of a dendritic spine head (bottom).
(B) 14-DIV MHNs co-transfected with tdT (red) and FLNAFLTQ2 (green) in normoxia or hypoxia.
(C) Representative IB for FLNA, VHL, and drebrin of mouse brain homogenate (H), non-synaptic fraction (NS), synaptic membranes, and PSD-enriched fractions from WT mice exposed to normoxia or hypoxia (8% O2) for 4 hr.
(D) Representative IB for FLNA and tubulin in 14-DIV MHNs subjected to normoxia or hypoxia for the indicated times.
(E) Representative IB for FLNA and tubulin in 14-DIV untreated MHNs or MHNs treated with DMOG for 2 hr.
(F) Representative IB for FLNA and tubulin in untreated MHNs (−) or treated with DMOG (D), MG132 (MG), actinomycin D (Ac), or cycloheximide (Cy) in normoxia or hypoxia.
(G) Representative IB for FLNA and tubulin in MHNs treated for 2 hr with increasing concentrations of MG132.
(H) IB for FLNA, PHD2, myc, and tubulin in MHNs transduced with scrambled control shRNA, shPhd2, or overexpressing mycFLNAD21–D23-WT.
(I) Representative IB for the indicated proteins of mouse brain homogenate (H), non-synaptic fraction, synaptic membranes, and PSD-enriched fractions obtained from ctrl or PHD2NKO littermates.
Synaptop., synaptophysin. Densitometry of IBs as shown in (C)–(I) is shown in Figure S7. Scale bars, 1 μm (A) and 10 μm (B).
Also see Figure S7.
To confirm the localization of FLNA, we transfected MHNs with Turquoise2 (TQ2)-tagged FLNA (FLNAFLTQ2). In normoxia, FLNAFLTQ2 was detected in the somato-dendritic compartment, especially in the heads of mature dendritic spines (Figure 4B). In hypoxia, FLNAFLTQ2 was more widespread in the entire neuron, including in filopodia (Figure 4B). The C terminus part of FLNA (FLNACTTQ2), which does not bind actin, showed widespread distribution in MHNs independent of oxygen levels (Figure S7E). To provide biochemical confirmation, we prepared PSD fractions. FLNA was detected in all fractions, notably in the PSDs (Figure 4C; Figure S7F). Exposure of mice to hypoxia (8% O2) for 4 hr (a procedure upregulating HIF target genes; Figure S7G) altered FLNA levels and/or distribution (Figure 4C; Figure S7F). FLNA was especially increased in the non-synaptosomal membrane fraction (Figure 4C; Figure S7F). Thus, FLNA was detectable in dendritic spines and PSDs of neurons, and its localization and levels were influenced by hypoxia.
FLNA Is Stabilized by Hypoxia, DMOG, or PHD2 Knockdown
Hypoxia and DMOG regulated FLNA levels. Time-course studies in MHNs revealed that FLNA protein levels increased already within 15 min (for DMOG; data not shown) and remained elevated for several hours (Figures 4D and 4E; Figures S7H and S7I). This upregulation was independent of gene transcription or protein translation because Flna transcript levels were not induced during the first 4 hr (Figure S7J), and treatment of hypoxic MHNs with actinomycin D or cycloheximide did not prevent FLNA protein upregulation (Figure 4F; Figure S7K). However, FLNA was upregulated when normoxic MHNs were treated with the proteasomal inhibitor MG132 in a dose-dependent manner (Figures 4F and 4G; Figures S7K and S7L). The combination of hypoxia plus MG132 did not further elevate FLNA levels above those in hypoxia (data not shown), suggesting that hypoxia and proteasomal inhibition act via the same mechanism.
We transduced MHNs with scr or shPhd2 lentiviral vectors. IB revealed that Phd2 silencing increased FLNA levels (Figure 4H; Figure S7M). FLNA levels were also higher in homogenates and non-synaptosomal fractions of PHD2NKO brains (Figure 4I; Figures S7N–S7S). Thus, oxygenation and PHD2 regulated FLNA protein levels via a mechanism involving proteasomal degradation.
PHD2 Interacts with Domains D21–D23 of FLNA
Prompted by the similarities between the regulation of FLNA and HIF-1α by the PHD2/proteasome axis (Epstein et al., 2001), we hypothesized that FLNA was a target of PHD2-mediated proline hydroxylation and that hydroxylated FLNA underwent ubiquitination and proteasomal degradation. We first tested whether FLNA interacted with PHD2. We co-transfected HEK293T cells with myc-tagged FLNA (mycFLNAFL) and PHD2WTYFP or PHD2MUTYFP. Co-immunoprecipitation (coIP) showed that PHD2WTYFP and PHD2MUTYFP interacted with mycFLNAFL (Figure 5A). FLNA and PHD2 also formed a complex in brain PSDs but not in the non-synaptic fraction (Figure 5B; Figure S8A).
Figure 5.

Analysis of Filamin A as a PHD2 Target
(A) Representative IB for YFP and myc after IP of mycFLNAFL from HEK293T cells co-expressing mycFLNAFL and PHD2WTYFP or PHD2MUTYFP. Total lysates are shown below.
(B) Representative IB for FLNA and PHD2 after IP of PHD2 in mouse brain homogenate, non-synaptic fraction, synaptic membranes, and PSD fractions. Total lysates are shown below.
(C) Top: diagrams of the domains of full-length (FL) and deletion constructs of FLNA. 1–24, IgG repeats; H1 and H2, hinges. Bottom: representative IB for myc and YFP after IP of myc-tagged FLNA deletion mutants co-expressed with PHD2MUTYFP in HEK293T cells. Arrows indicate myc-tagged proteins and PHD2MUTYFP. Asterisks indicate aspecific bands.
(D) Representative fluorescence lifetime images (FLIM) and life time measurements of FLNACTTQ2 when transfected alone or in combination with YFP, PHD2WTYFP, or PHD2MUTYFP in HEK293T cells (mean ± SEM, n ≥ 50 cells).
(E) Representative IB for hydroxyprolines (OH-Pro) or myc after IP of mycFLNAFL from HEK293T cells transfected with mycFLNAFL and treated for 2 hr with MG132 or lactacystin (L). Total lysates are shown below.
(F) Representative IB and densitometric quantification for FLNA and OH-Pro after IP with control IgG (left) or specific antibodies for FLNA (right) of brain homogenates from P10 rats housed in ctrl or hypoxia chambers.
(G) MS/MS fragmentation spectra of unmodified (a, from control HEK293T cells) and hydroxylated (b, from PHD2WTYFP-transfected HEK293T cells treated with MG132 for 2 hr) P2316 in FNEEHIPDSPFVVPVASPSGDAR of FLNA, focusing on the fragment ion (y10), showing a mass shift of 16 Da upon hydroxylation. Complete spectra are shown in Figure S8G.
(H) Representative IB for the indicated proteins after IP of myc in HEK293T cells co-transfected with PHD2WTYFP together with mycFLNAD21–D23-WT, mycFLNAD21–D23-P2309A, or mycFLNAD21–D23-P2316A and subjected to ctrl (left) or DMOG (right) treatment. Total lysates are shown below.
Also see Figure S8.
FLNA contains an actin binding domain (ABD), 24 immunoglobulin G (IgG) domains (D1–D24), and two flexible regions (hinges H1 and H2) (Stossel et al., 2001, Zhou et al., 2010). To analyze which domains of FLNA interacted with PHD2, we generated five myc-tagged deletion variants of FLNA lacking domains known to interact with different binding partners (Zhou et al., 2010; Figure 5C). Proper folding of the FLNA variants was confirmed because mycFLNANT and mycFLNAD12–D20 mutants bound to F-actin (data not shown), and mycFLNACT and mycFLNAH2–D24 mutants (comprising the D24 dimerization domain) interacted with endogenous FLNA (Figure S8B). CoIPs showed that PHD2WTYFP and PHD2MUTYFP interacted with the deletion mutants mycFLNACT and mycFLNAD21–D23 but not with other domains (Figure 5C; Figure S8C; data not shown). Complex detection was enhanced when using PHD2MUTYFP, suggesting that they were stabilized in the absence of hydroxylation (Figure S8C).
We confirmed the PHD2-FLNA interaction by using fluorescence lifetime imaging microscopy (FLIM) to map the fluorescence resonance energy transfer (FRET) between the donor FLNACTTQ2 and the acceptor PHD2-YFP (using YFP as a control). Co-expression of FLNACTTQ2 and YFP did not change the fluorescence lifetime of the donor (Figure 5D). In contrast, co-expression of FLNACTTQ2 and PHD2WTYFP increased FRET, as evidenced by the reduced TQ2 fluorescence lifetime (Figure 5D), indicating that they formed a complex in the range of 1–10 nm. Similar results were obtained when using PHD2MUTYFP (Figure 5D). Thus, amino acid residues 2250–2508 in FLNA were necessary for FLNA-PHD2 binding, but the hydroxylation activity of PHD2 per se was not required.
PHD2 Hydroxylates Proline Residues P2309 and P2316 in FLNA
Although PHDs hydroxylate prolines in HIF-1α by recognizing an LXXLAP motif, other PHD targets lack such a motif (Wong et al., 2013). The mycFLNAD21–D23-WT fragment contains 20 prolines but none in an LXXLAP motif (Figure S8D). We examined the ability of each proline to interact with PHD2 by generating glutathione S-transferase (GST) fusion peptides, each containing a proline together with six up- and downstream flanking residues (Song et al., 2013). GST fusion peptides were incubated with homogenates of HEK293T cells expressing PHD2MUTYFP. IB of precipitated complexes revealed that only peptides containing the prolines P2270, P2309, P2316, P2320, P2404, and P2439 interacted with PHD2 (Figure S8E). A weaker interaction was observed with peptides containing P2294 and P2312.
To analyze whether PHD2 hydroxylated FLNA prolines, we used an antibody specific for hydroxylated prolines (OH-Pro). HEK293T cells were transfected with mycFLNAFL and treated with the proteasomal inhibitors MG132 or lactacystin, showing that proteasome inhibition increased FLNA hydroxylation (Figure 5E; Figure S8F). FLNA was also hydroxylated in vivo, and hydroxylation was reduced in rats exposed to hypoxia (8% O2; Figure 5F).
To identify which prolines were hydroxylated by PHD2, we transfected HEK293T cells with plasmids encoding mycFLNAD21–D23-WT alone or together with PHD2WTYFP. Cells were treated with vehicle or MG132, and immunoprecipitated mycFLNAD21–D23-WT was digested for liquid chromatography-mass spectrometry (LC-MS). Basal levels of OH-Pro of mycFLNAD21–D23-WT were detected in transfected cells. Hydroxylation of residues P2309, P2312, and P2316 in FNEEHIP∗DSP∗FVVP∗VASPSGDAR (P∗: OH-Pro) were enhanced in double-transfected cells. The probability of hydroxylation was P2316 > P2309 > P2312, identifying P2316 and P2309 as the most probable PHD2 hydroxylation sites (Figure 5G; Figure S8G; data not shown).
We also mutated P2309 and P2316 to alanine (mycFLNAD21–D23-P2309A, mycFLNAD21–D23-P2316A) and tested their binding to PHD2 and hydroxylation upon co-transfection with PHD2WTYFP. Although both sequence mutants interacted with PHD2WTYFP, they were less hydroxylated than mycFLNAD21–D23-WT (Figure 5H; Figure S8H). Moreover, in the presence of DMOG, hydroxylation of mycFLNAD21–D23-WT was reduced to levels obtained with both sequence mutants (Figure 5H; Figure S8H), suggesting that PHD2 contributes to FLNA hydroxylation at P2309 and P2316.
VHL Regulates FLNA Protein Levels
VHL ubiquitinates hydroxylated HIFα to mark it for proteasomal degradation (Ivan et al., 2001, Jaakkola et al., 2001). Because FLNA interacts with VHL (Tsuchiya et al., 1996), and VHL was present in the PSDs (Figure 4C), we explored whether VHL mediated FLNA ubiquitination. We first validated the interaction between VHL and FLNA in MG132-treated HEK293T cells cotransfected with HA-tagged VHL (HA-VHL) and mycFLNAFL (Figure 6A). FLNA deletion mutants showed that VHL bound to mycFLNACT and mycFLNAD21–D23-WT (Figure 6B; data not shown for mycFLNANT and mycFLNAD11–D20). The single mutants mycFLNAD21–D23-P2309A and mycFLNAD21–D23-P2316A were still able to interact with VHL, whereas the triple mutant P2309/2312/2316A (mycFLNAD21–D23-3P→A) showed a weaker interaction (Figure 6C; Figure S9A). Taken together, our results suggest that hydroxylation of P2309, P2316, and possibly P2312 was required for the interaction of FLNA with VHL.
Figure 6.

Analysis of Filamin A Interaction with VHL
(A) Representative IB for myc and HA after IP of myc from HEK293T cells transfected with mycFLNAFL and HA-VHL. Total lysates are shown below.
(B) Representative IB for myc and HA after IP of myc from HEK293T cells transfected with mycFLNACT, mycFLNAD21–D23-WT, or mycFLNAH2-D24 together with HA-VHL (left). Total lysates are shown (right). Arrowheads indicate myc-tagged proteins. Asterisks indicate IgGs used for the IP.
(C) Representative IB for myc and HA after IP of myc from HEK293T cells transfected with HA-VHL alone or co-transfected with mycFLNAD21–D23-WT, mycFLNAD21–D23-P2309A, mycFLNAD21–D23-P2316A, or mycFLNAD21–D23-3P→A mutants. Total lysates are shown below.
(D) Representative IB for FLNA and tubulin in MHNs transduced with a control shRNA (scr) or shVhl (left). Also shown is densitometric quantification of FLNA protein levels (right, mean ± SEM, n = 3, ∗p < 0.05).
(E and F) Representative IBs for FLNA, HIF-1α, and tubulin (E) or for FLNA, hydroxyprolines (OH-Pro), and tubulin (F) of brain homogenates from E14.5 ctrl or VHLNKO littermates.
(G) Representative IB for FLNA and tubulin after TUBE2 pull-down of brain homogenates obtained from E14.5 ctrl or VHLNKO littermates. Total lysates are shown below.
Also see Figure S9.
We then evaluated whether Vhl silencing increased FLNA levels. Transduction of MHNs with a lentivirus expressing scr or Vhl-specific shRNA (shVhl, reducing VHL levels by 67% ± 4%; n = 3; p < 0.05) showed higher FLNA protein levels in VHL-silenced neurons (Figure 6D). To confirm that VHL regulates FLNA levels in vivo, we generated VHLNKO mice by crossing Vhllox/lox mice with NestinCre mice. Because these mice are lethal at E16.5, we made brain homogenates from E14.5 control or VHLNKO littermates. As expected, HIF-1α levels were increased in VHLNKO embryos (Figure 6E). Notably, FLNA levels were higher in VHLNKO mice (Figure 6E; Figure S9B). We analyzed whether VHL deficiency increased the levels of hydroxylated FLNA. Because protein abundance in E14.5 embryo brains was insufficient for IP, E14.5 VHLNKO brain extracts were blotted for OH-Pro and reblotted thereafter for FLNA. This analysis showed that the increased FLNA levels were comparably hydroxylated in VHLNKO mice (Figure 6F; Figures S9C–S9E), suggesting that proline-hydroxylated FLNA was stabilized in the absence of VHL in vivo.
VHL Ubiquitinates FLNA
We then assessed whether the interaction of hydroxylated FLNA with VHL resulted in FLNA ubiquitination. Brains from E14.5 VHLNKO and control littermates were collected in the presence of MG132 and PR-619. Tandem ubiquitin binding entities (TUBE) pull-down of poly-ubiquitinated proteins followed by IB showed that FLNA was ubiquitinated less in VHLNKO brains (Figure 6G; Figure S9F).
FLNA Levels Determine Dendritic Spine Morphology
We assessed whether FLNA stabilization was responsible for the remodeling of dendritic spines to a more immature state. Because forced overexpression of full-length FLNA was toxic (data not shown), we used another strategy to elevate endogenous FLNA to physiological levels. We took advantage of the observation that overexpression of mycFLNAD21–D23-WT increased the levels of endogenous FLNA 2-fold (Figures 4H and 7A; Figure S7M), akin to the effect of hypoxia, DMOG, or Phd2 silencing (Figures 4D–4F, 4H, and 7A; Figures S7H, S7I, S7K, and S7M). FLNAD21–D23-WT elevated FLNA levels by impairing the interaction between endogenous FLNA and PHD2 because less PHD2 was coimmunoprecipitated with mycFLNAFL in the presence of GST-FLNAD21–D23-WT (Figure 7B). We therefore tested whether mycFLNAD21–D23-WT expression, and concomitant elevated FLNA levels, impaired dendritic spine maturation. MHNs transfected with mycFLNAD21–D23-WT had fewer and less mature dendritic spines (Figures 7C, 7D, and 7F–7H) and formed fewer synaptic contacts (Figures 7I–7L), comparable with the response to hypoxia (hypoxia versus mycFLNAD21–D23-WT, p > 0.05 for all parameters; data not shown).
Figure 7.

The Effect of Filamin A Upregulation on Spine Maturation
(A) Representative IB for FLNA, myc, and actin in HEK293T cells under control or hypoxia (0.2% O2) conditions or after transfection with mycFLNAD21–D23-WT (left). Also shown is densitometric quantification of FLNA (right).
(B) Representative IB for myc and YFP after IP of myc in the presence of recombinant GST or GST-FLNAD21–D23 proteins from homogenates of HEK293T cells co-transfected with mycFLNAFL and PHD2WTYFP. Left (input): total lysate control in co-transfected HEK293T cells. Densitometric quantification of the PHD2WTYFP/mycFLNAFL ratio is shown (n = 3, ∗p < 0.05).
(C–H), Representative images of tdT+ 14-DIV ctrl (C), mycFLNAD21–D23-WT (D), or mycFLNAD21–D23-3P→A (E) transfected MHNs. Also shown is quantification of protrusion density (F), protrusion length (G), and percentage of spines with a head (H) (n = 10 neurons, 324–731 protrusions).
(I–K′) Immunostaining of vGlut (green) and PSD-95 (red) (I′, J′, and K′) in 21-DIV tdT-transfected MHN (I–K) alone (I and I′) or together with mycFLNAD21–D23-WT (J and J′) or mycFLNAD21–D23-3P→A (K and K′). The contours of the dendrites in (I), (J), and (K) are indicated in (I′), (J′), and (K′), respectively.
(L) Quantification of the dendritic density of vGlut+/PSD-95+ co-clusters (n ≥ 20 neurons).
(M–P) Representative images of 14-DIV MHNs co-transfected with tdT together with scrambled control shRNA (M), shPhd2 (N), shFlna (O), or both shPhd2 and shFlna (P).
(Q–S) Quantification of protrusion density (Q), protrusion length (R), and percentage of spines with a head (S) (n ≥ 7 neurons, 7–22 dendrites, 170–832 protrusions).
Data are mean ± SEM. ∗p < 0.05, ∗∗∗p < 0.001 versus ctrl or scr. #p < 0.05, ##p < 0.01, ###p < 0.001 versus shPhd2 or mycFLNAD21–D23-WT. Scale bars, 5 μm.
Because FLNA also interacts with Rac and Cdc42, which promote mature spine formation (Nakamura et al., 2011, Tashiro and Yuste, 2004), a possible dominant-negative interaction of mycFLNAD21–D23-WT with these small GTPases might also contribute to the more immature spine phenotype of mycFLNAD21–D23-WT-expressing neurons. To assess the specificity of this peptide in mediating the PHD2-regulated FLNA degradation, we used the mycFLNAD21–D23-3P→A mutant. Notably, this mutant failed to impair spine maturation and synaptic contact formation (Figures 7E–7H, 7K, and 7L). Although we cannot formally exclude that mycFLNAD21–D23-WT perturbs the interaction with other binding partners of FLNA, the lack of an effect by mycFLNAD21–D23-3P→A strongly suggests that the effect of mycFLNAD21–D23-WT on spine morphology was due to its interaction with PHD2/VHL and to FLNA degradation rather than to non-specific dominant-negative interactions with other proteins. Notably, 14-DIV MHNs of E15.5 VHLNKO mice (containing higher levels of endogenous FLNA) also showed more immature dendritic spines (Figures S9G and S9H).
We explored whether Flna silencing reverted the phenotype induced by silencing Phd2. We co-transfected MHNs with tdT together with scr or Flna-specific shRNA (shFlna) alone or together with shPhd2. shFlna reduced FLNA protein levels by 59% ± 8% (n = 3, p < 0.05). Silencing of Flna in MHNs alone increased protrusion length without affecting the protrusion density or the number of spines with a head (Figures 7M–7S). However, in Phd2-silenced MHNs, Flna silencing largely prevented the switch to a more immature spine phenotype (Figures 7M–7S). Thus, FLNA is required for the spine morphology changes induced by PHD2 knockdown.
Discussion
Adaptation of Dendritic Spines to Hypoxia
Our study shows that oxygen, via PHD2, regulates dendritic spines and synaptic transmission. PHD2 coordinates rapid, reversible adaptations of spines, at least in part, by controlling FLNA levels. When oxygen is limited, PHD2 is inactivated, which diminishes proteasomal degradation of FLNA, thus inducing its stabilization and accumulation in non-synaptic locations and increasing the ratio of FLNA to F-actin. Based on reports in other cells (van der Flier and Sonnenberg, 2001), we speculate that the increased FLNA abundance results in remodeling of the actin cytoskeleton from a mesh network in mature spine heads to parallel F-actin bundles in headless immature elongated protrusions.
Our data suggest that diminished degradation of FLNA upon PHD2 inactivation in hypoxia rearranges the actin cytoskeleton to reduce the number of dendritic spines, synapses, and synaptic transmission without affecting intrinsic electrical membrane properties. Our findings are in line with a report showing that chemical inhibition of PHDs and PHD2 deficiency reduce long-term potentiation (Corcoran et al., 2013). Experiments targeting FLNAD21–D23 to dendritic spines by using a spine-targeting domain (such as of SG2NA; Gaillard et al., 2006) to inhibit PHD2 locally in the spines could be designed to confirm the model that PHD2 activity, locally at the spines, mediates spine maturation.
PHD2 Targets FLNA for Proteasomal Degradation
PHDs orchestrate the levels of target proteins via hydroxylation of prolines, although hydroxylation-independent activities have also been reported (Wong et al., 2013). Using a combination of biochemical, imaging, and site-directed mutagenesis methods, we show that PHD2 interacts with domains D21–D23 of FLNA and hydroxylates P2309 and P2316 (conserved in zebrafish, mouse, rat, and human), favoring its ubiquitination and proteasomal degradation. This FLNA/PHD2/VHL machinery is present in PSDs of dendritic spines. Inactivation of PHD2 hydroxylation activity or mutation of P2309 and P2316 to alanine impaired FLNA hydroxylation. Triple mutation of P2309, P2312, and P2316 reduced the interaction with VHL. Genetic studies in vitro and in vivo confirmed the importance of PHD2 and VHL in dendritic spine remodeling. Together, these studies identify FLNA as a target of PHD2 involved in the formation and maturation of dendritic spines.
In immortalized cell lines, hypoxia induces FLNA cleavage (Zheng et al., 2014). However, hypoxia or DMOG did not upregulate such an FLNA fragment in MHNs (data not shown), perhaps because the effects of hypoxia on FLNA levels are cell-type dependent or differ upon immortalization. In any case, FLNA protein levels in primary MHNs were increased—not decreased—upon exposure to hypoxia or DMOG. Although spine remodeling by PHD2 is HIF-independent, we cannot exclude that other PHD2 targets, apart from FLNA, influence spine remodeling.
Precise Regulation of FLNA Levels
Somewhat counterintuitively, both the modest elevation of FLNA (by mycFLNAD21–D23-WT) and silencing of Flna resulted in similar—although not exactly identical—spine changes. Indeed, silencing of Flna increased protrusion length without affecting the protrusion density or the number of spines with a head, whereas MHNs transfected with mycFLNAD21–D23-WT had fewer and less mature dendritic spines. This apparent contradiction likely relates to the well-known fact that FLNA interacts with several partners and has contextual effects and that FLNA protein levels require precise regulation. Indeed, both under- and overexpression of FLNA impair neuronal migration, although via distinct molecular mechanisms (Sarkisian et al., 2006, Zhang et al., 2012, Zhang et al., 2013). Furthermore, both loss and gain of FLNA/cheerio in humans and flies cause similar neurological defects, although distinct symptoms have also been reported (Bolduc et al., 2010, Zhou et al., 2010). All this suggests that FLNA protein levels must be tightly regulated in neurons. Our findings that FLNA is post-translationally regulated by PHD2-mediated hydroxylation and VHL-mediated ubiquitination unravel a molecular mechanism for the precise regulation of FLNA abundance, required for the proper formation and maintenance of synapses.
Physiological Relevance: A Hypothesis?
Our findings that hypoxia rapidly induces reversible spine regression may help to better understand how neurons adapt to a hypoxia challenge. Because synaptic transmission is a high-energy-consuming process and neurons rely on oxygen to produce ATP, one possible mechanism whereby neurons can avoid an energy crisis is by decreasing synaptic transmission through spine regression. Importantly, this remodeling is not irreversible (which would otherwise impair brain performance permanently), but PHD2/FLNA may provide a molecular mechanism for reversible spine maturation and re-establishment of synapses upon return to sufficient oxygen conditions. Although our study was not designed to provide direct proof for such a protective mechanism, previous reports support this hypothesis. First, when ATP production is compromised, dendritic arborization is impaired (Oruganty-Das et al., 2012). Second, both an increase in spine length and a rapid reversible spine retraction protect against excitotoxic damage in hypoxia (Araya et al., 2006, Meller et al., 2008). Third, in hypoperfused peri-infarct regions, neurons lower the number of mature spines and increase the length of protrusions to protect against excitotoxic overstimulation and to rewire new functional circuits (Brown et al., 2010).
Experimental Procedures
Detailed methods are described in the Supplemental Experimental Procedures.
Animals
Animal housing and procedures were approved by the Animal Ethics Committee of KU Leuven. We used Swiss, Phd2lox/lox, PHD2KO, NestinCre, Vhllox/lox, and Hif-1αlox/lox mice and Wistar rats. In utero electroporations were performed at E15.5. Pups were exposed to 8% O2 for 4 hr.
Cell Culture
Hippocampal neurons were isolated and cultured as described previously (Segura et al., 2007). Dendritic spines were analyzed at 14 DIV and synaptic densities at 21 DIV. HEK293T and rat PC12 cells were cultured as described. Hypoxic incubations were at 0.5%–1% (neurons) or 0.2% O2 (HEK293T). Transfections were done by Lipofectamine 2000 (neurons), calcium phosphate (HEK293T), or Nucleofection (PC12). Transductions were done as described in the Supplemental Experimental Procedures.
RNA and Protein Analysis
Immunoblotting, immunoprecipitations, and pull-downs were done as described. RNA expression analysis was done by in situ hybridization, RT-PCR, or RNA-seq. Immunostaining was performed on 4% paraformaldehyde (PFA)-fixed hippocampal neurons or thick free-floating brain cryo- or vibratome sections.
Mass Spectrometry
HEK293T cells transfected with mycFLNAD21–D23-WT with or without PHD2WTYFP were incubated with vehicle or 10 μM MG132 for 2 hr before lysis. Cell lysates were immunoprecipitated with anti-myc antibodies and fractionated by SDS-PAGE. The section containing mycFLNAD21–D23-WT was trypsinized in gel, and digested peptides were analyzed by nano-LC-MS/MS.
Imaging, Time Lapse, and Quantifications
Bright-field, fluorescent (time-lapse) confocal imaging, super-resolution imaging (SR-SIM), TEM, and time-domain FLIM were performed as described in the Supplemental Experimental Procedures. Morphometry (NIH ImageJ) was done blinded for the experimental conditions.
Cellular and Network Electrophysiology
Patch-clamp recordings in MHNs were performed as described previously (Reinartz et al., 2014). Extracellular recordings of the spontaneous network-level electrical activity, arising among neurons growing over multi-electrode arrays (MEAs), were performed as reported previously (Gambazzi et al., 2010).
Statistics
Experiments were performed at least three times. Data are expressed as mean ± SEM. Statistical differences were calculated by two-tailed unpaired t test for two datasets or ANOVA followed by Bonferroni post hoc test for multiple datasets using Prism (GraphPad). Statistical differences on data from MEAs were calculated by Wilcoxon rank-sum test. p < 0.05 was considered statistically significant.
Author Contributions
P.C. conceived the project. I.S., C.L., E.K., A.M., R.P., T.C., C.T., C.B., and B.G. performed the experiments and analyzed the data. I.S., C.L., E.K., A.M., R.P., G.E., T.C., C.T., M.M., B.G., M.G., C.R.A., M.D., and P.C. designed the experiments. D.D. and M.H. provided technical infrastructure, reagents, and expertise. I.S., C.L., M.D., and P.C. wrote the manuscript. All authors edited the paper.
Acknowledgments
We thank M.S. Ramer, L. Moons, R. Klein, and P. Maxwell for scientific discussion and critical reading of the manuscript. We thank R. Klein (Martinsreid) for the NestinCre mice, J. Blenis (Harvard) for pcDNA3-myc-hFLNA-WT, J. Goedhart (Amsterdam) for Turquoise2 plasmids, J. Livet (Paris) for the Brainbow1.0 plasmid, W. Kaelin (Harvard) for the HA-VHL plasmid, and J. de Wit (Leuven) for the vGlut1 antibody. We acknowledge L. Notebaert, M. Wijnants, D. van Dick, technical staff, and Vesalius Research Center core facilities. I.S. was supported by the Marie Curie FP7 program. I.S. and C.L. are postdoctoral fellows of the Research Foundation Flanders (FWO). C.T. was supported by European Research Council Starting Grant 281961–ASTROFUNC (to M.H.). This work was supported by Belgian Science Policy Grants IAP-P6/20 (to M.D.) and IAP-P7/20 (to M.D. and M.G.); EC-FP7 Grants 264872–NAMASEN, 306502–BRAINLEAP, and 286403–NEUROACT (to M.G.), FWO Grants G.0671.12N (to P.C.), 1.5.244.11N (to I.S.), and G088812N (to M.G.); and long-term structural Methusalem funding by the Flemish government and the Foundation Leducq Transatlantic Network (ARTEMIS) (to P.C.).
Published: March 10, 2016
Footnotes
This is an open access article under the CC BY-NC-ND license (http://creativecommons.org/licenses/by-nc-nd/4.0/).
Supplemental Information includes Supplemental Experimental Procedures and nine figures and can be found with this article online at http://dx.doi.org/10.1016/j.celrep.2016.02.047.
Supplemental Information
References
- Araya R., Jiang J., Eisenthal K.B., Yuste R. The spine neck filters membrane potentials. Proc. Natl. Acad. Sci. USA. 2006;103:17961–17966. doi: 10.1073/pnas.0608755103. [DOI] [PMC free article] [PubMed] [Google Scholar]
- Bolduc F.V., Bell K., Rosenfelt C., Cox H., Tully T. Fragile x mental retardation 1 and filamin a interact genetically in Drosophila long-term memory. Front. Neural Circuits. 2010;3:22. doi: 10.3389/neuro.04.022.2009. [DOI] [PMC free article] [PubMed] [Google Scholar]
- Brown C.E., Boyd J.D., Murphy T.H. Longitudinal in vivo imaging reveals balanced and branch-specific remodeling of mature cortical pyramidal dendritic arbors after stroke. J. Cereb. Blood Flow Metab. 2010;30:783–791. doi: 10.1038/jcbfm.2009.241. [DOI] [PMC free article] [PubMed] [Google Scholar]
- Cho K.O., Hunt C.A., Kennedy M.B. The rat brain postsynaptic density fraction contains a homolog of the Drosophila discs-large tumor suppressor protein. Neuron. 1992;9:929–942. doi: 10.1016/0896-6273(92)90245-9. [DOI] [PubMed] [Google Scholar]
- Corcoran A., Kunze R., Harney S.C., Breier G., Marti H.H., O’Connor J.J. A role for prolyl hydroxylase domain proteins in hippocampal synaptic plasticity. Hippocampus. 2013;23:861–872. doi: 10.1002/hipo.22142. [DOI] [PubMed] [Google Scholar]
- Epstein A.C., Gleadle J.M., McNeill L.A., Hewitson K.S., O’Rourke J., Mole D.R., Mukherji M., Metzen E., Wilson M.I., Dhanda A. C. elegans EGL-9 and mammalian homologs define a family of dioxygenases that regulate HIF by prolyl hydroxylation. Cell. 2001;107:43–54. doi: 10.1016/s0092-8674(01)00507-4. [DOI] [PubMed] [Google Scholar]
- Erecińska M., Silver I.A. Tissue oxygen tension and brain sensitivity to hypoxia. Respir. Physiol. 2001;128:263–276. doi: 10.1016/s0034-5687(01)00306-1. [DOI] [PubMed] [Google Scholar]
- Ethell I.M., Pasquale E.B. Molecular mechanisms of dendritic spine development and remodeling. Prog. Neurobiol. 2005;75:161–205. doi: 10.1016/j.pneurobio.2005.02.003. [DOI] [PubMed] [Google Scholar]
- Gaillard S., Bailly Y., Benoist M., Rakitina T., Kessler J.P., Fronzaroli-Molinières L., Dargent B., Castets F. Targeting of proteins of the striatin family to dendritic spines: role of the coiled-coil domain. Traffic. 2006;7:74–84. doi: 10.1111/j.1600-0854.2005.00363.x. [DOI] [PubMed] [Google Scholar]
- Gambazzi L., Gokce O., Seredenina T., Katsyuba E., Runne H., Markram H., Giugliano M., Luthi-Carter R. Diminished activity-dependent brain-derived neurotrophic factor expression underlies cortical neuron microcircuit hypoconnectivity resulting from exposure to mutant huntingtin fragments. J. Pharmacol. Exp. Ther. 2010;335:13–22. doi: 10.1124/jpet.110.167551. [DOI] [PubMed] [Google Scholar]
- Hotulainen P., Hoogenraad C.C. Actin in dendritic spines: connecting dynamics to function. J. Cell Biol. 2010;189:619–629. doi: 10.1083/jcb.201003008. [DOI] [PMC free article] [PubMed] [Google Scholar]
- Ivan M., Kondo K., Yang H., Kim W., Valiando J., Ohh M., Salic A., Asara J.M., Lane W.S., Kaelin W.G., Jr. HIFalpha targeted for VHL-mediated destruction by proline hydroxylation: implications for O2 sensing. Science. 2001;292:464–468. doi: 10.1126/science.1059817. [DOI] [PubMed] [Google Scholar]
- Jaakkola P., Mole D.R., Tian Y.M., Wilson M.I., Gielbert J., Gaskell S.J., von Kriegsheim A., Hebestreit H.F., Mukherji M., Schofield C.J. Targeting of HIF-alpha to the von Hippel-Lindau ubiquitylation complex by O2-regulated prolyl hydroxylation. Science. 2001;292:468–472. doi: 10.1126/science.1059796. [DOI] [PubMed] [Google Scholar]
- Mazzone M., Dettori D., Leite de Oliveira R., Loges S., Schmidt T., Jonckx B., Tian Y.M., Lanahan A.A., Pollard P., Ruiz de Almodovar C. Heterozygous deficiency of PHD2 restores tumor oxygenation and inhibits metastasis via endothelial normalization. Cell. 2009;136:839–851. doi: 10.1016/j.cell.2009.01.020. [DOI] [PMC free article] [PubMed] [Google Scholar]
- Meller R., Thompson S.J., Lusardi T.A., Ordonez A.N., Ashley M.D., Jessick V., Wang W., Torrey D.J., Henshall D.C., Gafken P.R. Ubiquitin proteasome-mediated synaptic reorganization: a novel mechanism underlying rapid ischemic tolerance. J. Neurosci. 2008;28:50–59. doi: 10.1523/JNEUROSCI.3474-07.2008. [DOI] [PMC free article] [PubMed] [Google Scholar]
- Nakamura F., Stossel T.P., Hartwig J.H. The filamins: organizers of cell structure and function. Cell Adhes. Migr. 2011;5:160–169. doi: 10.4161/cam.5.2.14401. [DOI] [PMC free article] [PubMed] [Google Scholar]
- Nestor M.W., Cai X., Stone M.R., Bloch R.J., Thompson S.M. The actin binding domain of βI-spectrin regulates the morphological and functional dynamics of dendritic spines. PLoS ONE. 2011;6:e16197. doi: 10.1371/journal.pone.0016197. [DOI] [PMC free article] [PubMed] [Google Scholar]
- Noam Y., Phan L., McClelland S., Manders E.M., Ehrengruber M.U., Wadman W.J., Baram T.Z., Chen Y. Distinct regional and subcellular localization of the actin-binding protein filamin A in the mature rat brain. J. Comp. Neurol. 2012;520:3013–3034. doi: 10.1002/cne.23106. [DOI] [PMC free article] [PubMed] [Google Scholar]
- Nwabuisi-Heath E., LaDu M.J., Yu C. Simultaneous analysis of dendritic spine density, morphology and excitatory glutamate receptors during neuron maturation in vitro by quantitative immunocytochemistry. J. Neurosci. Methods. 2012;207:137–147. doi: 10.1016/j.jneumeth.2012.04.003. [DOI] [PMC free article] [PubMed] [Google Scholar]
- Oruganty-Das A., Ng T., Udagawa T., Goh E.L., Richter J.D. Translational control of mitochondrial energy production mediates neuron morphogenesis. Cell Metab. 2012;16:789–800. doi: 10.1016/j.cmet.2012.11.002. [DOI] [PMC free article] [PubMed] [Google Scholar]
- Pacary E., Haas M.A., Wildner H., Azzarelli R., Bell D.M., Abrous D.N., Guillemot F. Visualization and genetic manipulation of dendrites and spines in the mouse cerebral cortex and hippocampus using in utero electroporation. J. Vis. Exp. 2012;26:4163. doi: 10.3791/4163. [DOI] [PMC free article] [PubMed] [Google Scholar]
- Reinartz S., Biro I., Gal A., Giugliano M., Marom S. Synaptic dynamics contribute to long-term single neuron response fluctuations. Front. Neural Circuits. 2014;8:71. doi: 10.3389/fncir.2014.00071. [DOI] [PMC free article] [PubMed] [Google Scholar]
- Sarkisian M.R., Bartley C.M., Chi H., Nakamura F., Hashimoto-Torii K., Torii M., Flavell R.A., Rakic P. MEKK4 signaling regulates filamin expression and neuronal migration. Neuron. 2006;52:789–801. doi: 10.1016/j.neuron.2006.10.024. [DOI] [PMC free article] [PubMed] [Google Scholar]
- Segura I., Essmann C.L., Weinges S., Acker-Palmer A. Grb4 and GIT1 transduce ephrinB reverse signals modulating spine morphogenesis and synapse formation. Nat. Neurosci. 2007;10:301–310. doi: 10.1038/nn1858. [DOI] [PubMed] [Google Scholar]
- Song D., Li L.S., Heaton-Johnson K.J., Arsenault P.R., Master S.R., Lee F.S. Prolyl hydroxylase domain protein 2 (PHD2) binds a Pro-Xaa-Leu-Glu motif, linking it to the heat shock protein 90 pathway. J. Biol. Chem. 2013;288:9662–9674. doi: 10.1074/jbc.M112.440552. [DOI] [PMC free article] [PubMed] [Google Scholar]
- Stossel T.P., Condeelis J., Cooley L., Hartwig J.H., Noegel A., Schleicher M., Shapiro S.S. Filamins as integrators of cell mechanics and signalling. Nat. Rev. Mol. Cell Biol. 2001;2:138–145. doi: 10.1038/35052082. [DOI] [PubMed] [Google Scholar]
- Tashiro A., Yuste R. Regulation of dendritic spine motility and stability by Rac1 and Rho kinase: evidence for two forms of spine motility. Mol. Cell. Neurosci. 2004;26:429–440. doi: 10.1016/j.mcn.2004.04.001. [DOI] [PubMed] [Google Scholar]
- Tsuchiya H., Iseda T., Hino O. Identification of a novel protein (VBP-1) binding to the von Hippel-Lindau (VHL) tumor suppressor gene product. Cancer Res. 1996;56:2881–2885. [PubMed] [Google Scholar]
- van der Flier A., Sonnenberg A. Structural and functional aspects of filamins. Biochim. Biophys. Acta. 2001;1538:99–117. doi: 10.1016/s0167-4889(01)00072-6. [DOI] [PubMed] [Google Scholar]
- Vogel S., Wottawa M., Farhat K., Zieseniss A., Schnelle M., Le-Huu S., von Ahlen M., Malz C., Camenisch G., Katschinski D.M. Prolyl hydroxylase domain (PHD) 2 affects cell migration and F-actin formation via RhoA/rho-associated kinase-dependent cofilin phosphorylation. J. Biol. Chem. 2010;285:33756–33763. doi: 10.1074/jbc.M110.132985. [DOI] [PMC free article] [PubMed] [Google Scholar]
- Wong B.W., Kuchnio A., Bruning U., Carmeliet P. Emerging novel functions of the oxygen-sensing prolyl hydroxylase domain enzymes. Trends Biochem. Sci. 2013;38:3–11. doi: 10.1016/j.tibs.2012.10.004. [DOI] [PubMed] [Google Scholar]
- Zhang J., Neal J., Lian G., Shi B., Ferland R.J., Sheen V. Brefeldin A-inhibited guanine exchange factor 2 regulates filamin A phosphorylation and neuronal migration. J. Neurosci. 2012;32:12619–12629. doi: 10.1523/JNEUROSCI.1063-12.2012. [DOI] [PMC free article] [PubMed] [Google Scholar]
- Zhang J., Neal J., Lian G., Hu J., Lu J., Sheen V. Filamin A regulates neuronal migration through brefeldin A-inhibited guanine exchange factor 2-dependent Arf1 activation. J. Neurosci. 2013;33:15735–15746. doi: 10.1523/JNEUROSCI.1939-13.2013. [DOI] [PMC free article] [PubMed] [Google Scholar]
- Zhang L., Bartley C.M., Gong X., Hsieh L.S., Lin T.V., Feliciano D.M., Bordey A. MEK-ERK1/2-dependent FLNA overexpression promotes abnormal dendritic patterning in tuberous sclerosis independent of mTOR. Neuron. 2014;84:78–91. doi: 10.1016/j.neuron.2014.09.009. [DOI] [PMC free article] [PubMed] [Google Scholar]
- Zheng L., Michelson Y., Freger V., Avraham Z., Venken K.J., Bellen H.J., Justice M.J., Wides R. Drosophila Ten-m and filamin affect motor neuron growth cone guidance. PLoS ONE. 2011;6:e22956. doi: 10.1371/journal.pone.0022956. [DOI] [PMC free article] [PubMed] [Google Scholar]
- Zheng X., Zhou A.X., Rouhi P., Uramoto H., Borén J., Cao Y., Pereira T., Akyürek L.M., Poellinger L. Hypoxia-induced and calpain-dependent cleavage of filamin A regulates the hypoxic response. Proc. Natl. Acad. Sci. USA. 2014;111:2560–2565. doi: 10.1073/pnas.1320815111. [DOI] [PMC free article] [PubMed] [Google Scholar]
- Zhou A.X., Hartwig J.H., Akyürek L.M. Filamins in cell signaling, transcription and organ development. Trends Cell Biol. 2010;20:113–123. doi: 10.1016/j.tcb.2009.12.001. [DOI] [PubMed] [Google Scholar]
Associated Data
This section collects any data citations, data availability statements, or supplementary materials included in this article.