

Abstract
A novel functional‐genomics based concept of pharmacology that uses artificial intelligence techniques for mining and knowledge discovery in “big data” providing comprehensive information about the drugs’ targets and their functional genomics is proposed. In “process pharmacology”, drugs are associated with biological processes. This puts the disease, regarded as alterations in the activity in one or several cellular processes, in the focus of drug therapy. In this setting, the molecular drug targets are merely intermediates. The identification of drugs for therapeutic or repurposing is based on similarities in the high‐dimensional space of the biological processes that a drug influences. Applying this principle to data associated with lymphoblastic leukemia identified a short list of candidate drugs, including one that was recently proposed as novel rescue medication for lymphocytic leukemia. The pharmacological data science approach provides successful selections of drug candidates within development and repurposing tasks.
The conceptual framework of current pharmacological treatment of a disease is the administration of a drug to manipulate a gene product called the drug target. However, the physician's primary intention is not to alter the gene product but to produce a favorable modulation of a trait or disease. The drug targets steer the disease‐relevant biological processes within the organism. Drug targets are the intermediates between the drug and the disease at which the therapy is aimed. With the increasing accessibility of the world's knowledge about the action of drugs and about the biological roles of genes and, hence, drug targets, it becomes possible to influence processes as the role of the prescribed drugs rather than to influence targets.
Using pharmacological data science, we developed a novel concept of “process pharmacology” that puts the disease, defined via the biological processes involved in its pathophysiology, in the focus of drug therapy. The molecular drug targets merely act as the link between the drug and the modulated biological processes, thereby directly accommodating the therapeutic setting of treating a disease. The drug targets, respectively, their genetic determinants, are accessible in worldwide available databases. The biological roles of genes, respectively, gene products, can be queried in knowledge bases, such as the Gene Ontology (GO). These relate genes to locations in a cell, molecular functions, and biological processes. These biological processes are defined in functional genomics as a series of events or molecular functions with a defined beginning and end.1
In summary, using modern statistical and computational tools, drugs can be associated with particular biological processes.2 In the proposed framework of “process pharmacology”, traits or diseases are regarded as a result of alterations of the activity in one or several biological processes (Figure 1). Therapies can be directed toward modulating the activities of disease‐relevant biological processes, moving the genetically determined targets from the focus of classical pharmacological concepts toward mediation between drugs and biological processes.
Figure 1.
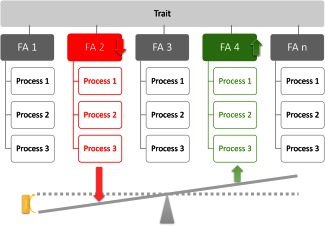
Split of a trait into several biological processes, which can, for example, be grouped as so‐called “functional areas” [2,.,n].2 According to the functional genomics approach at pharmacology, a trait or disease is viewed as resulting from alterations of the activity in one or a number of certain biological processes, for example activation (upregulation) of some processes (green) and/or downregulation of other processes (red). Treatment aims at reestablishing physiological degrees of process activity.
METHODS
In “process pharmacology,” drugs are ultimately connected with biological processes. Their molecular targets serve as the intermediates. This moves targets from the focus of classical pharmacological concepts to the link between drugs and biological processes. These processes become the main therapeutic focus. The necessary associations of drugs with targets, drug targets with genes, and genes with biological processes are possible by querying publically accessible databases using bioinformatics tools and computational methods. This provides a vector of biological processes associated to each drug. Subsequently, a similarity measure in the high‐dimensional space is possible to group drugs. This can be used to find repurposing candidates based on this similarity, or to identify drugs that promise to address biological processes identified elsewhere as being disease‐relevant (Figure 2). The methods are described in detail and exemplified in the following. The concept is emergent (i.e., new knowledge is discovered from available knowledge about drugs and diseases).
Figure 2.
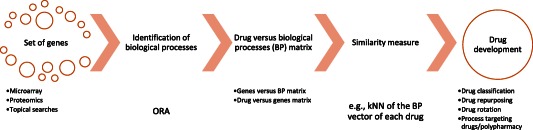
Scheme of the workflow of the proposed method of “process pharmacology” applying a functional‐genomics based data science approach to drug development and therapy. The concept starts from a set of genes associated with a trait, which was obtained by microarray, proteomic analyses, or from other sources, such as database query of topical gene sets. Following association of drugs with biological processes and using a similarity measure, drugs can now be searched for similarity among each other for repurposing, similarity with disease‐relevant processes for drug development, or dissimilarity for drug rotation.
Association of drugs with biological processes
The association of drugs with biological processes was obtained via the systems biology information available for the genes coding for the drug targets. This used computational biology and knowledge discovery methods to query the information in publicly available databases. Analyses were performed using the R version 3.2.1 for Linux (http://CRAN.R-project.org/) and Matlab (MathWorks, Natick, MA) software packages.
Associating drugs with genes
Comprehensive information about drugs and their molecular targets is available in publicly available databases. A standard in pharmacology is the DrugBank database3, 4 accessible at http://www.drugbank.ca (version 4.3). Querying this database provided the molecular drug targets coded as UniProt IDs (http://www.uniprot.org). These were converted to National Center for Biotechnology Information numbers of the coding genes using the DAVID database5 (http://david.abcc.ncifcrf.gov/conversion.jsp). A query of the DrugBank database in October 2015, identified 1,501 drugs interacting with a total of 1,384 unique targets. This provided a 1,501 × 1,384 “drug vs. gene” association matrix as the basis of subsequent computational analyses.
Associating genes with biological processes
The global knowledge about the roles of genes in an organism is represented in publicly accessible knowledge bases, of which the gold‐standard in functional genomics is the GO knowledgebase (http://www.geneontology.org/6). Genes are annotated to a controlled vocabulary of GO terms (categories) providing a canonical description of their known biological functions.7, 8 These are subdivided into molecular functions, cellular components, and biological processes. Relations among these biological functions are described as a polyhierarchy of GO terms.6 The particular biological roles of genes coding for drug targets could be identified by means of overrepresentation analysis.9 For the set of 1,384 genes, which are influenced by drugs, the overrepresentation analysis identifies subsets of these genes (targets) that address a particular GO term, among all terms of the GO, more frequent than expected by chance. For the deviation from chance, a conservative P value threshold, tp, of 1 · 10−10 with subsequent multiple testing error correction according to Bonferroni10 was applied. This calculation resulted in 794 GO terms, among all GO terms, which can be considered as specifically describing the biological processes in which the currently known 1,384 targets of the drugs are involved. This was captured in a “gene vs. biological process” matrix associating the 1,384 targets to 794 GO terms.
Associating drugs with biological processes
To associate drugs with biological processes, the 1,501 × 1,384 “drug vs. gene matrix” obtained from the DrugBank database had to be linked with the 1,384 × 794 “gene vs. biological process matrix” obtained from the GO database with subsequent overrepresentation analysis. If a drug is related to a gene and this particular gene is annotated to a biological process, then this establishes one connection of a drug to a biological process. The sum of all such interactions articulates the strength of the connection mediated via the molecular function of the particular genes. This was obtained as the scalar product of the two matrices (i.e., the “drug vs. gene matrix” and “gene vs. biological process matrix”). Their scalar product provided the desired 1,384 × 794 “drug vs. biological process” matrix as the basis of the functional‐genomics based concept of “process pharmacology.” The 1,384 × 794 “drug vs. biological process” matrix associated each drug with a 794 item‐long vector of biological functions. The contents correspond to the number of the drug's target genes annotated to this particular process.
Analysis of drug and process dissimilarity and similarity
Definition and validation of a similarity measure
The identification of drugs for therapeutic or repurposing aims is based on similarities in the high‐dimensional vector space of each drug's functional genomics. Therefore, a process‐based similarity measure for drugs was defined as a scaled version of the Euclidean distance on the “drug vs. biological process” matrix. The validity of this measure was tested for the 77 drugs with analgesic effects queried from the DrugBank. In 50 repeated experiments, 20% (n = 17) of these analgesics were extracted from the dataset, splitting the dataset into a set A of 1,372 drugs and a set B of 17 drugs. The term vector of each analgesic (set B) was compared to set A using the described similarity. The most frequent classification of the k = 3 most similar drugs was used as calculated classification of the set B. For 50 repeated experiments, this resulted in an average classification accuracy of 98.2% ± 2.97%. This supports the applicability of the similarity measure.
Identification of antihypertensive drug classes and subclasses
As a proof‐of‐concept bioinformatics “experiment”, the classification of antihypertensive drugs was assessed. A broad selection of 112 drugs used presently or in the past or at least qualifying as antihypertensive drugs was queried from the DrugBank database (Table 1). First, these drugs were classified based on empirical pharmacological knowledge into 8 classes comprising angiotensin‐converting enzyme inhibitors, AT1 antagonists, β‐blockers, catechol or dopaminergic modulators, diuretics, calcium channel blockers, nitric compounds, and others. Subsequently, the drugs were classified again by applying a machine‐learned algorithm on the GO term vector associated with each drug. A high‐dimensional multivariate analysis was performed using an emergent self‐organizing map to project the 794 dimensional dataset onto a two‐dimensional toroid grid11 of so‐called neurons with 20 rows and 30 columns (n = 600 units). In contrast with classical projection algorithms, such as, for example, principal component analysis or multidimensional scaling, this type of projection preserves complex cluster structures. Cluster structures can be detected on top of the neuron grid using a so‐called U‐Matrix.12, 13 This displays the distances in the high‐dimensional space as heights.12, 13 A geographical map analogy using watersheds was used to indicate borders of data clusters. The process was performed using the Databionic emergent self‐organizing map Tools,14 publicly available at http://www.uni-marburg.de/fb12/datenbionik/software. An excellent agreement between these assigned classes and the pharmaceutical classification was observed.
Table 1.
Classes of antihypertensive drugs according to pharmacological classification (“Pharma class”)
| Drug | Pharma class | Assigned class | Drug | Pharma class | Assigned class | Drug | Pharma class | Assigned class | Drug | Pharma class | Assigned class |
|---|---|---|---|---|---|---|---|---|---|---|---|
| Ramipril | 1 | 1 | Atenolol | 3 | 3 | Phenoxybenzamine | 4 | 4 | Torasemide | 5 | 6 |
| Fosinopril | 1 | 1 | Timolol | 3 | 3 | Guanfacine | 4 | 4 | Chlorthalidone | 5 | 6 |
| Trandolapril | 1 | 1 | Carteolol | 3 | 3 | Lofexidine | 4 | 4 | Metolazone | 5 | 6 |
| Benazepril | 1 | 1 | Propranolol | 3 | 3 | Alfuzosin | 4 | 9 | Chlormerodrin | 5 | 6 |
| Enalapril | 1 | 1 | Labetalol | 3 | 3 | Doxazosin | 4 | 9 | Eplerenone | 5 | 6 |
| Candoxatril | 1 | 1 | Bisoprolol | 3 | 3 | Tamsulosin | 4 | 9 | Hydralazine | 5 | 6 |
| Moexipril | 1 | 1 | Alprenolol | 3 | 3 | Terazosin | 4 | 9 | Polythiazide | 5 | 6 |
| Lisinopril | 1 | 1 | Pindolol | 3 | 3 | Silodosin | 4 | 9 | Spironolactone | 5 | 7 |
| Perindopril | 1 | 1 | Acebutolol | 3 | 3 | Fenoldopam | 4 | 4 | Remikiren | 6 | 6 |
| Quinapril | 1 | 1 | Nadolol | 3 | 3 | Methyldopa | 4 | 4 | Cinnarizine | 7 | 4 |
| Rescinnamine | 1 | 1 | Levobunolol | 3 | 3 | Methyclothiazide | 5 | 5 | Nicardipine | 7 | 4 |
| Captopril | 1 | 1 | Metipranolol | 3 | 3 | Bendroflumethiazide | 5 | 5 | Felodipine | 7 | 4 |
| Cilazapril | 1 | 1 | Bevantolol | 3 | 3 | Benzthiazide | 5 | 5 | Nifedipine | 7 | 4 |
| Spirapril | 1 | 1 | Practolol | 3 | 3 | Cyclothiazide | 5 | 5 | Diltiazem | 7 | 6 |
| Valsartan | 2 | 2 | Penbutolol | 3 | 3 | Furosemide | 5 | 5 | Lercanidipine | 7 | 6 |
| Olmesartan | 2 | 2 | Oxprenolol | 3 | 3 | Methazolamide | 5 | 5 | Isradipine | 7 | 7 |
| Losartan | 2 | 2 | Nebivolol | 3 | 3 | Hydroflumethiazide | 5 | 5 | Amlodipine | 7 | 7 |
| Candesartan | 2 | 2 | Bopindolol | 3 | 3 | Acetazolamide | 5 | 5 | Nimodipine | 7 | 7 |
| Eprosartan | 2 | 2 | Bupranolol | 3 | 3 | Dorzolamide | 5 | 5 | Nisoldipine | 7 | 7 |
| Forasartan | 2 | 2 | Carvedilol | 3 | 4 | Chlorothiazide | 5 | 5 | Verapamil | 7 | 7 |
| Saprisartan | 2 | 2 | Bethanidine | 4 | 4 | Bumetanide | 5 | 5 | Nitrendipine | 7 | 7 |
| Azilsartan medoxomil | 2 | 2 | Prazosin | 4 | 4 | Ethacrynic acid | 5 | 5 | Clevidipine | 7 | 7 |
| Telmisartan | 2 | 10 | Clonidine | 4 | 4 | Hydrochlorothiazide | 5 | 5 | Nilvadipine | 7 | 7 |
| Irbesartan | 2 | 10 | Guanabenz | 4 | 4 | Trichlormethiazide | 5 | 5 | Nitroprusside | 8 | 8 |
| Tasosartan | 2 | 10 | Dexmedetomidine | 4 | 4 | Diazoxide | 5 | 5 | Nitroglycerin | 8 | 8 |
| Esmolol | 3 | 3 | Phentolamine | 4 | 4 | Diclofenamide | 5 | 5 | Isosorbide Dinitrate | 8 | 8 |
| Betaxolol | 3 | 3 | Tizanidine | 4 | 4 | Brinzolamide | 5 | 5 | Erythrityl Tetranitrate | 8 | 8 |
| Metoprolol | 3 | 3 | Tolazoline | 4 | 4 | Quinethazone | 5 | 5 | Nesiritide | 8 | 8 |
1 = ACE inhibitors; 2 = AT1 antagonists; 2 = β‐blocker; 3 = catechol or dopaminergic modulators; 4 = diuretics; 5 = calcium channel blockers; 6 = nitric compounds and others; and based on class assignment following emergent self‐organizing map‐based projection of the functional genomics of the drugs from the high‐dimensional space into a representable plane and subsequent cluster identification (Figure 2; “Assigned class”).
Analysis of analgesic drug similarity
Following the precedent experiment, which established that the concept is able to detect meaningful drug subclasses, process pharmacology was applied on the clinical problem of opioid rotation. This is an incompletely understood clinical observation indicating that a ceased opioid analgesia can occasionally be reestablished by changing the opioid.15 In the present context, the hypothesis was pursued that using dissimilar opioids with respect to their associated biological processes may be particularly suitable for this task. At this end, for the 77 different analgesic drugs, a high‐dimensional multivariate analysis was performed similarly as described above. An emergent self‐organizing map was used to project the 794 dimensional dataset onto a two‐dimensional toroid grid11 of neurons.
Analysis of drug and genomics similarity
The idea behind using functional genomics for drug repurposing is to use the similarity measure in the high‐dimensional vector space of the biological functions associated with the drugs. This can be used for the identification of substances qualifying for the treatment of certain traits in addition to already available options, or for the identification of substances that qualify for the therapeutic modulation of diseases defined by biological processes or functional areas (i.e., groups of related biological processes, known to contribute to a disease).
To assess this approach, a suitable disease‐relevant gene set was obtained from the MalaCards database16 of human maladies (http://www.malacards.org/, MCID: CHR090) comprised of 553 genes considered to be involved in chronic lymphatic leukemia (CLL). The biological processes associated with this set of genes were identified by means of an overrepresentation analysis, as described above for the set of drug target coding genes. Subsequently, a prototype of the biological processes characterizing leukemia was obtained as a total of 689 terms of which 299 were also terms of the biological process of drugs. The identification of drugs qualifying as treatments for the selected trait used a k nearest neighbors approach.17 Specifically, the 1,384 × 794 dissimilarity matrix resulting from distance analysis in the high‐dimensional vector space of the similarly sized “drug vs. biological process” matrix was searched for items that, in this space, were located at closest distances to the CLL prototype.
RESULTS
Functional genomic‐based drug classification
Antihypertensive drugs
Using the U‐Matrix, which displays the distances in the high‐dimensional space as heights, the 10 distinct pharmacological classes of antihypertensive drugs were well‐reflected in the projection of the high‐dimensional vector space of each drug's functional genomics and the clustering based on this unsupervised machine‐learned method (Figure 3). This led to a clear and, in the utmost cases, correct association of the drugs to the pharmacological classes of antihypertensives (Table 2). Moreover, the analysis was able to identify additional subgroups among the drugs not provided with the initial pharmacological classification, raising the original classification from 8 to 10 different classes. For example, the heterogeneously assembled pharmacological class of adrenergic modulators was divided into further clusters of which one contained mainly α2 adrenoceptor agonists, such as clonidine. The other was dominated by α1 adrenoceptor antagonist, such as doxasozine. Similarly, carvedilol, initially assigned to the β‐blockers, was correctly assigned to the α‐blocker, thus standing apart from its former class members consistent with its α‐blocking activity. The also heterogeneous class of diuretics was divided into at least two subclasses, which emphasizes that this group has members with different pharmacology.
Figure 3.
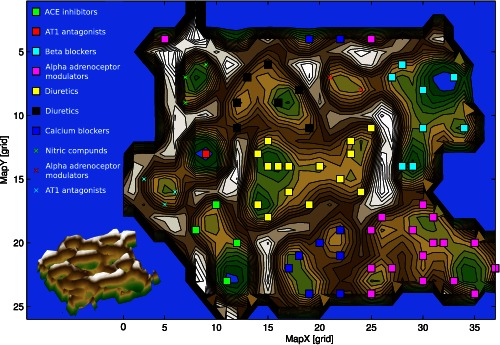
U‐Matrix top view (top) and three‐dimensional view (bottom) on a pseudo three‐dimensional map of the grouping of antihypertensive drugs in the high‐dimensional space. This is constructed by the vectors of each antihypertensive drug composed of the information about the drug's involvement in biological processes. The U‐Matrix32 is a representation of the distances in this space on top of a map space that consists of a two‐dimensional grid of 50 × 82 = 4200 units (“neurons”). The representation is intended for a geographical interpretation (for technical details of the presentation, see http://www.uni-marburg.de/fb12/datenbionik/forschung/esom). Brown or snow‐covered heights symbolizing large high‐dimensional distances between the antihypertensive drugs (see also the inserted three‐dimensional view of the same U‐Matrix at the bottom left corner), whereas green valleys or blue lakes represent small distances. In this geographical map analogy, the points (i.e., the “antihypertensives”), laying together in a valley of the U‐Matrix indicate that these drugs share a common pattern of biological processes (i.e., they are members of the same cluster). Watersheds in the U‐Matrix indicate borders between clusters. The dots represent the neurons, colored separately for each class of antihypertensives, that best represented a projection of the drugs functional genomics from the high dimensional onto the two‐dimensional space. The other neurons of the grid space are omitted. Please note that the projection grid is toroidal where opposite edges are connected. Classes of antihypertensives occurring twice indicate that the original pharmacologically assigned class had been identified as comprising subgroups, which were located at different places on the U‐Matrix.
Table 2.
Classes of analgesics drugs as identified following emergent self‐organizing map based projection of the functional‐genomics of the drugs from the high‐dimensional space into a representable plane and subsequent cluster identification (Figure 3).
| Class #1 | Class #2 | Class #3 | ||
|---|---|---|---|---|
| Buprenorphine | Alfentanil | Acetaminophen | Icosapent | Piroxicam |
| Butorphanol | Anileridine | Acetylsalicylic acid | Indomethacin | Pomalidomide |
| Codeine | Dextromethorphan | Aminosalicylic Acid | Ketoprofen | Salicylate‐sodium |
| Dextropropoxyphene | Dezocine | Antipyrine | Ketorolac | Salicylic acid |
| Diphenoxylate | Ethylmorphine | Antrafenine | Lenalidomide | Salsalate |
| Fentanyl | Ketobemidone | Balsalazide | Lornoxicam | Sulfasalazine |
| Heroin | Levomethadyl Acetate | Bromfenac | Lumiracoxib | Sulindac |
| Hydrocodone | Methadone | Carprofen | Magnesium salicylate | Suprofen |
| Hydromorphone | Methadyl Acetate | Celecoxib | Meclofenamic acid | Tenoxicam |
| Levorphanol | Pentazocine | Diclofenac | Mefenamic acid | Thalidomide |
| Morphine | Pethidine | Diflunisal | Meloxicam | Tiaprofenic acid |
| Oxycodone | Tapentadol | Dihomo‐gamma‐linolenic acid | Mesalazine | Tolmetin |
| Oxymorphone | Tramadol | Etodolac | Nabumetone | Trisalicylate‐choline |
| Remifentanil | Etoricoxib | Naproxen | ||
| Sufentanil | Fenoprofen | Nepafenac | ||
| Flurbiprofen | Niflumic Acid | |||
| Ginseng | Oxaprozin | |||
| Ibuprofen | Phenylbutazone |
Functional genomic‐based drug rotation
Analgesic drugs
Having established the ability of the approach to identify correct subclasses, a further U‐Matrix analysis was used on analgesic drugs. This identified three distinct clusters (Figure 4). A clear and flawless distinction between opioid and nonopioid analgesics was obtained; however, opioids formed two distinct subgroups (Table 2). Overrepresentation analysis indicated that these subgroups differed with respect to the importance of several biological processes. In particular, class II was characterized by a comparatively higher importance of positive regulation of protein phosphorylation (GO:0001934), which suggests a possible implication in opioid tolerance in which phosphorylation of opioid receptors is known to be involved.18 The association of methadone to this class, although morphine belonged to class I, supports this assumption. This is in line with actual laboratory research showing that methadone reversed the analgesic tolerance induced by morphine.19
Figure 4.
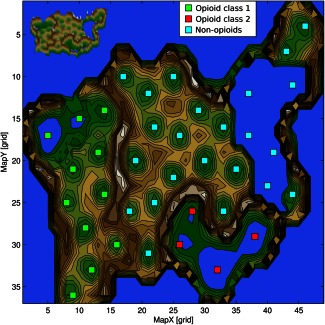
U‐Matrix (top view) on a pseudo three‐dimensional map of the grouping of analgesic drugs in the high‐dimensional space. This is constructed by the vectors of each analgesic drug composed of the information about the drug's involvement in biological processes. The U‐Matrix32 is a representation of the distances in this space on top of a map space that consists of a two‐dimensional grid of 50 × 82 = 4200 units (“neurons”). The representation is intended for a geographical interpretation (for technical details of the presentation, see http://www.uni‐marburg.de/fb12/datenbionik/forschung/esom). Brown or snow‐covered heights symbolizing large high‐dimensional distances between the analgesics (see also the inserted three‐dimensional view of the same U‐Matrix at the top left corner), whereas green valleys or blue lakes represent small distances. In this geographical map analogy, the points, respectively, the “analgesics,” laying together in a valley of the U‐Matrix indicate that these drugs share a common pattern of biological processes (i.e., they are members of the same cluster). Watersheds in the U‐Matrix indicate borders between clusters. The highest limits we observed between the three classes were classes #1 and #2 comprising opioids and class #3 comprising nonopioids. Please note that the projection grid is toroidal where opposite edges are connected.
Functional genomic‐based drug repurposing
The analysis of similarities in the vector space between biological processes overrepresented in leukemia and those addressed by the available drugs identified a list of 17 drugs that fulfilled the criterion of neighborhood in the high‐dimensional space (Table 3). One item on this list, namely tofacitinib, had been only 4 weeks ago presented as a potential novel rescue mediation for lymphocytic leukemia, based on classical molecular and clinical research.20 Hence, present results were again in line with the state of the art of actual laboratory research.
Table 3.
Drugs that qualify for repurposing as treatments of CLL as a result of the similarity analysis between the functional genomics (biological processes) of CLL based on a gene set (n = 553) queried from the MalaCards database16 (MCID: CHR090) and the functional genomics of the 1389 drugs queried from the DrugBank database.3, 4
| Drug | Euclidean distance | Drug | Euclidean distance |
|---|---|---|---|
| Nilotinib | 21.82 | Tofacitinib (compare20) | 24.66 |
| Nintedanib | 23.32 | Ustekinumab | 24.74 |
| Amlexanox | 23.83 | Tocilizumab | 24.74 |
| Antithymocyte globulin | 24 | Ruxolitinib | 24.74 |
| Becaplermin | 24.17 | Sunitinib | 24.82 |
| Pentosan polysulfate | 24.41 | Dalteparin | 24.82 |
| Bevacizumab | 24.49 | Abatacept | 24.98 |
| Lenvatinib | 24.49 | Belatacept | 24.98 |
| Siltuximab | 24.58 |
CLL, chronic lymphatic leukemia.
DISCUSSION
The concept of “process pharmacology” associates drugs directly with diseases characterized by biological process that are pathophysiologically upregulated or downregulated. Biological processes are defined as a series of events or molecular functions with a defined beginning and end.1 Their regulation occurs when they are modulated in frequency, rate, or extent, following, for example, changes in the expression of genes, protein modifications, or interaction between proteins and substrates. Biological processes represent higher‐level organizations of gene products21 in which each process is maintained by several different genes and each gene contributes to several biological processes. Therefore, targeting biological processes increases the choice of gene products that might be successfully addressed therapeutically. If a particular gene has not yet been implicated in a particular disease, the knowledge of relevant processes emerging from the functions of the so far implicated genes possibly suffices to identify it as a potential molecular drug target because it is GO‐annotated to the relevant process. Hence, this is a working concept for drug repurposing. Moreover, the analysis of biological processes characterizing a trait helps selecting candidate drugs in silico. This was demonstrated on leukemia in which the identification of a drug was based on the intersection between disease‐relevant biological processes with the association of drugs to any process.
Computational methods aim at reducing the time and costs of drug discovery and development. Their results provide a basis for subsequent laboratory or clinical research under the condition that they are biologically plausible and convincing that these efforts may be successful. The present analysis showed (i) that the concept is suitable to identify subgroups among drugs that quite satisfactorily corresponded to the known pharmacological groups, as exemplified with antihypertensive drugs, (ii) that, therefore, it qualifies as a method of classification of opioid analgesics, which can contribute to the selection of alternatives during clinical opioid rotation, and (iii) the concept is able to identify a drug repurposing candidate for the treatment of leukemia.
Replacing an opioid with another to reestablished analgesia15 is not attributed to opioid pharmacokinetics. Among proposed mechanisms are differences among opioids with respect to ligand‐selective biased signaling, addressing the coupling to distinct µ‐opioid receptor downstream pathways following receptor activation by different agonists.18, 22 The functional genomic differences between the two groups of opioids identified in the present approach indicate an implication of distinct mechanisms of opioid tolerance. That is, results suggested that the first but not the second group is particularly active at protein phosphorylation known to be involved in opioid receptor internalization and recovery.18 This may produce receptor tolerance, which is reversible when replacing the opioid with one of the other group, clearly less addressing this mechanism. Indeed, analgesic tolerance developed to chronic exposure to morphine, which belongs to opioid group I, could be experimentally reversed with methadone, which belongs to opioid group II.19 Therefore, the present approach that inherently includes all known interactions of the opioid with several molecular targets may provide an alternative basis for opioid rotation in pain therapy.
The third result, the identification of a tofacitinib being among potential treatments of lymphatic leukemia, satisfies the expectations for drug repurposing. Tofacitinib is a Janus kinase inhibitor with immunomodulation properties used as a second‐line treatment of rheumatoid arthritis. As an immunosuppressant, it potentially reactivates malignant processes; however, the association of clonal expansion of cytotoxic T lymphocytes with autoimmune disorders suggested intersections with rheumatoid arthritis, which was used as the basis for the successful repurposing of the drug for the treatment of lymphocytic leukemia.20 Present results are in remarkable vicinity to this novel finding, although derived from a gene set of CLL, which is not identical to acute lymphoblastic leukemia, but results may suggest a utility of tofacitinib for CLL as well.
Although having provided biologically plausible results agreeing with contemporary molecular or clinical research, “process pharmacology” still depends on the accuracy and completeness of the information made available in the queried databases. This makes it vulnerable to both, research bias in functional genomics or pharmacology and outdated or erroneous information in the databases. On the other hand, the approach profits from the increasing trend toward “big data,” which supports the expectation of a continuously broadening availability of data. Moreover, missing pharmacological information can be increasingly substituted by means of computational prediction of drug vs. target interactions.23 A further limitation at this stage is the unsigned inclusion of drug vs. target interactions (i.e., without distinction of agonistic from antagonistic actions). Therefore, the artificial intelligence (AI) underlying the present analysis is not perfect. As in many other applications of AI, topical experts’ knowledge is required to correct its shortcomings. A further limitation is the so far missing weight of the interactions with biological processes resulting from the different potencies and efficacies of drugs at their different targets. A consequence of this lack has probably been observed with the diuretics in the presented canonical example. The thiazides were assigned with carboanhydrase inhibitors in the same cluster. Indeed, thiazide diuretics have an affinity to that enzyme, however, only at high doses. This could not be distinguished with the present information. It will require future inclusion of additional databases, such as ChEMBL (https://www.ebi.ac.uk/chembl/), and associated refinements of the presently proposed methodology toward AI.
Future perspectives include the utility of the concept for drug discovery and drug combination therapies. The concept has been shown to be suitable for choosing therapeutic alternatives or for drug repurposing. An exclusion of drug discovery (i.e., the finding of novel drugs rather than the deviation of the clinical application of available drugs), is not principal. By identifying biological processes, the most revenant genes can be used as candidate targets for drugs with a novel principle of action. Moreover, “process pharmacology” inherently includes drug combinations. Biological processes are maintained by the products of different genes, which may provide a basis for multitarget or drug combination therapies advancing previous concepts, such as the polypill concept24 or the idea of using low‐dose drug combinations along molecular pathways.25
The present approach used the collected knowledge about the biological roles of genes, presented in a directed acyclic graph as the basic organizational structure of the GO database, which is the main basis of functional analysis on drugs. This fundamentally differs from mechanistic approaches to systems pharmacology. These use acquired knowledge from several sources gathered in bioinformatics databases and aim at identifying molecular, biochemical, signaling pathways, and their drug‐relevant interconnections, or apply computational tools for the modeling of protein networks.26, 27 They use, for example, software packages, such as the systems biology workbench (http://jdesigner.sourceforge.net/Site/Welcome.html), the Metabolic Pathway Designer and Analyzer (http://sourceforge.net/projects/metabolic1491/), or the SimBiology Matlab toolbox (Mathworks, Natick, MA). Indeed, network pharmacology approaches are increasingly being developed and applied to find new therapeutic opportunities and to repurpose approved drugs.28, 29 As stated for the present method, among the goals of network pharmacology is the development of polypharmacology for complex diseases.30 However, the main difference of “process pharmacology” to these approaches consists of the analytical basis. Other than systems pharmacology approaches so far, process pharmacology is not based on molecular pathways or protein interactions, but on the results of the activity of these pathways reflected in the associated biological processes. For process pharmacology, the modulation of a process is in the focus. The molecular background assures only that the gene product had to be associated with this particular process. At a molecular network level, the process could be addressed with any mechanism. It uses the result of the action of molecular pathways as its basis, rather than the detailed analysis of the mechanisms. In this respect, it might confer an addition to systems pharmacology approaches and can be used in concert with alternatives. Thus, the presently introduced concept is in close agreement with established or elsewhere developed approaches, accommodating the increasing availability of “big data” in pharmacology. The efforts to develop the necessary tools and methods to translate this knowledge into novel drugs or therapy strategies, perhaps as extended as a paradigm change from an almost exclusively hypothesis‐driven pharmacological research to an increasing importance of a data‐driven pharmacological science.
CONCLUSIONS
We introduce a novel functional genomic‐based concept of pharmacology that uses AI techniques for the mining of “big data” for drug and disease relevant knowledge. Using pharmacological data science, “process pharmacology” exploits the results of pharmacologic research on their interactions with target molecules, molecular research on signaling pathways, gene regulation in diseases, and on the functions of genes, which are combined with the results of bioinformatics research on machine‐learning and knowledge‐discovery. It is aimed at improving the present situation in which it often occurs that highly successful molecularly targeted therapies are being identified only by chance rather than by design, as expressed elsewhere.31 The present concept proved to be suitable for drug discovery by identifying a narrow choice of repurposing candidates for the treatment of lymphatic leukemia, which is an item that agreed with an actual result of independent clinical research. Thus, the method provides, by using automated AI, results that are compatible with those that have been obtained elsewhere by mechanistic or clinical reasoning. This is in line with the increasing importance of computational approaches to pharmacological research.
Conflict of Interest. The authors declared no conflict of interest.
Author Contributions. J.L. and A.U. wrote the manuscript. J.L. and A.U. designed the research. J.L. and A.U. performed the research. J.L. and A.U. analyzed the data.
Source of Funding. The work has been supported by the Landesoffensive zur Entwicklung wissenschaftlich‐ökonomischer Exzellenz (LOEWE; J.L.), Zentrum: Translational Medicine and Pharmacology. The research also received funding, in particular the necessary computation equipment, from the European Union Seventh Framework Programme (FP7/2007 ‐ 2013) under grant agreement no. 602919 (J.L.). The funders had no role in method design, data selection and analysis, decision to publish, or preparation of the manuscript.
References
- 1. Carbon, S. et al AmiGO: online access to ontology and annotation data. Bioinformatics 25, 288–289 (2009). [DOI] [PMC free article] [PubMed] [Google Scholar]
- 2. Ultsch, A. & Lötsch, J. Functional abstraction as a method to discover knowledge in gene ontologies. PLoS One 9, e90191 (2014). [DOI] [PMC free article] [PubMed] [Google Scholar]
- 3. Wishart, D.S. et al DrugBank: a knowledgebase for drugs, drug actions and drug targets. Nucleic Acids Res. 36(Database issue), D901–D906 (2008). [DOI] [PMC free article] [PubMed] [Google Scholar]
- 4. Wishart, D.S. et al DrugBank: a comprehensive resource for in silico drug discovery and exploration. Nucleic Acids Res. 34(Database issue), D668–D672 (2006). [DOI] [PMC free article] [PubMed] [Google Scholar]
- 5. Huang, D.W. , Sherman, B.T. & Lempicki, R.A. Systematic and integrative analysis of large gene lists using DAVID bioinformatics resources. Nat. Protoc. 4, 44–57 (2009). [DOI] [PubMed] [Google Scholar]
- 6. Ashburner, M. et al Gene ontology: tool for the unification of biology. The Gene Ontology Consortium. Nat. Genet. 25, 25–29 (2000). [DOI] [PMC free article] [PubMed] [Google Scholar]
- 7. Camon, E. et al The Gene Ontology Annotation (GOA) Database: sharing knowledge in Uniprot with Gene Ontology. Nucleic Acids Res. 32(Database issue), D262–D266 (2004). [DOI] [PMC free article] [PubMed] [Google Scholar]
- 8. Camon, E. et al The Gene Ontology Annotation (GOA) project: implementation of GO in SWISS‐PROT, TrEMBL, and InterPro. Genome Res. 13, 662–672 (2003). [DOI] [PMC free article] [PubMed] [Google Scholar]
- 9. Backes, C. et al GeneTrail–advanced gene set enrichment analysis. Nucleic Acids Res. 35(Web Server issue), W186–W192 (2007). [DOI] [PMC free article] [PubMed] [Google Scholar]
- 10. Hochberg, Y. A sharper Bonferroni procedure for multiple tests of significance. Biometrika 75, 800–802 (1988). [Google Scholar]
- 11. Ultsch, A. Maps for visualization of high‐dimensional data spaces (2003). In Proceedings of Workshop on Self‐Organizing Maps (WSOM; Kyushu, Japan), 225–230 (2003).
- 12. Ultsch A. & Sieman H.P., eds. Kohonen's self organizing feature maps for exploratory data analysis. In Proc. INNC'90, Int. Neural Network Conference, Dordrecht, Netherlands: Kluwer, 1990.
- 13. Lötsch, J. & Ultsch, A. Exploiting the structures of the U‐Matrix In: Villmann T., Schleif F.‐M., Kaden M. & Lange M, eds. Advances in Intelligent Systems and Computing, 248–257 (Springer, Heidelberg, Germany, 2014). [Google Scholar]
- 14. Ultsch, A. & Moerchen, F. Databionic ESOM tools 2005. http://databionic-esom.sourceforge.net/devel.html (2005).
- 15. Inturrisi, C.E. Clinical pharmacology of opioids for pain. Clin. J. Pain 18(4 Suppl), S3–S13 (2002). [DOI] [PubMed] [Google Scholar]
- 16. Rappaport, N. et al MalaCards: an integrated compendium for diseases and their annotation. Database (Oxford) 2013, bat018 (2013). [DOI] [PMC free article] [PubMed] [Google Scholar]
- 17. Cover, T.M. & Hart, P.E. Nearest neighbor pattern classification. IEEE Trans. Inf. Theory 13, 21–27 (1967). [Google Scholar]
- 18. Williams, J.T. et al Regulation of μ‐opioid receptors: desensitization, phosphorylation, internalization, and tolerance. Pharmacol. Rev. 65, 223–254 (2013). [DOI] [PMC free article] [PubMed] [Google Scholar]
- 19. Posa, L. , Accarie, A. , Noble, F. & Marie, N. Methadone reverses analgesic tolerance induced by morphine pretreatment. Int. J. Neuropsychopharmacol. (2015). [Epub ahead of print] [DOI] [PMC free article] [PubMed] [Google Scholar]
- 20. Bilori, B. et al Tofacitinib as a novel salvage therapy for refractory T‐cell large granular lymphocytic leukemia. Leukemia 29, 2427–2429 (2015). [DOI] [PubMed] [Google Scholar]
- 21. Hu, P. , Bader, G. , Wigle, D.A. & Emili, A. Computational prediction of cancer‐gene function. Nat. Rev. Cancer 7, 23–34 (2007). [DOI] [PubMed] [Google Scholar]
- 22. Pradhan, A.A. , Smith, M.L. , Kieffer, B.L. & Evans, C.J. Ligand‐directed signalling within the opioid receptor family. Br. J. Pharmacol. 167, 960–969 (2012). [DOI] [PMC free article] [PubMed] [Google Scholar]
- 23. Lötsch, J. et al Common non‐epigenetic drugs as epigenetic modulators. Trends Mol. Med. 19, 742–753 (2013). [DOI] [PubMed] [Google Scholar]
- 24. Indian Polycap Study (TIPS) et al Effects of a polypill (Polycap) on risk factors in middle‐aged individuals without cardiovascular disease (TIPS): a phase II, double‐blind, randomised trial. Lancet 373, 1341–1351 (2009). [DOI] [PubMed] [Google Scholar]
- 25. Lötsch, J. & Geisslinger, G. Low‐dose drug combinations along molecular pathways could maximize therapeutic effectiveness while minimizing collateral adverse effects. Drug Discov. Today 16, 1001–1006 (2011). [DOI] [PubMed] [Google Scholar]
- 26. Hucka, M. , Finney, A. , Sauro, H.M. , Bolouri, H. , Doyle, J. & Kitano, H. The ERATO Systems Biology Workbench: enabling interaction and exchange between software tools for computational biology. Pac. Symp. Biocomput. 450–461 (2002). [DOI] [PubMed] [Google Scholar]
- 27. Frank, T.B. , Ravishankar, R.V. & Herbert, M.S. Computational tools for modeling protein networks. Curr. Proteomics 3, 181–197 (2006). [Google Scholar]
- 28. Kibble, M. , Saarinen, N. , Tang, J. , Wennerberg, K. , Mäkelä, S. & Aittokallio, T. Network pharmacology applications to map the unexplored target space and therapeutic potential of natural products. Nat. Prod. Rep. 32, 1249–1266 (2015). [DOI] [PubMed] [Google Scholar]
- 29. Harrold, J.M. , Ramanathan, M. & Mager, D.E. Network‐based approaches in drug discovery and early development. Clin. Pharmacol. Ther. 94, 651–658 (2013). [DOI] [PMC free article] [PubMed] [Google Scholar]
- 30. Zhao, S. & Iyengar, R. Systems pharmacology: network analysis to identify multiscale mechanisms of drug action. Annu. Rev. Pharmacol. Toxicol. 52, 505–521 (2012). [DOI] [PMC free article] [PubMed] [Google Scholar]
- 31. Grimwade, D. , Mistry, A.R. , Solomon, E. & Guidez, F. Acute promyelocytic leukemia: a paradigm for differentiation therapy. Cancer Treat. Res. 145, 219–235 (2010). [DOI] [PubMed] [Google Scholar]
- 32. Izenmann, A. Modern Multivariate Statistical Techniques (Springer, Berlin, Germany, 2009). [Google Scholar]