

Abstract
To characterize the thermodynamical equilibrium of DNA chains interacting with a solution of nonspecific binding proteins, we implemented a Flory-Huggins free energy model. We explored the dependence on DNA and protein concentrations of the DNA collapse. For physiologically relevant values of the DNA-protein affinity, this collapse gives rise to a biphasic regime with a dense and a dilute phase; the corresponding phase diagram was computed. Using an approach based on Hamiltonian paths, we show that the dense phase has either a molten globule or a crystalline structure, depending on the DNA bending rigidity, which is influenced by the ionic strength. These results are valid at the thermodynamical equilibrium and therefore should be consistent with many biological processes, whose characteristic timescales range typically from 1 ms to 10 s. Our model may thus be applied to biological phenomena that involve DNA-binding proteins, such as DNA condensation with crystalline order, which occurs in some bacteria to protect their chromosome from detrimental factors; or transcription initiation, which occurs in clusters called transcription factories that are reminiscent of the dense phase characterized in this study.
Introduction
Predicting the three-dimensional (3D) structure of chromosomes from the primary DNA sequence has become an important goal, as genomic and transcriptomic data are being generated at an elevated pace. In eukaryotes and prokaryotes, transcription of highly active genes has been shown through morphological evidence to occur within discrete foci containing RNA polymerases (RNAPs). It has later been demonstrated that one given focal point was enriched in one type of dedicated transcription factor (TF) (1, 2) and one type of gene promoter (3), as well as nascent transcripts (4), thus justifying the naming of such foci as transcription factories. A thermodynamic model has shown that the stiff DNA polymer and properly located attractive sites mimicking TF bridges were necessary and sufficient ingredients to produce a transcription factory through DNA looping (5). Indeed, there is now convincing evidence that chromosomes are organized into loops (Hi-C, 3C, etc.) (2), and that looping brings distant genes together so that they can bind to elevated local concentrations of RNAPs (FISH, 3C, etc.) (6). DNA-binding proteins such as TFs are generally positively charged, thus providing a nonspecific interaction with the negatively charged DNA polymer. DNA sequence-dependent binding offers specific interactions. Together, nonspecific and specific associations allow proteins to search their target DNA sequences more efficiently via facilitated diffusion (7, 8), which combines 3D diffusion in the bulk volume and monodimensional diffusion along the DNA. These considerations motivated studies to characterize the timescale of the dynamics or anomalous diffusion. Molecular dynamics simulations are used to model proteins that diffuse to DNA, bind, and dissociate. The timescales reached in numerical simulations are usually several orders of magnitude smaller than the biological ones, and thus the phenomena observed during such simulations might be transient and irrelevant biologically.
In this article, we present a study of the properties and phase diagram of a DNA-protein solution, at thermodynamic equilibrium, which entails DNA condensation into compact structures induced by nonspecific DNA-binding proteins. The calculated phase diagram is thus expected to be relevant at biological timescales. To do so, we consider a simplified model in which the nucleus (or bacterial nucleoid) is represented by a closed volume V (Fig. 1). The double-stranded DNA chains are modeled as M semiflexible polymer chains (polymerization index N) that interact with P spheres, which represent either transcription factors or structural proteins. We consider the nucleus (or bacterial nucleoid) to be a good solvent for DNA chains, so that monomers experience a repulsive interaction between themselves. Conversely, we assume that there is an attractive interaction between proteins and DNA that allows the proteins to bind to DNA. As for the protein-protein interaction, we consider a repulsive (hard-core) interaction, but the case of an attractive (e.g., complexation, dimerization, etc.) interaction could be treated in the same way. Finally, we assume that all interactions are nonspecific. In the sequel, subscripts D and P stand for DNA and protein, respectively. We first describe the phase diagram of such a system in the mean-field approximation and show that there is a phase transition from a dilute phase at high temperature to a concentrated phase of the DNA and proteins at lower temperature, which can be identified as the transcription factory phase. In a second step, we characterize the structure of the dense phase and show that it can adopt a crystalline order, suggesting an interesting parallel with the existence of some DNA biocrystals in vivo. This general method can be applied to many genome architecture problems.
Figure 1.

(A) Model of DNA represented as beads-on-string polymers (blue) interacting with proteins (red). Dotted circles stand for clusters with high concentrations of DNA monomers and proteins. (B) Monomer-monomer interaction is repulsive. (C) Protein-protein interaction is repulsive. (D) DNA-protein interaction is attractive. To see this figure in color, go online.
Flory-Huggins theory
Free energy and thermodynamic functions
In the following, we study the phase diagram of the bulk of the bacterial cell (or nucleus) in the mean-field approximation. In the context of polymer theory, this approximation is also called the Flory-Huggins theory (9). A similar kind of approach has been used to study the demixion of a mixture of polymers and colloids, in which the interaction is repulsive (10). By contrast, in our study, the polymer-colloid interaction is taken as attractive. We denote the concentrations of DNA monomers and proteins as and , respectively, and the molecular volume of a DNA monomer and of a protein as and , respectively. The (Flory-Huggins) free energy per unit volume is as follows:
| (1) |
where , , and v are second-order virial coefficients denoting the DNA-DNA, protein-protein, and DNA-protein interactions, respectively; and w is the third virial coefficient, necessary to avoid the collapse of the system. Note that this last term comes mostly from the entropy of the solvent. Indeed, if solvent molecules were present with concentration and molecular volume , the solvent translational entropy would be . If we assume incompressibility of the DNA-protein-solvent mixture (i.e., ), the solvent entropy can be written as a mean-field solution as , which, when expanded to the third order in , yields the cubic term in Eq. 1.
The Gibb’s free energy per unit volume is the following Legendre transform of Eq. 1:
| (2) |
where is the osmotic pressure and and are the chemical potentials of DNA monomers and proteins, respectively. The total number of particles of the system is fixed, but as we show below, these chemical potentials play a useful role when the system separates into two phases at equilibrium. At thermal equilibrium, the Gibb’s energy is an extremum: and , from which we deduce the following chemical potentials:
| (3) |
By inserting the last expressions in Eq. 2, we see that , , and v are indeed identified to the coefficients of a virial expansion.
The free energy in Eq. 1 is quite general and holds for arbitrary interactions between the constituents. It is possible to relate , , and v to any pair potential, say , used to model the corresponding interaction. Indeed, these virial coefficients can be computed to lowest order (in the density) using the following well-known Mayer relation:
| (4) |
and the same for v.
In physiological conditions, salt (e.g., NaCl and KCl) and ions (e.g., and ) are present in solution, giving rise to screened electrostatic interactions. The interactions are therefore short-ranged with a range given by the Debye-Hückel length. Yet, at the mean-field level, the specific shapes of the interaction potentials is irrelevant, and the effect of ions in solution only arises through an adjustment of the Mayer coefficients , , and v. The DNA excluded volume coefficient , which accounts also for the electrostatic repulsion between negatively charged monomers, is positive. The protein-protein coefficient in general is positive (repulsive), because of electrostatic repulsion between identically charged proteins; but it can be attractive (negative) for specific molecules, which may undergo dimerization or hybridization. For hard spheres, for instance, , σ is the volume of one sphere. We hereafter restrict our focus to the case where DNA-DNA and protein-protein interactions are purely repulsive (steric).
Conversely, we assume , i.e., the DNA-protein interaction has an attractive tail, which is temperature-independent (in first approximation). As we show below, the Flory-Huggins theory predicts the existence of a critical temperature . We assume that is analytic in and can be written to the leading order as in the following:
| (5) |
where θ is the Flory-Huggins temperature for which , i.e., the interaction vanishes.
The regime of phase separation
As mentioned previously, there is a phase transition when the homogeneous solutions and become unstable. It is well known that generically, when the temperature decreases, the system separates into two phases. At the phase separation point, the homogeneous high-temperature phase may stay metastable down to a point, called the spinodal point, where the homogeneous phase becomes totally unstable. The so-called spinodal condition is given by the following equation:
| (6) |
where the array denotes the determinant of the matrix.
In general for fixed, Eq. 6 with the equality determines a line of spinodal points, delimiting the region where the homogeneous mean-field solution is stable from the region where it is not. In the unstable regions, the system undergoes a phase separation. If T is increased, becomes less negative. At some point, the spinodal lines merge into a point when T reaches a critical value (Fig. 2). This is a tricritical point. For , the homogeneous solution is stable for any value of and , where we use the superscript to emphasize that these concentrations are the mean-field solutions in the absence of phase separation. There are critical lines emerging from the tricritical point when the temperature is decreased, as we show below.
Figure 2.

Three-dimensional representation of the coexistence surface in a coordinate system. Coexistence lines are shown for and 0.015, with (red lines). Critical lines (black lines) emerge from the tricritical point (black dot). To see this figure in color, go online.
In a biphasic regime, the concentrations are different but uniform in each of the two phases, separated by an interface whose energy is not extensive (the interfacial free energy is proportional to the surface of the interface). We label the dilute phase by I, and the dense phase by II. The total system free energy then reads as follows:
| (7) |
where is a shorthand for and and denote the volume fraction of the dilute and dense phase.
A straightforward minimization of Eq. 7, with the constraints of conservation of volume and particles number of D and P, yields the following usual equations of coexistence between phase I and phase II:
| (8) |
where denote the osmotic pressures of each phase. The above equations are simply the equalities of the chemical potentials and the osmotic pressures. It trivially implies with . Note that Eq. 8 is a system of three equations with five variables ; thus it determines a surface of coexistence.
Materials and Methods
Molecular dynamics simulations
To sample configurations of our system we used the LAMMPS (large-scale atomic/molecular massively parallel simulator) software package. The system is coarse-grained so that DNA is modeled as a beads-on-string polymer and proteins as spheres. The simulations are run in the Brownian dynamics (BD) mode. The resulting dynamics consists in the integration of the following Langevin equation:
| (9) |
where i is the index of one bead, is the position of the bead, is the friction coefficient, is the resulting force exerted on the bead from the rest of the system, is the Boltzmann constant, and T is the temperature. The last term is a stochastic force in which is a Gaussian white noise such that . Simulations were run with , , and , in a cubic volume of size with periodic boundary conditions, and we took a polymer with beads. The diameter a of the beads was taken as the unit length.
As for the polymer chain model, beads i and are connected with a finitely extensible nonlinear potential (FENE) that results in the following:
| (10) |
where . Simulations were run with and .
The bending rigidity of the polymer chain is introduced through the following Kratky-Porod potential:
| (11) |
where is the angle between vectors and . The bending coefficient is related to the persistence length by .
We restricted our analysis to the case of DNA monomers and protein spheres of same dimension (with diameter a). This assumption does not alter the main qualitative features of the physics but makes the discussion simpler. Steric as well as attractive interactions between beads are introduced using a truncated Lennard-Jones potential such as the following:
| (12) |
Unless stated otherwise, we took the values indicated in Table 1. The DNA-DNA interaction being purely repulsive, we retrieve , where is the volume of one monomer. The same argument holds for the proteins. Conversely, the monomer-sphere coefficient is largely negative (Table 1 and Fig. 3).
Table 1.
Parameters for the truncated Lennard-Jones potential modeling the DNA-DNA, protein-protein, and DNA-protein interactions
| 1 | 2 | ε | a | Mayer Coefficient α | |
|---|---|---|---|---|---|
| DNA | DNA | 1.00 | 1.00 | 1.12 | 4.40 |
| Protein | Protein | 1.00 | 1.00 | 1.12 | 4.40 |
| DNA | Protein | 3.00 | 1.00 | 2.00 | −62.6 |
The mean-field pair coefficients are computed using Mayer formula.
Figure 3.

Truncated Lennard-Jones potential modeling an attractive interaction between DNA and proteins with parameters indicated in Table 1: (A) potential shape and (B) Mayer function. To see this figure in color, go online.
We systematically performed equilibration runs of time units to reach thermal equilibrium. We then performed sampling runs of time units that we used to measure physical quantities. Our simulation time units can be understood as follows. The diffusion coefficient can be expressed as , where is the Brownian time corresponding to one simulation time unit. Therefore, we can do a mapping to physical units. Assuming a diffusion coefficient of for a protein in the bacterial nucleoid (11), we find for , and for .
Mean-field concentrations
To assess physiological concentrations, we assimilate an Escherichia coli (E. coli) bacteria to a cylinder of radius and length . We took a genome length of base pairs (bp). We consider that the diameter of one monomer is , so that one such chromosome is modeled as a polymer of monomers with diameter . This leads to a density of DNA . As for the proteins, there are several DNA-binding proteins, called nucleoid-associated proteins, which act on the structure of the DNA. In E. coli, for instance, HU, H-NS, Fis, RecA, Dps, and other proteins have this structuring function. We choose to use Fis as a reference because it is a well-known structural protein with a large number of target sites (12) and binds to DNA sequences of 17 nucleotides (13). In E. coli, there are ∼75,000 Fis proteins per genome copy (14) in the early exponential growth phase, yielding a ratio . This is also consistent with previous numerical studies for which (15). Eventually we suggest that this ratio might be quite general and can also be mapped to eukaryotes. Indeed, we could either consider a human cell (genome length of and nucleus diameter of 10 μm) and take as a unit length (size of protein complex). Considering that the DNA would be packed as euchromatin with a linear packing fraction (16), the unit length is and we get . In the former case, the proteins are assumed to be ∼6 nm in diameter, whereas the latter case better describes the interaction of DNA with large protein complexes.
Computation of the phase diagram
The coexistence surface is computed by solving Eq. 8. Because of numerical accuracy limitations, we computed the phase diagrams for chains with a polymerization index of . Because the critical values scale like (Fig. 4), this arbitrary choice captures the essential features of the limit. Finally, the model relies on a free parameter w, which can be used to fit the model. In Flory-Huggins theory, w is extracted from the development of the entropy of mixing and would be , where is the close packing concentration. However, cells are crowded environments, containing other species, metabolites, or organelles. Furthermore, biological compartments can also restrict the accessible volume. Eventually, this value is underestimated and we arbitrarily choose . Although it could be much larger, the variations of above this value are quite slow and do not alter dramatically the previous phase diagrams (Fig. 4). With all these parameters, we find for the tricritical point coordinates: , , and .
Figure 4.

(A) The DNA critical concentration . (B) For the variations of and of the other critical parameters are very slow. To see this figure in color, go online.
Results
We present in this section the results of the mean-field theory and defer the discussion of the actual values of the parameters (see Materials and Methods). We assume that DNA and protein spheres have the same size (diameter a) that we use as the new unit length. The temperature T and the coefficient are related through Eq. 5, and we therefore introduce the order parameter t in the following:
| (13) |
We choose to discuss the phase separation in terms of t and of the densities and . The coexistence surface is then computed numerically by solving Eq. 8 and is shown in Fig. 2. At the critical point, Eq. 8 has a unique solution, namely the triplet . As previously reported for such systems (10), we find the following:
| (14) |
This is the same scaling as the overlap density for polymer chains of size N, which is the density at which polymer coils begin to interpenetrate (see, for instance, (9)). Given that DNA is present in the nucleoid at concentrations close to the overlap density, this suggests that biological systems may function at the vicinity of this tricritical point.
For we have , which corresponds to a DNA-protein interaction more attractive than at the critical point and the solutions of Eq. 8 are distributed on a closed curve. This closed curve is in fact the collection of all pairs of coexisting dilute and dense phases. They are represented in Fig. 5, where the pairs of coexisting phases are connected by tie lines. Although there is an infinite set of possible states of coexistence, the total number of DNA and protein spheres selects a unique solution pair. The resulting coexistence state is uniquely determined by the following relation, whose graphical interpretation is shown in Fig. 5:
| (15) |
An important point to note is that in general, the concentration of DNA in the dilute phase is very small. Indeed, the translational entropy of DNA is small, because of the factor , and thus there is no entropic gain for the DNA to be in the dilute phase, whereas it has an important enthalpic advantage to be in the concentrated phase. To illustrate how one can determine the composition of the system, we now explain how phase separation takes place when cooling the system from high to low temperature. We consider the following case of DNA and protein densities:
| (16) |
| (17) |
Again, we defer the justification for this choice of the parameters. The system splits into two phases at a temperature . For , the system is homogeneous with values of the concentration given by Eq. 16, whereas for , the system splits into two phases whose composition is determined by Eqs. 8 and 15. The line of coexistence obtained is shown on Fig. 2. Note that at , the phase transition is first order, except when is on a critical line, in which case it is second order. Let us now assume that the concentration of proteins is increased by a factor of 10 to . When the system is cooled from high temperatures, it splits into two phases, and as before, the coexisting states are distributed on the surface of coexistence. However, the mass conservation requirement (Eq. 15) yields a different line of coexistence. The new line of coexistence is shown with dashed lines in Figs. 2 and 6. As might have been expected, an augmentation of the protein concentration results in an increased protein concentration in both the dilute and concentrated phases (Fig. 6 A). The DNA concentration, however, shows a two-step pattern. When additional proteins are added to the solution, the free DNA monomers of the dilute phase are transferred to the concentrated one, and consequently, the DNA concentration in the dense phase first increases. But at some point, the DNA concentration in the dense phase reaches a maximum and starts to decrease (Fig. 6, B and C). Indeed, a fraction of the newly added proteins populate the concentrated phase and make it swell, while the amount of DNA remains the same. Therefore, varying the total quantity of proteins can induce nonmonotonous variations of the DNA concentration in the phases of the system.
Figure 5.

Coexistence lines for . The coexistence line shrinks toward the tricritical point (red dot) when . For each curve, the dilute phase is shown in green and the concentrated phase is shown in blue. Coexisting states are connected by tie lines (dotted segments). The volume fraction of each phase is determined (black arrows) according to Eq. 15. To see this figure in color, go online.
Figure 6.

Coexistence lines for and 0.015, with . These are the projections of the coexistence lines of Fig. 2 as a function of the density of (A) proteins or (B) DNA. (C) Section of the phase diagram at (corresponding to the parameters given in Table 1). A path corresponding to a fixed DNA density of is drawn (black line). (D) Density ratio for the dilute phase and dense phase, for a density of DNA fixed to . To see this figure in color, go online.
Structure of the dense phase
Example of structures
We showed above how the Flory-Huggins theory predicts the existence of a phase separation between two homogeneous phases. It is well known that within the Flory-Huggins approximation, the chain structure is not taken into account, except through the suppression of the translational entropy of the chains. In particular, the fact that chains may have a strong bending rigidity (long persistence length) does not play any role at this level. Therefore, the predicted structure of the dense phase is that of a melt of collapsed polymer with spheres. However, several studies have highlighted that the bending rigidity of the polymer has an influence on the microstructure of the dense phase (15, 16, 17). This is well characterized (Fig. 7). A standard way to characterize the effect of the chain structure is to use the random phase approximation (RPA) (see (9)). We have performed such RPA calculations, but we do not report them in this article, because they did not show any interesting instability in the dense phase. The reason for the failure of RPA is that the phase transition from the homogeneous to the separated phases is first order and thus is not driven by critical fluctuations. This is a typical case when RPA fails to give insights about the dense phase structure.
Figure 7.
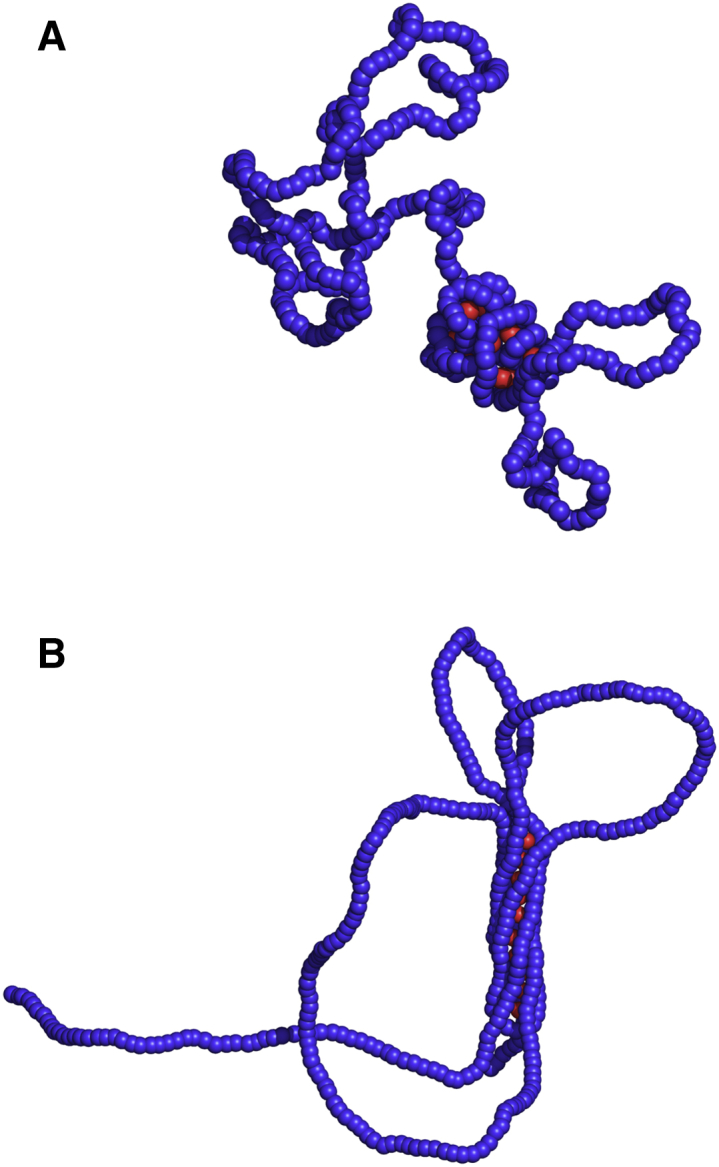
Two equilibrium configurations of a single polymer chain (blue) displaying the coexistence of a dense and a dilute phase, with persistence length (A) and (B) interacting with proteins (red). For small bending rigidity, the structure of the dense phase is globular whereas it is cylindrical in the other case. We performed simulations with spheres (see Materials and Methods). To see this figure in color, go online.
Theory of Hamiltonian paths
Because RPA is not appropriate to describe the system in the dense phase, we adopt another approach. Because of their attractive interactions with the DNA, the spheres in which the polymer is immersed play the role of colloid particles that bridge various parts of the polymers. Consequently, these spheres induce an effective attraction between the monomers. We thus turn to a model of a semiflexible polymer chain on a lattice that has been proposed initially to explain the folding of a protein in compact structures (17, 18, 19) (see Fig. 8). An attraction energy between nonbonded nearest neighbors is included, which favors compact configurations. A bending energy of the chain is introduced as a corner penalty. It penalizes corners by an energy and thus plays the role of a bending rigidity. As we show below, this term induces an ordering transition between a random (molten) globule where corners are mobile in the bulk, and a crystalline phase, where corners are expelled to the surface of the globule. Using mean-field theory, it was shown that depending on the temperature and chain stiffness, three phases can exist, namely a dilute phase where the polymer is swollen; a condensed phase, which we call a molten globule, where the polymer is collapsed and disordered; and finally a second condensed phase where the polymer is collapsed but with a local crystalline ordering. The phase diagram is described simply by the two parameters and . For fixed small , there is a second-order phase transition at a temperature between a dilute and a disordered condensed phase, followed by a first-order freezing transition at between the disordered condensed phase and a locally ordered condensed phase of the polymer. Upon increasing the chain stiffness , the molten globule region shrinks until it eventually vanishes. For larger stiffness, the polymer goes abruptly from a swollen to a frozen configuration through a direct first-order transition (Fig. 9). These theoretical results were readily confirmed and improved by Monte-Carlo simulations (17, 20, 21).
Figure 8.

Two realization of Hamiltonian paths on a cubic lattice. The globular state contains an extensive number of corners whereas the crystalline state contains a nonextensive number of corners (proportional to the surface). To see this figure in color, go online.
Figure 9.

Phase diagram obtained for a polymer chain interacting with spheres. The phase diagram is plotted as a function of and , where ε is the strength of the Lennard-Jones DNA-protein interation and is the persistence length. We performed simulations with spheres (see Materials and Methods). To see this figure in color, go online.
In its simplest form, this model considers a completely collapsed polymer on a lattice. It is represented as a Hamiltonian path (HP) on a lattice, that is a path that visits each site once and only once. Thus the density of monomer is . A good approximation to the total number of HP on a lattice was shown to be (22) the following:
| (18) |
where N is the total number of points of the lattice and q is the coordination number of the lattice, e.g., on a d-dimensional cubic lattice.
In the case of semiflexible polymers (HP with corner penalty), the partition function is the following (17):
| (19) |
where counts the number of corners of a HP realization.
A saddle-point approximation gives the following corresponding free energy per monomer:
| (20) |
where
| (21) |
is an effective coordination number, , and d is the dimensionality of the lattice. Note that if the corner penalty vanishes, we recover the result of Eq. 18.
As the temperature decreases, the effective coordination number decreases, and the free energy increases. There is a temperature for which , giving a free energy per monomer . For , would become positive in Eq. 20 if the saddle-point approximation were still valid. However, is a negative quantity (18) and, therefore, remains zero the freezing temperature . Consequently for temperatures , the corners are mobile in the bulk, leading to a liquid-like structure for the corners; whereas for , the polymer is frozen in stretched configurations with , in which corners are expelled to the surface and polymer segments tend to be aligned inside (Fig. 8). These configurations have been studied previously: they are elongated neck structures or toroïds (23), whose typical size is given by the following:
| (22) |
where is the internal energy.
This simple model can be extended to the case where the volume fraction . It requires the introduction of the parameter , where χ is the Flory-Huggins parameter of a polymer chain in a solvent and denotes the effective attraction between monomers induced by the proteins. This leads to the computation of the above mentioned phase diagram in terms of the two parameters and .
Results
To make the HP approach more quantitative, it is interesting to relate its parameters to our simplified picture of DNA interacting with proteins. Namely, we would like to relate and to the parameters of the Flory-Huggins free energy in Eq. 1. But in the last one, the monomer-monomer attraction is mediated by spheres. In the dense phase, the total concentration of monomers and spheres: is essentially fixed to the close packing concentration . By inserting this in Eq. 1, we obtain the following:
| (23) |
where we neglect the translational entropy of the polymer in the dense phase and drop the linear terms in as this results in an adjustment of the chemical potentials. We then have the following correspondence:
| (24) |
For low temperature, can reach large negative values. This is mapped to a large in the HP model. Depending on the rigidity of the chain, the dense phase might be globular (low ) or crystalline (large ). The effective monomer density in the dense phase is given by the following:
| (25) |
One important result obtained using a HP model is the phase diagram of a polymer on a lattice (implicit solvent) with bending rigidity, obtained in an earlier mean-field study (17) and then supplemented by Monte Carlo studies (20). We show in our study that the phase diagram of a semiflexible polymer interacting explicitly with spheres in an off-lattice volume is very similar. We performed BD simulations with a polymer chain of beads and protein spheres in a cubic volume of size with periodic boundary conditions (see Materials and Methods). Polymer beads and protein spheres interact through a Lennard-Jones potential with a well depth given by the energy scale ε (in ). We used a Kratky-Porod model of polymer, with bending rigidity characterized by the persistence length . By varying and ε independently, we were able to explore the phase behavior of this system. We monitored the coil-globule transition by looking at the quantity in the following:
| (26) |
where is the radius of gyration of the polymer. For a self-avoiding polymer with scaling law , . In a good solvent, the polymer is swollen with , whereas in a bad solvent it collapses with . It is clear that q varies like ν.
Following the same authors (20), we define the quantity for , in which i runs over all the bonds of the polymer, is the unit vector having the same direction as the bond i and is the unit vector of the corresponding α-axis. We then define , , and the following:
| (27) |
For an isotropic configuration, resulting in . Conversely, for a configuration stretched in one direction, for example, along the x axis, and , resulting in . Thus p measures the directional order of the polymer.
We plotted the phase diagram obtained as a function of and (Fig. 9). There is a clear similarity with the case of a polymer on a lattice without explicit proteins. However, we observe that the coil-globule and globule-crystal transitions occur at a higher interaction energy ε. This might be a consequence of going from a lattice model to a continuous model. It might also be because of the fact that in the high-temperature regime, the concentration of spheres in solution is smaller than the close packing, therefore making it hardly comparable with an actual solvent. There is a specific persistence length such that
-
•
for , the polymer collapses through a second-order coil-globule transition, followed by a first-order globule-crystal transition when ε increases; and
-
•
for , the coil-globule transition no longer exists and the polymer collapses directly from a coil to a crystalline phase through a first-order phase transition.
Discussion
DNA condensation in vitro
The condensation of DNA induced by DNA-binding proteins or ions has been thoroughly studied. It is well known that DNA collapses from disperse structures corresponding to swollen coil configurations into ordered, highly condensed states. This has been the focus of several in vitro experimental studies (24, 25, 26, 27, 28). One important conclusion from these studies is that during its collapse, DNA undergoes phase transitions through the following three phases: isotropic fluid, cholesteric, and crystalline (hexagonal), in agreement with our results. As stated above, within the Flory-Huggins theory, the phase transition induced by ions or DNA-binding proteins appears to be first order, except at the tricritical point and on the critical lines. Therefore, the transition from the swollen to the condensed state should be discontinuous and present hysteresis effects, which was indeed observed (27, 29). Interestingly, the Flory-Huggins theory predicts another effect. At fixed temperature, there is a line of possible coexisting states. Given a certain amount of DNA, we are able to discuss the consequences of adding proteins to the system. The protein concentration would increase from zero until it reaches a value for which the system splits into two phases. If we keep adding proteins, the system will at some point exit the biphasic regime (Fig. 6, C and D). This phenomenon called reentrance has been observed in some experimental work (26).
DNA condensation in vivo
Although it is premature to draw any clear biological conclusion, it is tempting to discuss at least qualitatively the effect of DNA condensation on biological functions. In eukaryotes, nucleosomal organization provides an effective protection against detrimental factors. This organization is absent in prokaryotes, which have a significantly lower ratio of DNA-binding proteins (30). However, in harsh environmental conditions (radiations, temperature, oxidating agents, and radicals), several bacteria resort to DNA condensation mechanisms to protect their genome. Maybe the most spectacular case is the appearance of macroscopical DNA aggregates with crystal-like order in starved E. coli cells. In stressful conditions, the alternative factor is expressed, in response to low temperature, cell surface stress, or oxidative shock. This in turn induces the expression of the DNA-binding protein Dps (31, 32). In starved cells, Dps is the most abundant DNA-binding protein, with ∼20,000 Dps protein per cell. Consequently, DNA is condensed into crystal-like aggregates, which make it less accessible to damaging factors. This process is reversible and wild-type E. coli cells starved for three days remain unaffected by a high dose of oxidating agents whereas mutants lacking Dps lose viability (31). Interestingly, Dps binds nonspecifically to DNA. In regard to what has been discussed in this article, we may infer that when Dps concentration increases, a dense phase appears. But at a scale of Dps size , the apparent rigidity of DNA is large . Therefore, as Fig. 9 shows, this might be a case where the coil-globule transition is precluded by the freezing transition. Other examples of DNA compaction by nonspecific proteins seem to exist (33, 34).
Local concentration effects and transcription
Increasing evidence suggests that transcription proceeds from nucleation points called transcription factories, which are formed from the interaction of DNA with general and dedicated transcription factors. Although the nonspecific hypothesis is not guaranteed, it is true that RNAP can bind widely onto DNA thanks to its σ-unit. The Flory-Huggins results from this article suggest that a biphasic regime can exist, with a dense phase spanning a volume of size and with local concentrations of DNA and RNAP increased by a factor of 4-to-8 with respect to the mean-field ones (Fig. 6 D). This would result in shifting the equilibrium of complexation reactions such as the following:
toward the formation of complexes and may favor transcription initiation. This is consistent with some experimental work showing that RNAP clusters are formed during preinitiation and initiation of transcription (35). The same authors also proposed that crowding of enzymes, i.e., higher local concentrations, may aid in rate-limiting steps of gene regulation. From a dynamical standpoint, the confinement of unbound RNAP in a restricted volume of size can reduce the search time for a promoter. To this extent, it is worthwhile to point out a recent study claiming that the promoter search mechanism is indeed dominated by 3D diffusion of RNAP over the one-dimensional diffusion along DNA (36).
Structure of the dense phase
Earlier studies have demonstrated that the frozen phase can present various metastable states (21). In the limit (N is the length of one chain), the transition timescale from one to another could be very large, and the system might well never equilibrate within biological timescales. Finally, the parallel drawn between the HP theory and the Flory-Huggins theory does not pretend to mathematical rigor. One essential difference is that in our case the attractive interaction between monomers is mediated by spheres. A way to compute more precisely the structure of the dense phase would be to go beyond the homogeneous saddle-point approximation, for instance, by using the so-called self-consistent field theory method (37, 38), which is a very complex method in the case of semiflexible polymers.
Conclusions
We presented in this study two complementary frameworks to describe the phase diagram of polymeric fluids induced by colloids, and we applied it to a DNA chain interacting with DNA-binding proteins. Starting from a Flory-Huggins free energy, we first computed the mean-field phase diagram and found that at low temperature (i.e., high DNA-protein affinity) a biphasic regime exists, consisting of the coexistence of a dilute phase and a concentrated phase. The dilute phase may correspond to swollen configurations of the DNA whereas the concentrated phase is a model for condensed states of DNA. This theory may also apply to DNA condensation by multivalent ions or proteins in general. Second, we addressed the characterization of the dense phase structure and showed that the chain bending rigidity can have dramatic effects. Without bending rigidity, the dense phase has no directional order and is a molten globule. However, when the chain bending rigidity is large enough, there is a freezing transition from the globular to crystalline phase. Eventually for very rigid chains, the coil-globule transition is precluded by the freezing transition and the phase transition predicted in the Flory-Huggins framework does not occur.
In the cell, the existence of a dense phase could be a good approximation for the transcription factories observed experimentally. It is conjectured that this may increase the rate of success in transcription initiation by means of protein crowding and by enhancing the promoter search mechanism. Note that at a scale that is coarse-grained to several thousand base-pairs (gene scale), the chromosome is flexible and the dense phase has the structure of a molten globule. Conversely, at a scale of a few base-pairs, the apparent rigidity of DNA is much higher. Thus, the Dps protein, which binds nonspecifically to DNA, can induce the collapse of the E. coli chromosome into crystal-like aggregates; the dense phase is then frozen. This is not an efficient state for a searching mechanism. But on the contrary, it is very adequate to protect DNA.
The two frameworks are quite general and can be used to describe biological phenomena where DNA compaction occurs under the cooperative effect of binding proteins. In the future, we plan to apply it to other biological cases when more quantitative experiments become available.
Author Contributions
F.K. and H.O. designed the research. G.L.T. and H.O. performed the research; and G.L.T. wrote the software and analyzed the data. All authors contributed to the writing of the article.
Acknowledgments
The authors thank the MEGA team members at iSSB for excellent discussions. This work was supported by the IDEX Paris-Saclay grant, CNRS Genopole, and the ANR project Synpathic.
Editor: Rohit Pappu
References
- 1.Montero Llopis P., Jackson A.F., Jacobs-Wagner C. Spatial organization of the flow of genetic information in bacteria. Nature. 2010;466:77–81. doi: 10.1038/nature09152. [DOI] [PMC free article] [PubMed] [Google Scholar]
- 2.Schoenfelder S., Sexton T., Fraser P. Preferential associations between co-regulated genes reveal a transcriptional interactome in erythroid cells. Nat. Genet. 2010;42:53–61. doi: 10.1038/ng.496. [DOI] [PMC free article] [PubMed] [Google Scholar]
- 3.Xu M., Cook P.R. Similar active genes cluster in specialized transcription factories. J. Cell Biol. 2008;181:615–623. doi: 10.1083/jcb.200710053. [DOI] [PMC free article] [PubMed] [Google Scholar]
- 4.Caudron-Herger M., Cook P.R., Papantonis A. Dissecting the nascent human transcriptome by analysing the RNA content of transcription factories. Nucleic Acids Res. 2015;43:e95. doi: 10.1093/nar/gkv390. [DOI] [PMC free article] [PubMed] [Google Scholar]
- 5.Junier I., Martin O., Képès F. Spatial and topological organization of DNA chains induced by gene co-localization. PLOS Comput. Biol. 2010;6:e1000678. doi: 10.1371/journal.pcbi.1000678. [DOI] [PMC free article] [PubMed] [Google Scholar]
- 6.Spilianakis C.G., Lalioti M.D., Flavell R.A. Interchromosomal associations between alternatively expressed loci. Nature. 2005;435:637–645. doi: 10.1038/nature03574. [DOI] [PubMed] [Google Scholar]
- 7.Sheinman M., Bénichou O., Voituriez R. Classes of fast and specific search mechanisms for proteins on DNA. Rep. Prog. Phys. 2012;75:026601. doi: 10.1088/0034-4885/75/2/026601. [DOI] [PubMed] [Google Scholar]
- 8.Berg O.G., von Hippel P.H. Diffusion-driven mechanisms of protein translocation on nucleic acids 2. American Chemical Society. 1981;20:6948–6960. doi: 10.1021/bi00527a029. [DOI] [PubMed] [Google Scholar]
- 9.de Gennes P. Cornell University Press; Cornell, NY: 1979. Scaling Concepts in Polymer Physics. [Google Scholar]
- 10.Sear R.P. Flory-Huggins theory for athermal mixtures of hard spheres and larger flexible polymers. Phys. Rev. E Stat. Nonlin. Soft Matter Phys. 2002;66:051401. doi: 10.1103/PhysRevE.66.051401. [DOI] [PubMed] [Google Scholar]
- 11.Elowitz M.B., Surette M.G., Leibler S. Protein mobility in the cytoplasm of Escherichia coli. J. Bacteriol. 1999;181:197–203. doi: 10.1128/jb.181.1.197-203.1999. [DOI] [PMC free article] [PubMed] [Google Scholar]
- 12.Kahramanoglou C., Seshasayee A.S.N., Luscombe N.M. Direct and indirect effects of H-NS and Fis on global gene expression control in Escherichia coli. Nucleic Acids Res. 2011;39:2073–2091. doi: 10.1093/nar/gkq934. [DOI] [PMC free article] [PubMed] [Google Scholar]
- 13.Nowak-Lovato K., Alexandrov L.B., Alexandrov B.S. Binding of nucleoid-associated protein fis to DNA is regulated by DNA breathing dynamics. PLOS Comput. Biol. 2013;9:e1002881. doi: 10.1371/journal.pcbi.1002881. [DOI] [PMC free article] [PubMed] [Google Scholar]
- 14.Ishihama A., Kori A., Fujita N. Intracellular concentrations of 65 species of transcription factors with known regulatory functions in Escherichia coli. J. Bacteriol. 2014;196:2718–2727. doi: 10.1128/JB.01579-14. [DOI] [PMC free article] [PubMed] [Google Scholar]
- 15.Johnson J., Brackley C.A., Marenduzzo D. A simple model for DNA bridging proteins and bacterial or human genomes: bridging-induced attraction and genome compaction. J. Phys. Condens. Matter. 2015;27:064119. doi: 10.1088/0953-8984/27/6/064119. [DOI] [PubMed] [Google Scholar]
- 16.Brackley C.A., Taylor S., Marenduzzo D. Nonspecific bridging-induced attraction drives clustering of DNA-binding proteins and genome organization. Proc. Natl. Acad. Sci. USA. 2013;110:E3605–E3611. doi: 10.1073/pnas.1302950110. [DOI] [PMC free article] [PubMed] [Google Scholar]
- 17.Doniach S., Garel T., Orland H. Phase diagram of a semiflexible polymer chain in a theta solvent: application to protein folding. J. Chem. Phys. 1996;105:1601–1608. [Google Scholar]
- 18.Bascle J., Garel T., Orland H. Mean-field theory of polymer melting. J. Phys. Math. Gen. 1992;25:1323. [Google Scholar]
- 19.Bascle J., Garel T., Orland H. Formation and stability of secondary structures in globular proteins. J. Phys. II France. 1993;3:245–253. [Google Scholar]
- 20.Bastolla U., Grassberger P. Phase transitions of single semistiff polymer chains. J. Stat. Phys. 1997;89:1061–1078. [Google Scholar]
- 21.Doye J.P.K., Sear R.P., Frenkel D. The effect of chain stiffness on the phase behaviour of isolated homopolymers. J. Chem. Phys. 1998;108:2134–2142. [Google Scholar]
- 22.Orland H., Itzykson C., de Dominicis C. An evaluation of the number of Hamiltonian paths. J. Physique Lett. 1985;46:353–357. [Google Scholar]
- 23.Montesi A., Pasquali M., MacKintosh F.C. Collapse of a semiflexible polymer in poor solvent. Phys. Rev. E Stat. Nonlin. Soft Matter Phys. 2004;69:021916. doi: 10.1103/PhysRevE.69.021916. [DOI] [PubMed] [Google Scholar]
- 24.Bloomfield V.A. DNA condensation. Curr. Opin. Struct. Biol. 1996;6:334–341. doi: 10.1016/s0959-440x(96)80052-2. [DOI] [PubMed] [Google Scholar]
- 25.Livolant F., Leforestier A. Condensed phases of DNA: structures and phase transitions. Prog. Polym. Sci. 1996;21:1115–1164. [Google Scholar]
- 26.Vasilevskaya V.V., Khokhlov A.R., Yoshikawa K. Collapse of single DNA molecule in poly(ethylene glycol) solutions. J. Chem. Phys. 1995;102:6595–6602. [Google Scholar]
- 27.Yoshikawa K., Matsuzawa Y. Discrete phase transition of giant DNA dynamics of globule formation from a single molecular chain. Physica D. 1995;84:220–227. [Google Scholar]
- 28.Durand D., Doucet J., Livolant F. A study of the structure of highly concentrated phases of DNA by X-ray diffraction. J. Phys. II France. 1992;2:1769–1783. [Google Scholar]
- 29.Widom J., Baldwin R.L. Cation-induced toroidal condensation of DNA studies with Co3+(NH3)6. J. Mol. Biol. 1980;144:431–453. doi: 10.1016/0022-2836(80)90330-7. [DOI] [PubMed] [Google Scholar]
- 30.Kellenberger E., Arnold-Schulz-Gahmen B. Chromatins of low-protein content: special features of their compaction and condensation. FEMS Microbiol. Lett. 1992;100:361–370. doi: 10.1111/j.1574-6968.1992.tb14064.x. [DOI] [PubMed] [Google Scholar]
- 31.Almirón M., Link A.J., Kolter R. A novel DNA-binding protein with regulatory and protective roles in starved Escherichia coli. Genes Dev. 1992;6(12B):2646–2654. doi: 10.1101/gad.6.12b.2646. [DOI] [PubMed] [Google Scholar]
- 32.Altuvia S., Almirón M., Storz G. The dps promoter is activated by OxyR during growth and by IHF and sigma S in stationary phase. Mol. Microbiol. 1994;13:265–272. doi: 10.1111/j.1365-2958.1994.tb00421.x. [DOI] [PubMed] [Google Scholar]
- 33.Frenkiel-Krispin D., Minsky A. Nucleoid organization and the maintenance of DNA integrity in E. coli, B. subtilis and D. radiodurans. J. Struct. Biol. 2006;156:311–319. doi: 10.1016/j.jsb.2006.05.014. [DOI] [PubMed] [Google Scholar]
- 34.Newton G.L., Aguilera J.A., Fahey R.C. Polyamine-induced compaction and aggregation of DNA--a major factor in radioprotection of chromatin under physiological conditions. Radiat. Res. 1996;145:776–780. [PubMed] [Google Scholar]
- 35.Cisse I.I., Izeddin I., Darzacq X. Real-time dynamics of RNA polymerase II clustering in live human cells. Science. 2013;341:664–667. doi: 10.1126/science.1239053. [DOI] [PubMed] [Google Scholar]
- 36.Wang F., Redding S., Greene E.C. The promoter-search mechanism of Escherichia coli RNA polymerase is dominated by three-dimensional diffusion. Nat. Struct. Mol. Biol. 2013;20:174–181. doi: 10.1038/nsmb.2472. [DOI] [PMC free article] [PubMed] [Google Scholar]
- 37.Edwards S.F., Doi M. Oxford University Press; Oxford, UK: 1988. The Theory of Polymer Dynamics. International Series of Monographs on Physics. [Google Scholar]
- 38.Fredrickson G. Oxford University Press; Oxford, UK: 2005. The Equilibrium Theory of Inhomogeneous Polymers. International Series of Monographs on Physics. [Google Scholar]