

See Rabinovici (doi: 10.1093/brain/aww025 ) for a scientific commentary on this article.
The success of disease-modifying therapies in Alzheimer’s disease may depend on detecting the earliest signs of abnormal amyloid-β load. Palmqvist et al . show that CSF amyloid-β 42 becomes abnormal before amyloid PET and before neurodegeneration onset in preclinical Alzheimer’s disease. This may have implications for risk factor interventions and future therapies.
Keywords: Alzheimer’s disease, CSF Aβ42, PET, amyloid-β, florbetapir
See Rabinovici (doi: 10.1093/brain/aww025 ) for a scientific commentary on this article.
The success of disease-modifying therapies in Alzheimer’s disease may depend on detecting the earliest signs of abnormal amyloid-β load. Palmqvist et al . show that CSF amyloid-β 42 becomes abnormal before amyloid PET and before neurodegeneration onset in preclinical Alzheimer’s disease. This may have implications for risk factor interventions and future therapies.
Abstract
See Rabinovici (doi: 10.1093/brain/aww025 ) for a scientific commentary on this article.
Cerebral accumulation of amyloid-β is thought to be the starting mechanism in Alzheimer’s disease. Amyloid-β can be detected by analysis of cerebrospinal fluid amyloid-β 42 or amyloid positron emission tomography, but it is unknown if any of the methods can identify an abnormal amyloid accumulation prior to the other. Our aim was to determine whether cerebrospinal fluid amyloid-β 42 change before amyloid PET during preclinical stages of Alzheimer’s disease. We included 437 non-demented subjects from the prospective, longitudinal Alzheimer’s Disease Neuroimaging Initiative (ADNI) study. All underwent 18 F-florbetapir positron emission tomography and cerebrospinal fluid amyloid-β 42 analysis at baseline and at least one additional positron emission tomography after a mean follow-up of 2.1 years (range 1.1–4.4 years). Group classifications were based on normal and abnormal cerebrospinal fluid and positron emission tomography results at baseline. We found that cases with isolated abnormal cerebrospinal fluid amyloid-β and normal positron emission tomography at baseline accumulated amyloid with a mean rate of 1.2%/year, which was similar to the rate in cases with both abnormal cerebrospinal fluid and positron emission tomography (1.2%/year, P = 0.86). The mean accumulation rate of those with isolated abnormal cerebrospinal fluid was more than three times that of those with both normal cerebrospinal fluid and positron emission tomography (0.35%/year, P = 0.018). The group differences were similar when analysing yearly change in standardized uptake value ratio of florbetapir instead of percentage change. Those with both abnormal cerebrospinal fluid and positron emission tomography deteriorated more in memory and hippocampal volume compared with the other groups ( P < 0.001), indicating that they were closer to Alzheimer’s disease dementia. The results were replicated after adjustments of different factors and when using different cut-offs for amyloid-β abnormality including a positron emission tomography classification based on the florbetapir uptake in regions where the initial amyloid-β accumulation occurs in Alzheimer’s disease. This is the first study to show that individuals who have abnormal cerebrospinal amyloid-β 42 but normal amyloid-β positron emission tomography have an increased cortical amyloid-β accumulation rate similar to those with both abnormal cerebrospinal fluid and positron emission tomography and higher rate than subjects where both modalities are normal. The results indicate that cerebrospinal fluid amyloid-β 42 becomes abnormal in the earliest stages of Alzheimer’s disease, before amyloid positron emission tomography and before neurodegeneration starts.
Introduction
The identification and early treatment of Alzheimer’s disease is a top priority worldwide. A starting event in the pathogenesis of Alzheimer’s disease is the accumulation of amyloid-β in the brain ( Sperling et al. , 2011 ). This has been shown in studies of both sporadic and familial Alzheimer’s disease ( Bateman et al. , 2012 ; Vos et al. , 2013 ). As the disease progresses, affected individuals show neurodegeneration and early clinical symptoms and may be diagnosed with mild cognitive impairment (MCI) ( Albert et al. , 2011 ). Ongoing disease-modifying trials targeting amyloid-β have shown promising results ( Biogen, 2015 ) and secondary prevention trials have been started with anti-amyloid therapies in asymptomatic subjects with signs of amyloid-β pathology ( Sperling et al. , 2014 ). These interventions will most likely have best effect if initiated as early as possible ( Sperling et al. , 2011 ; Hardy et al. , 2014 ). It is therefore important to be able to detect the earliest signs of an abnormal amyloid-β load. Currently, there are two methods for assessing amyloid-β in vivo ; PET using ligands that binds to amyloid-β fibrils (amyloid PET) or CSF measurement of the 42-amino acid isoform of amyloid-β (amyloid-β 42 ). Many studies have shown that these methods have a high agreement ( Fagan et al. , 2006 , 2009 ; Grimmer et al. , 2009 ; Jagust et al. , 2009 ; Tolboom et al. , 2009 ; Weigand et al. , 2011 ; Landau et al. , 2013 ; Mattsson et al. , 2014 ; Palmqvist et al. , 2014 , 2015 ). However, roughly 10–20% of examined subjects show discordant results (with a higher proportion in asymptomatic individuals) and most often with abnormal CSF amyloid-β 42 levels and normal amyloid PET (CSF+/PET−) ( Cairns et al. , 2009 ; Fagan et al. , 2009 ; Jagust et al. , 2009 ; Landau et al. , 2013 ; Palmqvist et al. , 2014 ). This may indicate that the abnormal accumulation of amyloid-β in preclinical Alzheimer’s disease can be detected earlier with CSF amyloid-β 42 than with amyloid PET ( Fagan et al. , 2006 , 2009 ; Morris et al. , 2010 ; Mattsson et al. , 2014 ). However, these arguments are only based on cross-sectional results and there are also contradictory cross-sectional results suggesting that amyloid PET may become abnormal first ( Landau et al. , 2013 ). An alternative explanation for the presence of CSF+/PET− in cognitively healthy subjects could be that isolated CSF+ is caused by other conditions than preclinical Alzheimer’s disease or by analytical artefacts, and thereby lack pathological relevance ( Fagan et al. , 2009 ; Mattsson et al. , 2014 ). If this is true, CSF+/PET− subjects would not be expected to show signs of amyloid-β accumulation over time, as PET+ individuals do in preclinical Alzheimer’s disease ( Villemagne et al. , 2013 ).
To test the hypothesis that CSF amyloid-β 42 becomes abnormal before amyloid PET in preclinical Alzheimer’s disease we examined if CSF+/PET− subjects accumulate amyloid-β at an abnormal rate, as measured by repeated amyloid PET measurements. We also tested the hypothesis that CSF+/PET− subjects lack signs of a neurodegenerative process, which should not be present at the earliest preclinical stage of Alzheimer’s disease according to the dominant model of Alzheimer’s disease biomarker development ( Jack et al. , 2010 , 2013 ).
Materials and methods
Study design
Data used in the preparation of this article were obtained from the ADNI database (adni.loni.usc.edu). The ADNI was launched in 2004 by the National Institute on Aging, the Food and Drug Administration, private pharmaceutical companies and non-profit organizations as a highly innovative public-private partnership. The primary goal of ADNI has been to test whether serial MRI, PET, other biological markers, and clinical and neuropsychological assessment can be combined to measure the progression of MCI and early Alzheimer’s disease. The Principal Investigator of this initiative is Michael W. Weiner, MD, VA Medical Center and University of California, San Francisco. ADNI is the result of efforts of many co-investigators from a broad range of academic institutions and private corporations, and subjects have been recruited from over 50 sites across the USA and Canada. The initial goal of ADNI was to recruit 800 subjects, but ADNI has been followed by ADNI-GO and ADNI-2. To date these three protocols have recruited over 1500 adults. For more information, see www.adni-info.org .
Participants
Data were downloaded from the ADNI database (adni.loni.usc.edu). We included only non-demented subjects diagnosed as cognitively healthy controls, early MCI or late MCI. Patients with dementia (due to Alzheimer’s disease) were excluded as the aim was to examine detection of the earliest accumulation of amyloid-β, which precedes the dementia stage by many years. Inclusion/exclusion criteria are described in detail at www.adni-info.org . Briefly, all subjects in the present study were included in ADNI-2 and were between the ages of 55 and 90 years, had completed at least 6 years of education, were fluent in Spanish or English, and were free of any significant neurological disease other than Alzheimer’s disease. Controls had Mini-Mental State Examination score (MMSE) ≥24 ( Folstein et al. , 1975 ), and Clinical Dementia Rating scale (CDR) score 0 ( Morris, 1993 ). Subjects classified as MCI had MMSE score ≥24, objective memory loss as shown on scores on delayed recall on the Wechsler Memory Scale Logical Memory II, CDR 0.5, preserved activities of daily living, and absence of dementia. Early and late MCI was differentiated based on the score of Wechsler Memory Scale Logical Memory II (cut-offs ranging from 2 to 8 depending on education level). Only subjects who had at least two 18 F-florbetapir PET scans and CSF data from the same visit as the first PET scan were included. This resulted in a population of 437 subjects. The first visit where both CSF and PET data were available was defined as baseline in the present study.
Amyloid PET
Amyloid-β deposition was visualized using 18 F-florbetapir PET. We used data from the latest available dataset (‘UCBERKELEYAV45_01_26_15.csv’). All subjects had a baseline scan and a follow-up scan. If three scans were available, the last one was chosen for the longitudinal analysis. The methods for PET acquisition and analysis have been described in more detail previously ( Landau et al. , 2012 ). The global cortical mean standardized uptake value ratio (SUVR) was calculated relative to a reference region. For the present study we used a composite region made up of the whole cerebellum, brainstem/pons, and subcortical white matter. This composite region has provided more reliable longitudinal florbetapir results in ADNI compared to using only the cerebellum as reference region ( Landau et al. , 2014 ; Landau and Jagust, 2015 ). The global neocortical uptake was calculated from the weighted mean uptake in the frontal, lateral parietal, lateral temporal and cingulate regions to account for the varying sizes of the regions ( Landau and Jagust, 2015 ). We also created an additional composite region to assess amyloid-β deposition in brain regions where the deposition is believed to start. The first stage of amyloid-β accumulation has been suggested to occur in the basal medial part of the frontal lobe and the basal part of the temporal lobe ( Braak and Braak, 1991 ; Goedert, 2015 ). The latter region was not available in the ADNI dataset ( Landau and Jagust, 2015 ), but the former was captured using the weighted mean uptake in the left and right medial orbitofrontal cortex, lateral orbitofrontal cortex and the frontal pole (hereafter called the ‘early amyloid-β region’). These early accumulation regions suggested by Braak and Braak (1991) overlap with the results of some amyloid PET studies ( Villain et al. , 2012 ; Sepulcre et al. , 2013 ), but a recent PET study has found that the accumulation might start in the precuneus and the medial prefrontal cortex ( Villeneuve et al. , 2015 ). However, we have chosen to create our early amyloid-β region according to the Braak staging but acknowledge that there might be other early regions that are not captured in this staging. Future studies need to clarify this further.
CSF biomarkers
Amyloid-β 42 , total (T)-tau and phosphorylated (P)-tau were measured using the multiplex xMAP Luminex platform (Luminex Corp) with the INNOBIA AlzBio3 kit (Innogenetics) ( Olsson et al. , 2005 ; Shaw et al. , 2009 ). For this study, we combined data from the datasets ‘UPENNBIOMK5_10_31_13.csv’, ‘UPENNBIOMK6_07_02_13.csv’, ‘UPENNBIOMK7.csv’, and ‘UPENNBIOMK8.csv’.
Composite memory score
A composite memory score was used to assess memory function. This is a weighted score based on memory items in Rey Auditory Verbal Learning Test (RAVLT), the ADAS-cog, the MMSE and Logical Memory ( Crane et al. , 2012 ). To examine longitudinal changes, data were extracted from baseline and the 12-, 24-, 36-, 48- and 60-month visits.
MRI data
Structural MRI brain scans were acquired using 3 T MRI scanners as previously described ( Jack et al. , 2008 ). Automated volume measures were performed with FreeSurfer version 5.1 ( http://surfer.nmr.mgh.harvard.edu/fswiki ). Hippocampal volumes were extracted from the merged ADNI dataset (‘ADNIMERGE.csv’). Cross-sectional volumes were divided by the total intracranial volume ( Table 1 ). For longitudinal analyses, all available data were used (ADNI baseline and the 3, 6, 12, 18, 24, 36, 48, 60, 72, 84 and 96 month visits). To examine the relationship between the global amyloid-β accumulation and atrophy changes, a composite MRI region of interest was calculated as the average cortical thickness of the regions used in the global neocortical PET volume of interest. The cortical thickness measures from ADNI baseline and the 3, 6, 12, 24, 36, and 48-month visits were extracted from the file ‘UCSFFSX51_05_20_15.csv’.
Table 1.
Baseline characteristics
| A | B | C | P- value | |
|---|---|---|---|---|
| CSF−/PET− | CSF+/PET− | CSF+/PET+ | ||
| n | 160 | 26 | 167 | |
| Baseline CN/EMCI/LMCI | 69/88/24 | 14/9/3 | 31/68/68 a | A-B = 0.49; B-C < 0.001 |
| Age (range, yrs) | 71.9 (55–94) | 73.9 (58–91) | 73.2 (55–88) | 0.13 |
| Sex (females) | 45% | 35% | 48% | 0.22 |
| MMSE (points) | 28.7 (1.5) | 28.7 (2.2) | 27.8 (2.7) | A-B = 0.97; B-C = 0.026 |
| Composite memory score | 0.73 (0.56) | 0.63 (0.42) | 0.27 (0.53) | A-B = 0.44; B-C = 0.001 |
| Composite executive function score | 0.78 (0.76) | 0.61 (0.64) | 0.28 (0.73) | A-B = 0.26; B-C = 0.027 |
| APOE ϵ4 allele | 16% | 42% | 69% | A-B = 0.005; B-C = 0.13 |
| Education (yrs) | 16.6 (2.7) | 16.8 (2.2) | 16.0 (2.6) | 0.091 |
| Hippocampal/intracranial volume b | 0.025 (0.0003) | 0.025 (0.0003) | 0.023 (0.0004) | A-B = 0.31; B-C = 0.012 |
| Cortical thickness of the global PET region (mm) c | 2.42 (0.10) | 2.40 (0.11) | 2.39 (0.02) | 0.17 |
| Global florbetapir PET (SUVR) d | 0.70 (0.03) | 0.71 (0.03) | 0.98 (0.08) | A-B = 0.072; B-C < 0.001 |
| CSF amyloid-β 42 (ng/l) | 238 (25) | 162 (18) | 135 (21) | A-B < 0.001; B-C < 0.001 |
| CSF T-tau (ng/l) | 58 (24) | 56 (21) | 115 (52) | A-B = 0.79; B-C < 0.001 |
| CSF P-tau (ng/l) | 29 (13) | 27 (14) | 54 (25) | A-B = 0.19; B-C < 0.001 |
Data are given in mean values (standard deviation, SD) if not otherwise specified. Kruskal-Wallis test was not significant for age, sex, education or cortical thickness of the global PET region. Comparisons were made between A-B and B-C using Mann-Whitney analysis. Borderline cases were excluded in this table. There were no CSF−/PET+ subjects.
a Two subjects who were cognitively normal at the ADNI baseline converted to MCI at baseline for the present study. These have been categorized as late MCI.
b Similar results were obtained when hippocampal volume was compared between the groups using a linear regression model with intracranial volume as a covariate (A-B, P = 0.44; B-C, P = 0.007).
c The average cortical thickness of the brain regions included in the global PET volume of interest.
d Global neocortical uptake relative a composite reference region.
CI = confidence interval; CN = cognitively normal; EMCI = early MCI; LMCI = late MCI; n = number of subjects.
Grouping of subjects
The subjects were categorized into four groups depending on the baseline CSF amyloid-β 42 and florbetapir PET status; normal CSF and PET (CSF−/PET−), abnormal CSF and normal PET (CSF+/PET−), abnormal CSF and PET (CSF+/PET+) and normal CSF and abnormal PET (CSF−/PET+). A cut-off for abnormal PET status using the composite reference region has been defined previously at > 0.79 SUVR ( Joshi et al. , 2012 ; Landau and Jagust, 2015 ). For CSF amyloid-β 42 , a cut-off has previously been defined at CSF amyloid-β 42 <192 ng/l ( Shaw et al. , 2009 ; De Meyer et al. , 2010 ; Weigand et al. , 2011 ). For this study we excluded borderline cases and used cut-offs that were ±5% from the original cut-offs to avoid drawing conclusions based on borderline cases that easily could be misclassified because of variability of the measurements. This approach increases validity of the classification and has also been used in previous publications on CSF/PET agreement ( Landau et al. , 2013 ; Mattsson et al. , 2014 ). The cut-offs used in the present study were thus: ‘CSF amyloid-β 42 +’ <182.4 ng/l, ‘CSF amyloid-β 42 −’ >201.6 ng/l, ‘amyloid-β PET+’ >0.8295 SUVR and ‘amyloid-β PET−’ <0.7505 SUVR.
A second PET classification was done using the ‘early amyloid-β region’ (see above). As no previous cut-off has been established for this region, we used mixture modelling analysis (see ‘Statistical analysis’ section), which produced the cut-off 0.817 SUVR relative the composite reference region. When applying a ± 5% interval for the cut-off to exclude borderline cases, the final cut-offs were ‘early amyloid-β PET+’ >0.8579 SUVR and ‘early amyloid-β PET–’ <0.7762 SUVR.
Statistical analysis
Group differences were first tested with the Kruskal-Wallis test and if significant they were analysed further with the Mann-Whitney U-test or χ 2 test ( Tables 1–3 ). The main dependent variable was the annual SUVR change. We also calculated the relative annual SUVR change in percentage (yearly SUVR change/SUVR at baseline) for easier comparison with other studies that have used other PET tracers, SUVR regions or SUVR reference regions. Full factorial general linear models were used to adjust for sex, age, APOE genotype (presence of APOE ϵ4) and time between PET scans, regarding group differences in SUVR amyloid-β accumulation, memory change and hippocampal volume change. Local regression fits were modelled using the least-squares criterion to fit a line to a set of data points (‘LOESS’) ( Jacoby, 2000 ). Univariate linear relationships were analysed using Spearman correlations. Longitudinal changes in memory score and hippocampal volume were modelled using linear regression with data from the different visits. Mixture modelling was performed with R version 3.1 (R Foundation for Statistical Computing, Vienna, Austria, 2013). Mixture modelling provides an unbiased and unsupervised way of determining a cut-off ( Benaglia et al. , 2009 ). It requires a bimodal distribution of the studied condition/biomarker, which for example is the case in amyloid-β pathology but often not in tau. It does not require the knowledge of the underlying biomarker/disease status, as in receiver operating characteristics (ROC) analysis where you also need both a training and validation population. Mixture modelling has successfully been used previously for CSF amyloid-β 42 and amyloid PET data in large studies such as ADNI ( Toledo et al. , 2015 ), AiBL ( Pietrzak et al. , 2015 ) and the Swedish BioFINDER study ( Palmqvist et al. , 2014 ). Regression coefficients and intercepts were calculated in Microsoft Excel version 14.4.5 for Mac ( Pfister et al. , 2013 ). All other statistical analyses were performed with SPSS for Mac, version 22.0 (SPSS Inc., Chicago, IL).
Table 2.
Longitudinal comparisons of amyloid-β accumulation, memory and hippocampal volume
| A | B | C | P- value | |
|---|---|---|---|---|
| CSF–/PET– | CSF+/PET– | CSF+/PET+ | ||
| n | 160 | 26 | 167 | |
| Years between PET scans (range) | 2.1 (1.1–4.4) | 2.1 (1.9–3.9) | 2.1 (1.7–4.0) | 0.73 |
| Global amyloid-β PET (SUVR change/year) | 0.0024 (0.0010–0.0039) | 0.0083 (0.0036–0.013) | 0.011 (0.0083–0.013) | A-B = 0.015 B-C = 0.28 |
| Global amyloid-β PET (% SUVR change/year) | 0.35% (0.14–0.56) | 1.2% (0.49–1.8) | 1.2% (0.90–1.4) | A-B = 0.018 B-C = 0.86 |
| Memory coefficient (score/year) | 0.043 (0.015–0.070) | 0.067 (0.011–0.12) | −0.096 (−0.12 to − 0.067) | A-B = 0.36 B-C < 0.001 |
| Hippocampal volume coefficient (cm 3 /year) | −0.11 (−0.13 to − 0.083) | −0.027 (−0.13 – 0.077) | −0.21 (−0.24 to − 0.18) | A-B = 0.57 B-C < 0.001 |
Data are given in mean values (95% CI) if not otherwise specified. Kruskal-Wallis test was not significant for years between PET scans. Comparisons were made between A-B and B-C using Mann-Whitney analysis. All significant differences were also significant after adjusting for age, sex, prevalence of APOE ϵ4 , time between PET scans (for SUVR) and baseline memory score and hippocampal volume (for the memory and hippocampal volume coefficients). Borderline cases were excluded in this table. There were no CSF−/PET+ subjects.
CI = confidence interval.
Table 3.
New CSF/PET group comparisons based on early regional amyloid-β deposition
| A | B | C | P- value | |
|---|---|---|---|---|
| CSF–/PET– a | CSF+/PET– a | CSF+/PET+ a | ||
| n | 168 | 26 | 160 | |
| Baseline global amyloid-β PET (mean SUVR, SD) | 0.71 (0.03) | 0.72 (0.05) | 0.98 (0.08) | A-B = 0.09 B-C < 0.001 |
| Baseline early amyloid-β region PET (mean SUVR, SD) | 0.72 (0.05) | 0.72 (0.03) | 1.01 (0.09) | A-B = 0.76 B-C < 0.001 |
| Global amyloid-β PET (SUVR change/year) | 0.0016 (−0.0000–0.0031) | 0.096 (CI 0.005–0.014) | 0.011 (0.008–0.014) | A-B < 0.001 B-C = 0.43 |
| Global amyloid-β PET (% SUVR change/year) | 0.23% (0.015–0.45) | 1.3% (95% 0.71–1.89) | 1.2% (95% 0.91–1.5) | A-B = 0.001 B-C = 0.91 |
| Early amyloid-β PET region (SUVR change/year) | 0.0007 (−0.0011–0.0025) | 0.011 (0.007–0.016) | 0.012 (0.008–0.015) | A-B < 0.001 B-C = 0.86 |
| Early amyloid-β PET region (% SUVR change/year) | 0.15% (−0.1–0.41) | 1.6% (0.95–2.3) | 1.2% (0.9–1.6) | A-B < 0.001 B-C = 0.38 |
a PET group (+/–) was based on SUVR in a region comprised of the medial and lateral orbitofrontal cortex and the frontal pole, i.e. regions involved in early amyloid-β accumulation ( Braak and Braak, 1991 ; Goedert, 2015 ).
The CSF−/PET+ subject ( n = 1) and the borderline cases ( n = 82) were excluded from the analyses. Kruskal-Wallis test was significant for all variables ( P < 0.001). SUVR data are given in mean values (95% CI) if not otherwise specified and relative a composite reference region. Comparisons were made between A-B and B-C using Mann-Whitney analysis. All significant differences were also significant after adjusting for age, sex, prevalence of APOE ϵ4 and time between PET scans (data not shown in the table).
Results
Cross-sectional analysis
Baseline data are shown in Table 1 . The delay between baseline lumbar puncture and PET scan dates was on average 12 days (range: 0–129 days). The classification of subjects resulted in 26 CSF+/PET−, 160 CSF−/PET−, 167 CSF+/PET+, 0 CSF−/PET+, and 84 borderline cases (±5% within the cut-offs). The CSF and PET classification is shown in Fig. 1 . The CSF+/PET− group consisted of 54% healthy elderly controls, 35% early MCI and 11% late MCI. The distribution was similar in the CSF−/PET− group ( P = 0.49). The CSF+/PET+ group had more MCI subjects compared with the other groups ( P < 0.001). There were no significant differences in prevalence of the APOE ϵ4 allele between the CSF+/PET− and CSF+/PET+ groups ( P = 0.13), but the prevalence was significantly lower in the CSF−/PET− group ( P = 0.005). CSF amyloid-β 42 in the CSF+/PET− group was significantly higher than in the CSF+/PET+ group (mean difference 27 ng/l; 95% CI 18–36) and significantly lower than in the CSF−/PET− group (difference −76 ng/l; 95% CI 66–86). There were no significant differences in T-tau and P-tau levels between the CSF+/PET− and CSF−/PET− groups. CSF+/PET+ had T-tau and P-tau levels that were almost twice that of CSF+/PET − ( P <0.001) and smaller mean hippocampal volume ( P = 0.012).
Figure 1.
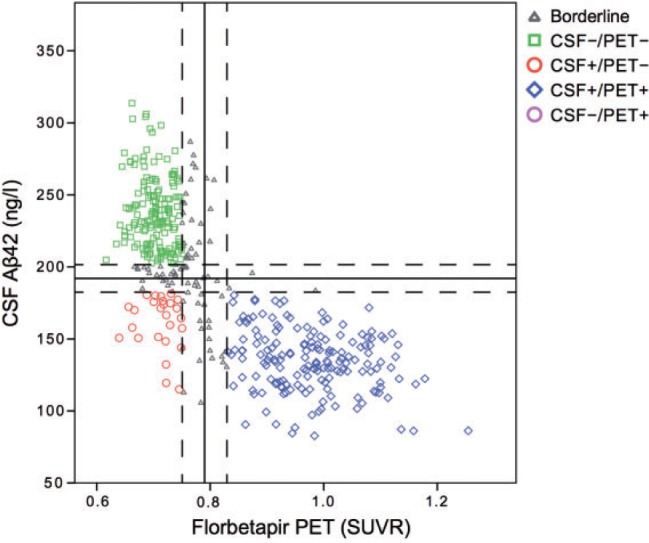
CSF amyloid-β42 levels versus global amyloid PET SUVR relative to the composite region . Solid lines represent the predefined thresholds for CSF amyloid-β 42 (<192 ng/l) and florbetapir PET (>0.79 SUVR). Dashed lines represent a ± 5% interval from the thresholds, which was used in the final classification to exclude borderlines cases. Aβ42 = amyloid-β 42 .
Longitudinal change in amyloid-β as determined by amyloid PET
The average time between the first and last florbetapir scan was 2.1 years without differences between the groups ( P = 0.73). Yearly amyloid-β accumulation rates are shown in Table 2 and Fig. 2 . The CSF+/PET− group had a mean amyloid-β accumulation rate (i.e. change in florbetapir SUVR per year) that was more than three times that of the CSF−/PET− group ( P < 0.01 adjusted for age, APOE genotype, sex and time between PET scans) and a similar accumulation rate compared with CSF+/PET+ (1.2% per year for both; adjusted P = 0.60). Figure 3 shows the yearly amyloid-β accumulation in relation to baseline CSF amyloid-β 42 levels for the PET− group ( Fig. 3 A) and the PET+ group ( Fig. 3 B). The CSF−/PET− subjects showed very modest amyloid-β accumulation rates throughout the whole range of CSF amyloid-β 42 levels, but with a tendency of increased accumulation rates at the lower CSF amyloid-β 42 values closer to the cut-off ( Fig 3 A). However, the increased amyloid-β accumulation rate as a function of lower CSF amyloid-β 42 levels was much more pronounced for the CSF+/PET− group. In this group the cases with clearly reduced CSF amyloid-β 42 levels had similar rates of amyloid-β accumulation as the CSF+/PET+ group. In the CSF+/PET+ group the accumulation rate of amyloid-β had already reached a plateau and showed rates unrelated to CSF amyloid-β 42 levels ( Fig. 3 B). To investigate whether the plateau in the amyloid-β accumulation rate was driven by an increased atrophy rate in the CSF+/PET+ group we investigated the correlations between the global PET SUVR change/year with the cortical thickness change/year of the same composite neocortical region of interest. There were no significant correlations between these measures in any of the CSF/PET groups ( P = 0.25–0.78). Specifically, there was no significant correlation in the CSF+/PET+ group to support that a plateau in the rate of amyloid-β accumulation was caused mainly by an increased cortical atrophy rate (r s = 0.05; P = 0.53).
Figure 2.
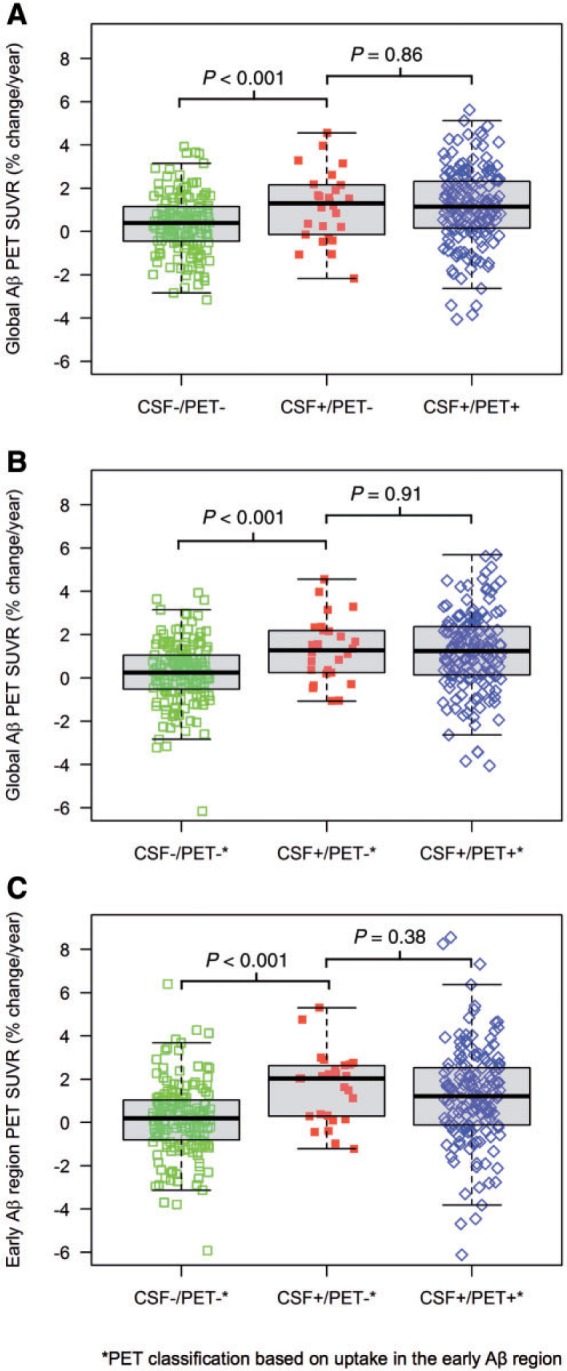
Boxplots of the amyloid-β accumulation rate (% SUVR change/year) for the different groups. Group comparisons were analysed with Mann-Whitney. There were no CSF–/PET+ individuals in A and only one in B and C . Therefore, this group is not shown. ( A ) Amyloid-β accumulation rate in the global neocortical region. Group classifications were based on the a priori cut-offs for amyloid-β 42 (CSF+<182.4 ng/l, CSF– >201.6 ng/l) and the global neocortical amyloid-β SUVR relative a composite reference region (PET+>0.8295, PET − <0.7505). ( B ) Amyloid-β accumulation rate in the global neocortical region using a PET classification (+/–) based on abnormal/normal amyloid-β in brain regions affected in early amyloid-β deposition (the medial and lateral orbitofrontal cortex and the frontal pole; ‘the early amyloid-β region’). Cut-offs were established with mixture modelling (PET+>0.8579 SUVR, PET– <0.7762 SUVR). The CSF classification was the same as in ( A ). ( C ) Amyloid-β accumulation rate in the ‘early amyloid-β region’ using the same CSF/PET classification as in ( B ). Aβ = amyloid-β.
Figure 3.

The annual rate of amyloid-β accumulation (%) as a function of CSF amyloid-β 42 levels in PET− and PET+ individuals. The local regression line was fitted using the partial least square criterion (‘LOESS’) and illustrates the increase in accumulation rate with decreasing amyloid-β 42 levels as seen in CSF+/PET+ subjects and at lower amyloid-β 42 levels in CSF−/PET− subjects ( A ). The gap between CSF−/PET− and CSF+/PET− is caused by the exclusion of borderline cases. In B , the local regression line shows an accumulation rate that has plateaued and does not increase with decreasing CSF amyloid-β 42 levels.
Longitudinal analysis of hippocampal atrophy and memory
There was a significant decline in composite memory score over time in CSF+/PET+ individuals, but not in CSF+/PET− or CSF−/PET− individuals ( Table 2 and Fig. 4 A). The change differed significantly between the CSF+/PET+ and CSF+/PET− groups ( P < 0.013 when adjusting for age, sex, and baseline memory score). There was no significant difference in the change of memory scores between the CSF+/PET− and CSF−/PET− groups (adjusted P = 0.53). The deterioration in hippocampal volume was greater for CSF+/PET+ compared with CSF+/PET − ( P < 0.001 adjusted for baseline hippocampal volume, sex and age) and there were no differences between CSF+/PET− and CSF−/PET− groups (adjusted P = 0.07; Table 2 and Fig. 4 B).
Figure 4.

Longitudinal changes in memory and hippocampal atrophy. ( A ) Illustration of the linear slopes in composite memory score for the three groups. The coefficients were calculated from scores at the ADNI baseline and the 12, 24, 36, 48 and 60-month visits. The CSF+/PET+ group deteriorated significantly in memory function, but no deterioration was seen in the other groups. The difference between CSF+/PET+ and the other groups was significant. ( B ) The coefficient of the hippocampal volume was calculated based on all available data at all ADNI visits. CSF+/PET+ progressed significantly more than the other groups. Supplementary Fig. 1A and B shows the individual trajectories of the composite memory score and the hippocampal volume.
PET classification based on abnormal uptake in the early amyloid-β region
Table 3 and Fig. 2 B and C show the results from the new classification using the previous CSF amyloid-β 42 cut-offs and the new PET cut-offs for normal/abnormal SUVR in the ‘early amyloid-β region’ (medial and lateral orbitofrontal cortex and the frontal pole). There was only one subject with CSF–/PET+ biomarkers, and it was thus excluded from the analyses. When analysing longitudinal changes both in the global neocortical SUVR and the ‘early amyloid-β region’ we found very similar group differences as in the previous analyses. The amyloid-β accumulation was significantly increased in the CSF+/PET– group compared with the CSF–/PET– group and no differences were found between the CSF+/PET– and CSF+/PET+ groups ( Table 3 and Fig. 2 B and C ).
Validation of the main results using other cut-offs for CSF amyloid-β 42 and global florbetapir PET
Three additional group classifications were also made to ensure that the main results were not caused by random classifications:
(i) When using a classification with the same CSF amyloid-β 42 cut-offs, but global PET cut-offs based on SUVR relative to the whole cerebellum instead of the composite region (±5% of 1.11 SUVR) ( Joshi et al. , 2012 ), the CSF+/PET− group still had a yearly florbetapir SUVR accumulation rate three times that of the CSF−/PET− group ( P = 0.04 adjusted for age, APOE genotype, sex and time between PET scans) and a similar rate as the CSF+/PET+ group (adjusted P = 0.32).
(ii) We also used unbiased cut-offs for both CSF and PET (SUVR relative the composite reference region) derived from mixture modelling analysis on the current population (see ‘Statistical analysis’ section). This resulted in a CSF amyloid-β 42 cut-off of 170.5 ng/l and a PET cut-off of 0.797 SUVR where a ± 5% interval was applied for the final cut-offs. This group classification resulted in a yearly amyloid-β accumulation for CSF+/PET− that was four times higher than CSF−/PET − (adjusted P < 0.001) and equal to CSF+/PET − (adjusted P = 0.32).
(iii) Finally, previously proposed cut-offs were used (CSF amyloid-β 42 + <192 ng/l; PET+ >0.79 SUVR relative the composite region) without a ± 5% interval (i.e. no exclusion of borderline cases). This classification also resulted in similar group differences regarding yearly amyloid-β accumulation (higher in CSF+/PET− compared with CSF−/PET−, adjusted P = 0.039 and no differences between CSF+/PET− and CSF+/PET+, adjusted P = 0.13). This last classification resulted in a small CSF−/PET+ group ( n = 6), which exhibited no overall increase in yearly SUVR rate (median 0.24%, range –2.3 to 3.9%).
Discussion
Using longitudinal PET data we tested the hypothesis that CSF analysis can detect abnormal amyloid-β accumulation prior to amyloid PET imaging. In accordance with our hypothesis, we found that subjects who were CSF amyloid-β 42 positive but PET amyloid-β negative at baseline (CSF+/PET−) accumulated amyloid-β at a similar rate as those who were positive for both modalities at baseline and more than three times as fast as those that were negative for both modalities. This discordant CSF positive group (CSF+/PET−) had no signs of neurodegeneration or cognitive decline. There were no subjects who were isolated PET amyloid-β positive (CSF–/PET+), which argues against amyloid PET becoming abnormal first. The results were robust using four different types of group classifications for CSF+/− and PET+/− and when classifying PET +/– based on amyloid-β deposition in regions that are affected in the initial phase of amyloid-β accumulation ( Braak and Braak, 1991 ; Goedert, 2015 ). Previous cross-sectional studies have put forth the same hypothesis based on higher prevalence of CSF+/PET− compared with PET+/CSF− cases ( Fagan et al. , 2009 ), the presence of CSF+/PET− in younger individuals ( Morris et al. , 2010 ) and the greater occurrence of CSF+/PET− in controls compared with subjects with MCI and Alzheimer’s disease dementia ( Mattsson et al. , 2014 ). To our knowledge, the present study is the first to show that people with abnormally low CSF amyloid-β 42 and normal amyloid PET accumulate amyloid-β at an abnormal rate. These longitudinal results indicate that the abnormal amyloid metabolism in Alzheimer’s disease can be detected by CSF biomarkers at a very early stage, before PET imaging becomes abnormal.
Pathological amyloid-β accumulation rates have also been calculated in previous studies ( Bateman et al. , 2012 ; Toledo et al. , 2013 ; Villemagne et al. , 2013 ). Using cross-sectional Pittsburgh compound B (PiB) PET data from subjects with autosomal dominant Alzheimer’s disease, Bateman et al. (2012 ) calculated the mean accumulation rate of cortical amyloid-β fibrils to 1.4%/year in the early phases 20–25 years prior to Alzheimer’s disease dementia and prior to neurodegeneration and cognitive decline. This accumulation rate is similar to what we found for the CSF+/PET− group (1.2% SUVR increase per year).
Individuals who are just starting to accumulate cortical amyloid-β fibrils would not be expected to show signs of tau pathology in CSF, neurodegeneration on MRI or cognitive decline according to the most acknowledged models of Alzheimer’s disease ( Braak et al. , 2013 ; Jack et al. , 2013 ; Sperling et al. , 2014 ). In accordance with this, we found that the CSF+/PET− group had similar baseline cognitive function, hippocampal volume, and tau levels as the CSF−/PET− group, but higher amyloid-β accumulation rate and higher prevalence of APOE ϵ4 carriers. The CSF+/PET− group also had similar longitudinal changes in hippocampal volume as the CSF−/PET− group and showed no deterioration in memory. This fits well with the assumption that CSF+/PET− subjects are at the beginning of an Alzheimer’s disease process without overt cognitive decline and hippocampal atrophy. However, it is possible that subtle changes in cognition and brain volume could have been detected with a more sensitive cognitive battery or a larger sample size. In contrast, CSF+/PET+ subjects had twice as high tau levels and deteriorated significantly more in hippocampal volume and memory ( Table 2 and Fig. 4 A and B ), indicating that they are closer to Alzheimer’s disease dementia. Another difference was that the CSF+/PET− group had slightly higher CSF amyloid-β 42 levels than the CSF+/PET+ group ( Table 1 ). As shown by the local regression line in Fig. 3 A, the rate of amyloid-β accumulation appears to start to increase in CSF−/PET− cases at CSF amyloid-β 42 levels around 220 ng/l and continues to increase at lower CSF amyloid-β 42 levels in the CSF+/PET− group. This relationship was not seen in CSF+/PET+ subjects ( Fig. 3 B). We cannot rule out that this stagnation of amyloid-β accumulation rate in CSF+/PET+ subjects to some extent is caused by an increased atrophy rate in this group, since PET volumes of interest are based on baseline MRI scans in ADNI ( Landau et al. , 2015 ). However, there was no significant negative correlation between global amyloid-β accumulation rate and change in cortical thickness, which would be the case if the accumulation rate was largely explained by an increased rate of atrophy. Further, there were no differences between the CSF/PET groups in terms of baseline cortical thickness of this composite region of interest, indicating that any partial volume effects due to atrophy were similar between the groups ( Table 1 ). Our interpretation of Fig. 3 is therefore that CSF amyloid-β 42 might continue to drop and the amyloid-β accumulation rate continue to increase in many of the CSF+/PET− individuals before a plateau is seen for both the level of CSF amyloid-β 42 and the yearly rate of change in florbetapir SUVR, corresponding to the findings in the CSF+/PET+ group. This assumption fits well with a previous publication showing that healthy elderly with normal CSF amyloid-β 42 (>192 ng/l) but with values below 225 ng/l are at increased risk to develop abnormal CSF amyloid-β 42 levels if followed longitudinally for 3 years ( Mattsson et al. , 2015b ). The CSF amyloid-β 42 levels associated with increased amyloid-β accumulation rate in the present study also coincide with a range of CSF amyloid-β 42 levels associated with increased atrophy rates in Alzheimer’s disease-related brain regions ( Insel et al. , 2015 ). The lack of progression of cognitive impairment in CSF+/PET− and CSF−/PET− indicates that the MCI classification of some of these subjects is probably not related to Alzheimer’s disease but could represent benign conditions or misclassification of the MCI diagnosis. The amyloid-β pathology identified by CSF in these subjects thereby likely represents preclinical Alzheimer’s disease.
CSF amyloid-β 42 and amyloid PET measures partly different aspects of amyloid-β pathology, which explains the possibility of individuals being CSF+/PET− despite the high overall agreement between the methods. Previous cross-sectional studies have proposed that the amyloid-β process starts with the formation of non-fibrillar amyloid-β species that results in lowered CSF amyloid-β 42 but are non-detectable with amyloid PET ( Fagan et al. , 2009 ; Morris et al. , 2010 ). These amyloid-β species later become fibrillar (neuritic plaques) and are consequently detectable with amyloid PET ( Mathis et al. , 2012 ). This idea was supported by an autopsy study where a case that was CSF+/PET− had numerous diffuse neocortical amyloid-β plaques but only sparse neuritic plaques ( Cairns et al. , 2009 ). A CSF+/PET− status is also present in a rare variant of familial Alzheimer’s disease (the Arctic APP mutation), which only develops diffuse, not neuritic, plaques ( Scholl et al. , 2012 ). These studies thus provide a rationale for CSF becoming abnormal before PET in preclinical Alzheimer’s disease.
As a limitation of the study, we acknowledge that the sample size of the CSF+/PET− group was relatively small ( n = 26) and the results need to be replicated in a larger cohort. To our knowledge there is currently no larger cohort available with the repeated measurements needed for this analysis. Using one of the alternative classification systems (without excluding borderline cases) the CSF+/PET− group contained 48 subjects and the results were robust. One previous article has examined longitudinal florbetapir PET in relation to baseline CSF amyloid-β 42 in subjects from the ADNI study ( Toledo et al. , 2015 ). That study did not report increased rates of florbetapir PET accumulation in CSF+/PET− subjects, but there are several important differences between that study and the present study. Toledo et al. (2015 ) included data from already demented patients and used an older dataset with shorter follow-up times and fewer subjects than what was available for our study (they examined 150–304 subjects depending on type of analysis including demented patients compared with 353–437 non-demented subjects in the present study). This likely increased our power to detect early effects of CSF amyloid-β 42 on longitudinal florbetapir PET. We also included analyses of PET+/– classifications based on regional amyloid-β deposition in the brain areas where the amyloid-β accumulation is believed to start ( Braak and Braak, 1991 ; Goedert, 2015 ). With this alternative PET classification the CSF+/PET– group still accumulated both regional and global amyloid-β faster than CSF–/PET– and at a similar rate as CSF+/PET+ ( Table 3 and Fig. 2 B and C ). Nevertheless, a longer follow-up using repeated MRI, amyloid PET, cognitive tests and CSF samples is needed to verify that CSF+/PET− individuals indeed have preclinical Alzheimer’s disease and later become PET+ and develop signs of neurodegeneration and cognitive dysfunction. Especially, a longer follow-up with repeated PET scans is important given the test-retest reliability of florbetapir ( Joshi et al. , 2012 ) and that the mean time between scans only was 2.1 years.
In summary, we found evidence indicating that CSF amyloid-β 42 can detect amyloid-β pathology earlier than amyloid PET. A discordant profile with isolated CSF positivity could be the first measureable sign of amyloid pathology in preclinical Alzheimer’s disease. Consequently, a CSF+/PET− status may indicate a suitable stage for starting disease-modifying treatment targeting amyloid-β pathology ( Hardy et al. , 2014 ) or interventions of modifiable risk factors ( Ngandu et al. , 2015 ). However, we find it likely that only a subpopulation of CSF+/PET– individuals would benefit from therapeutic interventions since it is not clear if cognitive decline is an inevitable result of abnormal amyloid-β accumulation and even if it is, the time between the initial pathology and cognitive impairment can be more than one to two decades ( Sperling et al. , 2014 ). Therefore, further studies are needed to better determine other factors that can timely predict future cognitive impairment at this very early stage of amyloid-β accumulation.
Supplementary Material
Acknowledgements
The authors would like to thank Michael Schöll, PhD (Gothenburg University and Lund University), Martin Schain, PhD (Columbia University) and Olof Lindberg, PhD (Karolinska Institutet) for advice on analyses regarding the relationship between cortical atrophy rates and amyloid-β accumulation rates.
Glossary
Abbreviations
- MCI =
mild cognitive impairment
- SUVR =
standardized uptake value ratio
Funding
Work at the authors’ research centre was supported by the Strategic Research Area MultiPark (Multidisciplinary Research in Parkinson’s disease) at Lund University, the European Research Council, the Swedish Research Council, the Crafoord Foundation, the Swedish Brain Foundation, the Skåne University Hospital Foundation, the Swedish Alzheimer Association, and the Swedish federal government under the ALF agreement. The ADNI data collection and sharing for this project was funded by the Alzheimer's Disease Neuroimaging Initiative (ADNI) (National Institutes of Health Grant U01 AG024904) and DOD ADNI (Department of Defense award number W81XWH-12-2-0012). ADNI is funded by the National Institute on Aging, the National Institute of Biomedical Imaging and Bioengineering, and through generous contributions from the following: Alzheimer’s Association; Alzheimer’s Drug Discovery Foundation; Araclon Biotech; BioClinica, Inc.; Biogen Idec Inc.; Bristol-Myers Squibb Company; Eisai Inc.; Elan Pharmaceuticals, Inc.; Eli Lilly and Company; EuroImmun; F. Hoffmann-La Roche Ltd and its affiliated company Genentech, Inc.; Fujirebio; GE Healthcare; IXICO Ltd.; Janssen Alzheimer Immunotherapy Research & Development, LLC.; Johnson & Johnson Pharmaceutical Research & Development LLC.; Medpace, Inc.; Merck & Co., Inc.; Meso Scale Diagnostics, LLC.; NeuroRx Research; Neurotrack Technologies; Novartis Pharmaceuticals Corporation; Pfizer Inc.; Piramal Imaging; Servier; Synarc Inc.; and Takeda Pharmaceutical Company. The Canadian Institutes of Health Research is providing funds to support ADNI clinical sites in Canada. Private sector contributions are facilitated by the Foundation for the National Institutes of Health ( www.fnih.org ). The grantee organization is the Northern California Institute for Research and Education, and the study is coordinated by the Alzheimer's Disease Cooperative Study at the University of California, San Diego. ADNI data are disseminated by the Laboratory for Neuro Imaging at the University of Southern California.
Supplementary material
Supplementary material is available at Brain online.
References
- Albert MS, DeKosky ST, Dickson D, Dubois B, Feldman HH, Fox NC , et al. . The diagnosis of mild cognitive impairment due to Alzheimer's disease: recommendations from the National Institute on Aging-Alzheimer's Association workgroups on diagnostic guidelines for Alzheimer's disease . Alzheimers Dement 2011. ; 7 : 270 – 9 . [DOI] [PMC free article] [PubMed] [Google Scholar]
- Bateman RJ, Xiong C, Benzinger TL, Fagan AM, Goate A, Fox NC , et al. . Clinical and biomarker changes in dominantly inherited Alzheimer's disease . N Engl J Med 2012. ; 367 : 795 – 804 . [DOI] [PMC free article] [PubMed] [Google Scholar]
- Benaglia T, Chauveau D, Hunter DR, Young D . mixtools: an R package for analyzing finite mixture models . J Stat Softw 2009. ; 32 : 1 – 29 . [Google Scholar]
- Biogen . A Randomized, Blinded, Placebo-Controlled Single Ascending Dose Study of the Safety, Tolerability, and Pharmacokinetics of BIIB037 in Subjects with Mild to Moderate Alzheimer's Disease. In: AD/PD International Conference, Nice, France, 2015. .
- Braak H, Braak E . Neuropathological stageing of Alzheimer-related changes . Acta Neuropathol 1991. ; 82 : 239 – 59 . [DOI] [PubMed] [Google Scholar]
- Braak H, Zetterberg H, Del Tredici K, Blennow K . Intraneuronal tau aggregation precedes diffuse plaque deposition, but amyloid-beta changes occur before increases of tau in cerebrospinal fluid . Acta Neuropathol 2013. ; 126 : 631 – 41 . [DOI] [PubMed] [Google Scholar]
- Cairns NJ, Ikonomovic MD, Benzinger T, Storandt M, Fagan AM, Shah AR , et al. . Absence of Pittsburgh compound B detection of cerebral amyloid beta in a patient with clinical, cognitive, and cerebrospinal fluid markers of Alzheimer disease: a case report . Arch Neurol 2009. ; 66 : 1557 – 62 . [DOI] [PMC free article] [PubMed] [Google Scholar]
- Crane PK, Carle A, Gibbons LE, Insel P, Mackin RS, Gross A , et al. . Development and assessment of a composite score for memory in the Alzheimer's Disease Neuroimaging Initiative (ADNI) . Brain Imaging Behav 2012. ; 6 : 502 – 16 . [DOI] [PMC free article] [PubMed] [Google Scholar]
- De Meyer G, Shapiro F, Vanderstichele H, Vanmechelen E, Engelborghs S, De Deyn PP , et al. . Diagnosis-independent Alzheimer disease biomarker signature in cognitively normal elderly people . Arch Neurol 2010. ; 67 : 949 – 56 . [DOI] [PMC free article] [PubMed] [Google Scholar]
- Fagan AM, Mintun MA, Mach RH, Lee SY, Dence CS, Shah AR , et al. . Inverse relation between in vivo amyloid imaging load and cerebrospinal fluid Abeta42 in humans . Ann Neurol 2006. ; 59 : 512 – 19 . [DOI] [PubMed] [Google Scholar]
- Fagan AM, Mintun MA, Shah AR, Aldea P, Roe CM, Mach RH , et al. . Cerebrospinal fluid tau and ptau(181) increase with cortical amyloid deposition in cognitively normal individuals: implications for future clinical trials of Alzheimer's disease . EMBO Mol Med 2009. ; 1 : 371 – 80 . [DOI] [PMC free article] [PubMed] [Google Scholar]
- Folstein MF, Folstein SE, McHugh PR . “Mini-mental state”. A practical method for grading the cognitive state of patients for the clinician . J Psychiatr Res 1975. ; 12 : 189 – 98 . [DOI] [PubMed] [Google Scholar]
- Goedert M . NEURODEGENERATION. Alzheimer's and Parkinson's diseases: the prion concept in relation to assembled Abeta, tau, and alpha-synuclein . Science 2015. ; 349 : 1255555. [DOI] [PubMed] [Google Scholar]
- Grimmer T, Riemenschneider M, Forstl H, Henriksen G, Klunk WE, Mathis CA , et al. . Beta amyloid in Alzheimer's disease: increased deposition in brain is reflected in reduced concentration in cerebrospinal fluid . Biol Psychiatry 2009. ; 65 : 927 – 34 . [DOI] [PMC free article] [PubMed] [Google Scholar]
- Hardy J, Bogdanovic N, Winblad B, Portelius E, Andreasen N, Cedazo-Minguez A , et al. . Pathways to Alzheimer's disease . J Intern Med 2014. ; 275 : 296 – 303 . [DOI] [PubMed] [Google Scholar]
- Insel PS, Mattsson N, Donohue MC, Mackin RS, Aisen PS, Jack CR, Jr , et al. . The transitional association between beta-amyloid pathology and regional brain atrophy . Alzheimers Dement 2015. ; 11 : 1171 – 9 . [DOI] [PMC free article] [PubMed] [Google Scholar]
- Jack CR, Jr, Bernstein MA, Fox NC, Thompson P, Alexander G, Harvey D , et al. . The Alzheimer's Disease Neuroimaging Initiative (ADNI): MRI methods . J Magn Reson Imaging 2008. ; 27 : 685 – 91 . [DOI] [PMC free article] [PubMed] [Google Scholar]
- Jack CR, Jr, Knopman DS, Jagust WJ, Petersen RC, Weiner MW, Aisen PS , et al. . Tracking pathophysiological processes in Alzheimer's disease: an updated hypothetical model of dynamic biomarkers . Lancet Neurol 2013. ; 12 : 207 – 16 . [DOI] [PMC free article] [PubMed] [Google Scholar]
- Jack CR, Jr, Knopman DS, Jagust WJ, Shaw LM, Aisen PS, Weiner MW , et al. . Hypothetical model of dynamic biomarkers of the Alzheimer's pathological cascade . Lancet Neurol 2010. ; 9 : 119 – 28 . [DOI] [PMC free article] [PubMed] [Google Scholar]
- Jacoby W . Loess: a nonparametric, graphical tool for depicting relationships between variables . Electoral Studies 2000. ; 19 : 577 – 613 . [Google Scholar]
- Jagust WJ, Landau SM, Shaw LM, Trojanowski JQ, Koeppe RA, Reiman EM , et al. . Relationships between biomarkers in aging and dementia . Neurology 2009. ; 73 : 1193 – 9 . [DOI] [PMC free article] [PubMed] [Google Scholar]
- Joshi AD, Pontecorvo MJ, Clark CM, Carpenter AP, Jennings DL, Sadowsky CH , et al. . Performance characteristics of amyloid PET with florbetapir F 18 in patients with alzheimer's disease and cognitively normal subjects . J Nucl Med 2012. ; 53 : 378 – 84 . [DOI] [PubMed] [Google Scholar]
- Landau S, Jagust W . Florbetapir processing methods. http://ida.loni.usc.edu Helen Wills Neuroscience Institute, UC Berkeley and Lawrence Berkeley National Laboratory California; 2015. .
- Landau SM, Baker SL, Jagust WJ . Amyloid change early in disease is related to increased glucose metabolism and episodic memory decline. In: Human Amyloid Imaging Meeting, Miami, FL; 2014. .
- Landau SM, Fero A, Baker SL, Koeppe R, Mintun M, Chen K , et al. . Measurement of longitudinal beta-amyloid change with 18F-florbetapir PET and standardized uptake value ratios . J Nucl Med 2015. ; 56 : 567 – 74 . [DOI] [PMC free article] [PubMed] [Google Scholar]
- Landau SM, Lu M, Joshi AD, Pontecorvo M, Mintun MA, Trojanowski JQ , et al. . Comparing positron emission tomography imaging and cerebrospinal fluid measurements of β-amyloid . Ann Neurol 2013. ; 74 : 826 – 36 . [DOI] [PMC free article] [PubMed] [Google Scholar]
- Landau SM, Mintun MA, Joshi AD, Koeppe RA, Petersen RC, Aisen PS , et al. . Amyloid deposition, hypometabolism, and longitudinal cognitive decline . Ann Neurol 2012. ; 72 : 578 – 86 . [DOI] [PMC free article] [PubMed] [Google Scholar]
- Mathis CA, Mason NS, Lopresti BJ, Klunk WE . Development of positron emission tomography beta-amyloid plaque imaging agents . Semin Nucl Med 2012. ; 42 : 423 – 32 . [DOI] [PMC free article] [PubMed] [Google Scholar]
- Mattsson N, Insel P, Donohue M, Landau S, Jagust W, Shaw L , et al. . Independent information from cerebrospinal fluid β-amyloid and florbetapir imaging in Alzheimer’s disease . Brain 2015a. ; 138 (Pt 3) : 772 – 83 . [DOI] [PMC free article] [PubMed] [Google Scholar]
- Mattsson N, Insel P, Landau S, Jagust W, Donohue MC, Shaw LM , et al. . Diagnostic accuracy of CSF Ab42 and florbetapir PET for Alzheimer’s disease . Ann Clin Transl Neurol 2014. ; 1 : 534 – 43 . [DOI] [PMC free article] [PubMed] [Google Scholar]
- Mattsson N, Insel PS, Donohue M, Jagust W, Sperling R, Aisen P , et al. . Predicting reduction of cerebrospinal fluid beta-amyloid 42 in cognitively healthy controls . JAMA Neurol 2015b. ; 72 : 554 – 60 . [DOI] [PubMed] [Google Scholar]
- Morris JC . The Clinical Dementia Rating (CDR): current version and scoring rules . Neurology 1993. ; 43 : 2412 – 14 . [DOI] [PubMed] [Google Scholar]
- Morris JC, Roe CM, Xiong C, Fagan AM, Goate AM, Holtzman DM , et al. . APOE predicts amyloid-beta but not tau Alzheimer pathology in cognitively normal aging . Ann Neurol 2010. ; 67 : 122 – 31 . [DOI] [PMC free article] [PubMed] [Google Scholar]
- Ngandu T, Lehtisalo J, Solomon A, Levalahti E, Ahtiluoto S, Antikainen R , et al. . A 2 year multidomain intervention of diet, exercise, cognitive training, and vascular risk monitoring versus control to prevent cognitive decline in at-risk elderly people (FINGER): a randomised controlled trial . Lancet 2015. ; 385 : 2255 – 63 . [DOI] [PubMed] [Google Scholar]
- Olsson A, Vanderstichele H, Andreasen N, De Meyer G, Wallin A, Holmberg B , et al. . Simultaneous measurement of beta-amyloid(1-42), total tau, and phosphorylated tau (Thr181) in cerebrospinal fluid by the xMAP technology . Clin Chem 2005. ; 51 : 336 – 45 . [DOI] [PubMed] [Google Scholar]
- Palmqvist S, Zetterberg H, Blennow K, Vestberg S, Andreasson U, Brooks DJ , et al. . Accuracy of brain amyloid detection in clinical practice using cerebrospinal fluid beta-amyloid 42: a cross-validation study against amyloid positron emission tomography . JAMA Neurol 2014. ; 71 : 1282 – 9 . [DOI] [PubMed] [Google Scholar]
- Palmqvist S, Zetterberg H, Mattsson N, Johansson P, Minthon L, Blennow K ; Alzheimer's Disease Neuroimaging Initiative , et al. . Detailed comparison of amyloid PET and CSF biomarkers for identifying early Alzheimer's disease . Neurology 2015. ; 85 : 1240 – 9 . [DOI] [PMC free article] [PubMed] [Google Scholar]
- Pfister R, Schwarz K, Carson R, Jancyzk M . Easy methods for extracting individual regression slopes: comparing SPSS, R, and Excel . Tutor. Quant. Methods Psychol . 2013. ; 9 : 72 – 8 . [Google Scholar]
- Pietrzak RH, Lim YY, Ames D, Harrington K, Restrepo C, Martins RN , et al. . Trajectories of memory decline in preclinical Alzheimer's disease: results from the Australian Imaging, Biomarkers and Lifestyle Flagship Study of Ageing . Neurobiol Aging 2015. ; 36 : 1231 – 8 . [DOI] [PubMed] [Google Scholar]
- Scholl M, Wall A, Thordardottir S, Ferreira D, Bogdanovic N, Langstrom B , et al. . Low PiB PET retention in presence of pathologic CSF biomarkers in Arctic APP mutation carriers . Neurology 2012. ; 79 : 229 – 36 . [DOI] [PubMed] [Google Scholar]
- Sepulcre J, Sabuncu MR, Becker A, Sperling R, Johnson KA . In vivo characterization of the early states of the amyloid-beta network . Brain 2013. ; 136 (Pt 7) : 2239 – 52 . [DOI] [PMC free article] [PubMed] [Google Scholar]
- Shaw LM, Vanderstichele H, Knapik-Czajka M, Clark CM, Aisen PS, Petersen RC , et al. . Cerebrospinal fluid biomarker signature in Alzheimer's disease neuroimaging initiative subjects . Ann Neurol 2009. ; 65 : 403 – 13 . [DOI] [PMC free article] [PubMed] [Google Scholar]
- Sperling R, Mormino E, Johnson K . The evolution of preclinical Alzheimer's disease: implications for prevention trials . Neuron 2014. ; 84 : 608 – 22 . [DOI] [PMC free article] [PubMed] [Google Scholar]
- Sperling RA, Aisen PS, Beckett LA, Bennett DA, Craft S, Fagan AM , et al. . Toward defining the preclinical stages of Alzheimer's disease: recommendations from the National Institute on Aging-Alzheimer's Association workgroups on diagnostic guidelines for Alzheimer's disease . Alzheimers Dement 2011. ; 7 : 280 – 92 . [DOI] [PMC free article] [PubMed] [Google Scholar]
- Sperling RA, Jack CR, Jr, Aisen PS . Testing the right target and right drug at the right stage . Sci Transl Med 2011. ; 3 : 111cm33. [DOI] [PMC free article] [PubMed] [Google Scholar]
- Sperling RA, Rentz DM, Johnson KA, Karlawish J, Donohue M, Salmon DP , et al. . The A4 study: stopping AD before symptoms begin? Sci Transl Med 2014. ; 6 : 228fs13. [DOI] [PMC free article] [PubMed] [Google Scholar]
- Tolboom N, van der Flier WM, Yaqub M, Boellaard R, Verwey NA, Blankenstein MA , et al. . Relationship of cerebrospinal fluid markers to 11C-PiB and 18F-FDDNP binding . J Nucl Med 2009. ; 50 : 1464 – 70 . [DOI] [PubMed] [Google Scholar]
- Toledo JB, Bjerke M, Da X, Landau SM, Foster NL, Jagust W , et al. . Nonlinear association between cerebrospinal fluid and Florbetapir F-18 beta-amyloid measures across the spectrum of Alzheimer disease . JAMA Neurol 2015. ; 72 : 571 – 81 . [DOI] [PMC free article] [PubMed] [Google Scholar]
- Toledo JB, Xie SX, Trojanowski JQ, Shaw LM . Longitudinal change in CSF Tau and Abeta biomarkers for up to 48 months in ADNI . Acta Neuropathol 2013. ; 126 : 659 – 70 . [DOI] [PMC free article] [PubMed] [Google Scholar]
- Villemagne VL, Burnham S, Bourgeat P, Brown B, Ellis KA, Salvado O , et al. . Amyloid beta deposition, neurodegeneration, and cognitive decline in sporadic Alzheimer's disease: a prospective cohort study . Lancet Neurol 2013. ; 12 : 357 – 67 . [DOI] [PubMed] [Google Scholar]
- Villeneuve S, Rabinovici GD, Cohn-Sheehy BI, Madison C, Ayakta N, Ghosh PM , et al. . Existing Pittsburgh Compound-B positron emission tomography thresholds are too high: statistical and pathological evaluation . Brain 2015. ; 138 (Pt 7) : 2020 – 33 . [DOI] [PMC free article] [PubMed] [Google Scholar]
- Villain N, Chetelat G, Grassiot B, Bourgeat P, Jones G, Ellis KA , et al. . Regional dynamics of amyloid-beta deposition in healthy elderly, mild cognitive impairment and Alzheimer's disease: a voxelwise PiB-PET longitudinal study . Brain 2012. ; 135 (Pt 7) : 2126 – 39 . [DOI] [PubMed] [Google Scholar]
- Vos SJ, Xiong C, Visser PJ, Jasielec MS, Hassenstab J, Grant EA , et al. . Preclinical Alzheimer's disease and its outcome: a longitudinal cohort study . Lancet Neurol 2013. ; 12 : 957 – 65 . [DOI] [PMC free article] [PubMed] [Google Scholar]
- Weigand SD, Vemuri P, Wiste HJ, Senjem ML, Pankratz VS, Aisen PS , et al. . Transforming cerebrospinal fluid Abeta42 measures into calculated Pittsburgh Compound B units of brain Abeta amyloid . Alzheimers Dement 2011. ; 7 : 133 – 41 . [DOI] [PMC free article] [PubMed] [Google Scholar]
Associated Data
This section collects any data citations, data availability statements, or supplementary materials included in this article.