

Abstract
Atlas-based automated anatomical labeling is a fundamental tool in medical image segmentation, as it defines regions of interest for subsequent analysis of structural and functional image data. The extensive investigation of multi-atlas warping and fusion techniques over the past 5 or more years has clearly demonstrated the advantages of consensus-based segmentation. However, the common approach is to use multiple atlases with a single registration method and parameter set, which is not necessarily optimal for every individual scan, anatomical region, and problem/data-type. Different registration criteria and parameter sets yield different solutions, each providing complementary information. Herein, we present a consensus labeling framework that generates a broad ensemble of labeled atlases in target image space via the use of several warping algorithms, regularization parameters, and atlases. The label fusion integrates two complementary sources of information: a local similarity ranking to select locally optimal atlases and a boundary modulation term to refine the segmentation consistently with the target image's intensity profile. The ensemble approach consistently outperforms segmentations using individual warping methods alone, achieving high accuracy on several benchmark datasets. The MUSE methodology has been used for processing thousands of scans from various datasets, producing robust and consistent results. MUSE is publicly available both as a downloadable software package, and as an application that can be run on the CBICA Image Processing Portal (https://ipp.cbica.upenn.edu), a web based platform for remote processing of medical images.
Keywords: MRI, multi-atlas segmentation, registration, label fusion, ROI
1. Introduction
Automated segmentation of anatomical structures, i.e. delineation of regions of interest (ROIs), on MR images is an extremely important task for quantitative analysis of structural and functional brain changes, particularly in studies with large datasets (Good et al., 2002; Poldrack, 2007). The rapidly increasing amount of imaging data creates an urgent need for accurate and consistent phenotyping of brain structures in tens of thousands of images acquired from multiple institutions, and of subjects in various age groups (Medland et al., 2014; Hibar et al., 2015). During the past 5 years, multi-atlas segmentation (MAS) has increasingly gained attention as a potential solution to this problem (Iglesias and Sabuncu, 2015). The main principle of MAS is to use a priori knowledge, provided by ensembles of segmented atlases, i.e. images with manually or semi-automatically created reference segmentation labels, to infer segmentation in a target image via multiple atlas-to-target image registrations. After being warped individually to the target image, multiple atlases provide various representations of the anatomy and correct each other's errors in a process known as label fusion. MAS has shown remarkable improvement over single-atlas-based segmentation, and has now been considered as the standard framework for segmentation of biomedical images. A multitude of algorithms have been proposed in recent years to improve various facets of the MAS framework, with particular emphasis on atlas selection and robust and accurate fusion of the warped atlas labels (Aljabar et al., 2009; Lötjönen et al., 2010; Sabuncu et al., 2010; Landman et al., 2011; Leung et al., 2011; Asman and Landman, 2013; Cardoso et al., 2013; Zikic et al., 2014; Wu et al., 2015).
With the exception of patch-based approaches that use affine registration to align atlas images (Coupé et al., 2011; Konukoglu et al., 2013), deformable image registration (Sotiras et al., 2013) is a core component of all MAS methods, and the quality of individual registrations has a very high impact on the accuracy of the final segmentation. However, anatomical correspondence may not be uniquely determined from intensity-based image attributes, which drive deformable registration algorithms. Furthermore, exact anatomical correspondence may not exist at all due to anatomical variability across subjects. Anatomies closer to an atlas are well represented by a diffeomorphism. However, large differences between an individual and the atlas lead to residual information that the transformation does not capture. Techniques such as atlas selection from a larger atlas dataset (Aljabar et al., 2009; Wu et al., 2007; Gousias et al., 2010; Hoang Duc et al., 2013; Sanroma et al., 2014), or local similarity based weighting in label fusion (Artaechevarria et al., 2009; Isgum et al., 2009; Khan et al., 2011; Wang et al., 2012) were proposed to address these challenges, by selecting, either locally or globally, warps most similar to the target image. However, not only the choice of the atlas, but also the warping algorithm and the parameters of the algorithm, particularly regularization, play an important role in the accuracy of the registration. Comparative evaluations on multiple datasets have shown that registration algorithms differed greatly in performance, when facing diverse databases or challenges, globally as well as in individual regions of the brain (Ou et al., 2014). Figure 1 shows an illustrative example of such differences in registration accuracy for two registration algorithms that have reported high accuracies.
Figure 1.

Illustration of differences resulting from the application of two different registration algorithms; a) The target image, b) warped image obtained using DRAMMS, c) warped image obtained using ANTS. The red circles point to areas where one of the methods is locally more accurate than the other method (DRAMMS on the top, and ANTS in the bottom).
The importance of variability in algorithm performance is often neglected in current MAS methods, where the general practice is to select a single warping algorithm and to use it with a single set of registration parameters. There have been few methods that specifically investigated the effect of registration algorithms and parameters on multi-atlas segmentation. In Bai et al. (2012), the authors investigated the roles of image registration and segmentation model complexity for mouse brain segmentation using 4 different registration algorithms, and concluded that image registration plays a more crucial role in segmentation compared to the complexity of the segmentation model. Interestingly, in early days of atlas based segmentation, work reported in Rohlfing and Maurer (2005) investigated the effects of various atlases and parameterizations of the registration algorithm, casting the segmentation problem as a “multi-classifier” framework. This analysis was limited to a comparison between single atlas with 3 parameters and 3 atlases with a single parameter, using a free-form deformation algorithm with simple label fusion, and was validated on 7 subjects only. Despite this limitation, the authors observed that in all cases classifier combinations consistently improved classification accuracy, and that improvements in accuracy were possible with various parameterizations of the non-rigid registration technique, even using a single atlas.
In this paper, we propose a new method, MUlti-atlas region Segmentation utilizing Ensembles (MUSE), a generalization of the MAS framework to include a broad representation of a given anatomy that reflects variations due to the choice of the atlas, as well as the warping method and warping parameters. In this way, we obtain a large ensemble of tentative label maps that are generated by applying a multitude of transformations on multiple atlases, and we use the ensemble for deriving final labels for each voxel. The general concept of generating a larger ensemble of label maps was explored in a few recent papers: in Wang et al. (2013) multiple warps from the same atlas were generated by composing inter-atlas registrations and atlas-target registrations; in Pipitone et al. (2014) segmentations from a small number of atlases were propagated to a subset of target images and the new atlases were used for segmenting all target images. However, these methods used a different approach than ours, by following an “atlas propagation” strategy.
MUSE utilizes a spatially adaptive strategy for the label fusion. A local similarity ranking score is calculated and used for selecting warped atlases that are locally most similar to the target image. For similarity calculation, we define a rich attribute descriptor as in Ou et al. (2011) that renders each voxel more distinctive than intensity information alone. The local similarity ranking is particularly essential for the ensemble approach: the ensemble construction covers a range of deformation parameter values (as well as atlases and algorithms). This may result in a high variation within the ensemble, which is desirable to be able to better capture the target anatomy. However this also necessitates a reliable selection of best warps in order to guarantee that suboptimal or failed registrations don't affect the decision in final label assignment. The label fusion also incorporates an intensity term that modulates the segmentations in the boundaries of the ROIs. The main purpose of the intensity term is to make the final segmentation consistent with the intensity profile of the target image.
In the current paper, we validated our method using several public benchmark datasets with expert defined reference labels, and we confirmed that the ensemble approach consistently outperforms segmentations obtained using individual warping methods/parameters alone. Also, in an independent comparative evaluation done as part of the “MICCAI 2013 Challenge Workshop on Segmentation” MUSE obtained the highest average Dice score (d = 0.8686) in the mid-brain segmentation category, and it maintains the first rank as of 11/02/20153. As an attempt towards the ambitious goal of quantitative anatomical phenotyping of the human brain using big data, we applied MUSE on thousands of images from several large-scale neuroimaging studies, and showed the robustness of our method and consistency of segmentations for datasets with significant differences in scanner characteristics and sample demographics, by accurately estimating brain age from segmented ROIs. Finally, we performed experiments that investigated the contribution of various ensemble combinations, and individual components of our method, to the final segmentation accuracy.
Our method is publicly available and can be downloaded from our web page4. Alternatively the MUSE software can be run remotely on the CBICA Image Processing Portal5, a new web platform that allows users to upload their data and run software developed in our lab. The web client version of MUSE will also include a new multi-study atlas dataset with a very large sample size, and a wide range of age and scanner characteristics. This atlas dataset was constructed by automatically selecting a subset of the most representative subjects from several datasets that include scans of healthy individuals. The ROI labels for atlas images were automatically created using MUSE and were carefully controlled for quality using automated and manual verification procedures. We believe that the software package and the new atlas dataset with large sample size will be valuable resources for the community.
2. Methods
MUSE generates a large ensemble of candidate labels in the target image space using multiple atlases, registration algorithms and smoothness values for these algorithms. The ensemble is then fused into a final segmentation. An illustration of the MUSE algorithm is given in figure 2. Individual components of MUSE are explained in detail in the following subsections.
Figure 2.

A schematic illustration of the MUSE algorithm.
2.1. Construction of the ensemble of warps
Given the target image S to be segmented, and n atlas images with the corresponding reference label maps each having l ROI labels, including the background, the aim of our method is to segment S by assigning an ROI label to each voxel in the image. Inspired by the manifold representation that was introduced in Baloch and Davatzikos (2008), we define the anatomic equivalence class of S as a set of all possible ways of representing the morphology of that individual via a transformation of an atlas and a respective residual, obtained by varying transformation parameters, i.e.
| (1) |
where h : ΩS → ΩT, x → h(x) is a transformation that maps the subject space ΩS to atlas space ΩT, Rhθ is the residual of the transformation, and θ is the parameter vector, which herein combines three important parameters for variations of h : hτ,μ,λ, the atlas, the deformation method, and the amount of regularization. Varying Θ = {θ1, …, θk} effectively allows every individual representation to slide along its own manifold, thereby leading to multiple ways of representing each individual as an ensemble . By applying each transformation hθi, i = {1 … k} on the corresponding atlas image and label map we obtain an ensemble of k atlas images and label maps registered to subject space, which we denote here as and .
2.2. Spatially Varying Similarity Weighting
We calculate a local similarity score at each voxel of S against each warp , such that a higher score is given to warps that are locally more similar to the target image. For the local similarity calculation, we define a rich attribute descriptor as in Ou et al. (2011). A voxel x is described by a d-dimensional attribute vector A(x), which encodes the geometric context of this voxel. For computing A(x) an image is convolved with a set of Gabor filter banks, which capture the texture information at multiple scales and orientation, and the responses of these filters at voxel x are concatenated into a vector. The local similarity between two voxels x and y is then defined as
| (2) |
After the similarity between the target image and each warp at each voxel x ∈ ΩS is calculated, local similarity scores are ranked to assign a rank s(x, i), with a higher rank representing higher morphological similarity between S and the warp at voxel x. The calculated spatially varying rank score s(x, i) is assigned to the selected transformations as a weight for subsequent label fusion.
2.3. Boundary Modulation
The intensity based boundary modulation term indicates the probability of the observed intensity at a voxel x to belong to the tissue intensity distribution of the specific ROI. Intuitively, the main objective of the boundary modulation term is to refine the ROI boundaries by penalizing large variations in the intensity distribution within an ROI. It's important to note that in contrast to methods where the intensity model is estimated from the atlas images for which the segmentation labels are known, we estimate the intensity distribution of ROIs from the target image, similar to Wolz et al. (2009). Such estimation is more robust to global and local intensity variations between the atlases and the target image. The intensity distribution of each ROI is modeled as a normal distribution with the assumption that the ROIs belong to a single tissue type with a smooth intensity variation. As the ROI segmentation on the target image is not known, the parameters of the distribution are estimated from a consensus segmentation, using intensities of voxels for which 90% of the warps agree on the segmentation label. An ROI membership score b1(x, p) is calculated for each voxel x ∊ ΩS and each ROI p ∊ {1, …, l}.
In addition to the ROI membership function, we also calculate a segmentation based term in order to achieve more accurate delineation of the brain boundary. We assign to each ROI in the reference dataset a tissue type categorizing it as “brain”, if the ROI is on the gray matter (GM) or the white matter (WM), or “non-brain”, if the ROI is on the cerebrospinal fluid (CSF) or the background. The new term, b2(x, p), quantifies the agreement between the tissue type observed at voxel x and the expected tissue type of ROI p. Tissue probabilities of target image voxels are computed for the three tissue types GM, WM and CSF using a fuzzy segmentation, and are converted into tissue probability maps for “brain” and “non-brain”. These two maps are then used to set the value of b2(x, p), by assigning to it the value at voxel x from the probability map that corresponds to the tissue type of ROI p.
2.4. Weighted Label Voting
The label fusion incorporates the local similarity ranking and the intensity based boundary modulation term. These two terms are effectively representing two complementary sources of information:
An ensemble constructed by atlas transformations, which is used to transfer segmentation labels from atlases to the target space;
The intensity information from the target image, which modulates the segmentation, particularly at the ROI boundaries.
The weighted vote of voxel x ∊ ΩS for being labeled as ROI p is calculated as:
| (3) |
where k is the number of selected warps, δ(·) is an indicator function used for selecting warps with the ROI label p at voxel x, and α1 and α2 are coefficients that modulate the effect of each term to the final fusion. Note that the rank score is normalized by the sum of all ranks to obtain a value bounded between 0 and 1. A voxel is assigned to the most likely label p*, i.e.:
| (4) |
3. Experiments
In this section, we present experimental results that were obtained by applying our method on a large number of datasets.
The first set of experiments aimed to evaluate the contribution of various ensemble combinations and individual components of our method to the final segmentation. A second set of experiments were performed to validate segmentation performance in comparison to other multi-atlas label fusion methods. We also present the results of an independent comparative evaluation that was done as part of the MICCAI 2013 segmentation challenge. The validation experiments were performed on various publicly available datasets with reference labels for diverse brain regions. A single fold cross-validation was applied for each dataset to segment ROIs in each image. This was preferred in order not to over-tweak the parameters for a specific set of reference atlas dataset and thus to keep our method more generalizable to unseen datasets. Besides, differently from learning-based approaches that rely on multi-fold cross-validation for the construction of the training model, our method does not require any training on reference atlas labels. The segmentations were applied independently on each dataset, as the reference label definitions were not consistent between various atlas datasets. The Dice similarity coefficient, or Dice Score, a standard metric that is widely used for measuring the degree of overlap between the target and the reference segmentations, was calculated for quantitative evaluation. The global Dice score for a subject was calculated as the average of the Dice scores for all individual ROIs for this subject.
A third set of experiments investigated the segmentation performance of our method on multi-site data. Imaging variability due to differences in scanner manufacturers, scan protocols and parameters is a major challenge for cross-study analysis of MRI data. The robustness of any segmentation method is of critical importance for addressing the challenges of cross-study analyses using “big data”, which is a direction of research that has been recently necessitated by the explosive growth of neuroimaging data. Since common reference labels for multiple datasets were not available, a direct quantitative evaluation of the segmentation accuracy in multi-site settings was not possible. Thus, we evaluated a higher-level outcome obtained by using the segmented ROIs as features in a support vector regression, in order to estimate “brain age”. In recent years the concept of using machine learning to determine brain age has gained popularity as a means for defining normative trajectories of brain development and aging (Dosenbach et al., 2010; Franke et al., 2012; Erus et al., 2014). A good brain age index offers high specificity, thereby enabling the detection of subtle deviations from normative trajectories much better. We created a large dataset of clinically normal subjects (n = 1029, age range 8 to 94) by pooling data from several studies. We segmented ROIs and we calculated the brain age with cross validation using ROI volumes as input to an ensemble learner. We measured the cross-validated brain age prediction accuracy, as an indicator of robustness and precision of the derived brain age index.
3.1. Data description
The internal validation experiments were performed on four benchmark datasets, BrainWeb (Aubert-Broche et al., 2006), IBSR6, NIREP (Christensen et al., 2006) and OASIS (Marcus et al., 2010), for which expert defined reference ROI labels were publicly available. The evaluation in the MICCAI 2013 segmentation challenge was done using the OASIS dataset. An illustration of the reference labels in each dataset is provided in supplementary figure 1.
In order to evaluate the multi-site segmentation performance of our method we created a large multi-study dataset of clinically normal subjects by pooling data from studies including BLSA (Resnick et al., 2000, 2003), ADNI-1 (Jack et al., 2008), PNC (Satterthwaite et al., 2014), BBL-NC 7, and NiCK (Hartung et al., 2015). The general characteristics of each of these datasets are summarized in table 1.
Table 1.
Summary characteristics of validation datasets
| dataset name | # of subjects | # of time-points | image dimensions | voxel dimensions | # of ROIs | age range (mean) | # of males | scanner | scan protocol | TR | TE | FA | |
|---|---|---|---|---|---|---|---|---|---|---|---|---|---|
| datasets with reference labels |
Brain- Web |
11 | 1 | 256×256×181 | 1.0×1.0×1.0 | 3 | 24–37 (30) |
n/a | Siemens Sonata (1.5T) |
SPGR | 22ms | 9.2ms | 30° |
| IBSR | 18 | 1 | 256×128×256 | 0.84×1.5×0.84 (n=4) 0.94×1.5×0.94 (n=8) 1.0×1.5×1.0 (n=6) |
32 | 7–71 (38)* |
14 | GE Signa (1.5T) |
SPGR | 40ms | 5ms | 40° | |
| NIREP | 16 | 1 | 256×300×256 | 1.0×1.0×1.0 | 33 | 24–48 (31) |
n/a | GE Signa (1.5T) |
SPGR | 24ms | 7ms | 50° | |
| OASIS | 35 | 1 | 256×(261– 334)×256 |
1.0×1.0×1.0 | 14 | 15–96 (53) |
n/a | Siemens Vision (1.5T) |
MP- RAGE |
9.7ms | 4ms | 10° | |
|
| |||||||||||||
| datasets without reference labels |
BLSA | 468 | 1 | 256×256×124 (n=92) 170×256×256 (n=376) |
0.94×0.94×1.5 (n=92) 1.2×1.2×1.0 (n=376) |
29–94 (67) |
220 | GE Signa (1.5T), PHILIPS (3T) |
SPGR, MP- RAGE |
varies by site | |||
| PNC | 201 | 1 | 192×256×160 | 0.94×0.94×1.0 | 8–22 (15) |
101 | Siemens TIM Trio (3T) |
MP- RAGE |
1.81s | 3.5ms | 9° | ||
| BBL-NC | 79 | 1 | 256×256×192 | 0.94×0.94×1.0 | 18–49 (28) |
41 | |||||||
| NiCK | 66 | 1 | 256×256×160 | 0.98×0.98×1.0 | 9–25 (16) |
35 | Siemens Verio (3T) |
MP- RAGE |
1.79s | 3.06m | 10° | ||
| ADNI-1 | 215 | 1 | (160–184)× (192–256)× (192–256) |
(1.18–1.21)× (0.91–1.35)× (0.93–1.36) |
60–90 (76) |
109 | varies across 57 sites |
MP- RAGE |
varies by site | ||||
3.2. Choice of registration methods and parameters
We used two relatively recent and extensively validated deformable registration methods, DRAMMS (Ou et al., 2011, 2014) and ANTS (Avants et al., 2008; Klein et al., 2009), for transferring atlas labels to target space. For both methods, the main parameter that regulates the smoothness of the deformation field was sampled at two operational points, specifically g = {0.1, 0.2} for DRAMMS and s = {0.25, 0.5} for ANTS. The parameters g = 0.2 for DRAMMS and s = 0.5 for ANTs are the default weighting parameters in these registration algorithms. Several independent studies have reported that these default parameters generated reasonable to very accurate registration results for multiple datasets. We further included g = 0.1 for DRAMMS and s = 0.25 for ANTs, which means smaller weights for smoothness. This results in a more aggressive registration, trading the deformation smoothness with higher registration-based voxel-/region-wise matching, which may be needed especially when the atlas and target subjects bear larger inter-subject variations (e.g., different cortical folding patterns may require less smooth deformation to match across patients). In comparative survey papers (Ou et al., 2014; Klein et al., 2009) and in many other studies, it was reported that more aggressive deformations may result in higher atlas-to-target regional overlaps, which is not ideal for registration but preferable for atlas-based segmentation. In our experiments we used these two parameter values to explore the potential complementary information provided by the default and more aggressive values for smoothness of the deformation field. However our method is generic and it can be run with other values of these and other parameters, as well as with other registration algorithms.
3.3. Results on public datasets
MUSE was applied on 4 public datasets for which reference label masks for diverse sets of ROIs were provided. All experiments were performed using leave-one-out cross validation, applying it independently for each dataset. In each fold, for segmenting the left-out subject all remaining images were used as the atlas pool, from which a subset of atlases were selected. In these experiments, we applied MUSE with various combinations of warps as input to the label fusion, i.e. by varying the number of atlases, the registration algorithms and registration parameters used in the registration step, in order to analyze the contribution of the ensemble to the labeling performance.
3.3.1. Comparison of various combinations of warps
Table 2.A below shows the contribution of combining various registration methods and various regularization parameters in segmentation performance. In all experiments, the number of atlases was set to 7. The selection of the atlases that were used in the segmentation was done by ranking the atlas pool based on global similarity to the target image after linearly aligning all atlases to an average atlas. In order to emphasize the effect of registration algorithms and parameters, we used simple majority voting in label fusion, where each voxel was assigned to the ROI with the highest number of votes from all warped label maps. The first four columns show the average Dice scores for single method/parameter, while the last column includes the ensemble of all warps in the fusion. We observe that, for each dataset, the complete ensemble of warps consistently outperforms ensembles of warps from a single registration algorithm, with significant differences (p < 0.01 with a paired t-test).
Table 2.
Dice scores obtained for the labeling of images in 4 public data sets using various combinations of warps and label fusion strategies.
| DRAMMS | ANTS | DRAMMS | ANTS | DRAMMS+ANTS | ||||
|---|---|---|---|---|---|---|---|---|
| 0.1 | 0.2 | 0.25 | 0.5 | 0.1+0.2 | 0.5+0.25 | All Parameters | ||
| A. MV | BrainWeb | 86.38 ± 0.59 | 85.8 ± 0.63 | 84.23 ± 1.21 | 85.75 ± 1.15 | 86.35 ± 0.61 | 85.18 ± 1.18 | 86.91 ± 0.84 |
| IBSR | 82.45 ± 1.31 | 82.34 ± 1.3 | 82.44 ± 1.44 | 82.95 ± 1.44 | 82.51 ± 1.32 | 82.79 ± 1.46 | 83.23 ± 1.36 | |
| NIREP | 79.09 ± 1.67 | 78.62 ± 1.69 | 77.77 ± 1.74 | 78.7 ± 01.72 | 79.18 ± 1.7 | 78.42 ± 1.73 | 79.73 ± 1.7 | |
| OASIS | 86.98 ± 2.63 | 86.99 ± 2.58 | 86.85 ± 2.6 | 87.05 ± 2.46 | 87.06 ± 2.61 | 87.01 ± 2.51 | 87.53 ± 2.34 | |
|
| ||||||||
| B. SimRank | BrainWeb | 88.06 ± 0.58 | 87.65 ± 0.61 | 86.94 ± 1.14 | 88.16 ± 1.08 | 88.24 ± 0.58 | 87.94 ± 1.1 | 89.26 ± 0.76 |
| IBSR | 83.21 ± 1.3 | 83.15 ± 1.23 | 83.38 ± 1.31 | 83.79 ± 1.36 | 83.35 ± 1.28 | 83.76 ± 1.31 | 84.14 ± 1.3 | |
| NIREP | 80.03 ± 1.74 | 79.75 ± 1.78 | 79.36 ± 1.79 | 79.99 ± 1.79 | 80.23 ± 1.79 | 79.91 ± 1.8 | 80.95 ± 1.79 | |
| OASIS | 87.43 ± 2.47 | 87.44 ± 2.36 | 87.46 ± 2.29 | 87.57 ± 2.18 | 87.53 ± 2.41 | 87.62 ± 2.21 | 88.07 ± 2.06 | |
|
| ||||||||
| C. SimRank+BM | BrainWeb | 90.54 ± 0.57 | 90.27 ± 0.59 | 89.73 ± 0.97 | 90.46 ± 0.91 | 90.78 ± 0.59 | 90.41 ± 0.92 | 91.61 ± 0.7 |
| IBSR | 84.15 ± 1.3 | 84.14 ± 1.21 | 84.27 ± 1.38 | 84.65 ± 1.35 | 84.27 ± 1.25 | 84.63 ± 1.35 | 84.96 ± 1.3 | |
| NIREP | 79.91 ± 1.69 | 79.61 ± 1.78 | 78.59 ± 1.9 | 79.24 ± 1.83 | 79.97 ± 1.77 | 79.04 ± 1.88 | 79.98 ± 1.88 | |
| OASIS | 87.68 ± 2.2 | 87.72 ± 2.11 | 87.99 ± 1.93 | 88.12 ± 1.77 | 87.76 ± 2.14 | 88.13 ± 1.82 | 88.27 ± 1.81 | |
3.3.2. MUSE with similarity ranking
Table 2.B shows the results when the label fusion was done with the adaptive weighting using the local similarity ranking term. The addition of the similarity based weighting term significantly increases the performance compared to simple majority voting (p < 0.01 for all datasets). Differences between using the complete ensemble of warps versus any set of warps from a single registration algorithm are significant as well.
3.3.3. MUSE with similarity ranking and boundary modulation
Table 2.C shows the results obtained using the complete MUSE method. The additional boundary modulation term results in higher segmentation accuracy for all datasets, except NIREP. The differences were significant, except for OASIS (p = 0.06185). Box plots of average Dice scores for each dataset using the complete ensemble of warps and the three different label fusion strategies are shown in figure 3. An example segmentation on one of the BrainWeb subjects that highlights the improvements as a result of ensemble construction and the proposed label fusion strategy are shown in figure 4.
Figure 3.

Box plots of average Dice scores for each benchmark dataset obtained using majority voting, MUSE with similarity ranking and MUSE with similarity ranking and boundary modulation. In all experiments DRAMMS and ANTS registrations of 7 atlases for two set of parameters were used as input to label fusion. Please note that the segmentation accuracy between datasets is not comparable, since each dataset has a different reference ROI definition.
Figure 4.

An example from the BrainWeb dataset highlighting the effects and the improvements resulting from individual components of the method. The figure shows the original image (a), and the GM probability maps resulting from: majority voting of DRAMMS warps (b), majority voting of ANTS warps (c), majority voting of DRAMMS+ANTS warps (d) and the final result employing the warp ensemble, similarity ranking and boundary modulation (e). The marked circle indicates the area of improvement as a result of the combination of warps as well as the proposed label fusion method.
3.3.4. The effect of number of atlases on the segmentation
Ideally, it would be preferable to run any multi atlas label fusion method with the maximum number of available atlases. However, as each atlas should be non-linearly warped to the target space, this may not be feasible or preferable in terms of available computational resources. Thus it's important to select the appropriate atlas set that will give accurate results with the least number of atlases. For evaluating the effect of number of atlases on the segmentation performance, we applied MUSE on all 4 datasets with varying number of atlases within a wide range. We observe that the segmentation accuracy consistently increases with more atlases until it reaches a stable value around 7 atlases (Figure 5).
Figure 5.
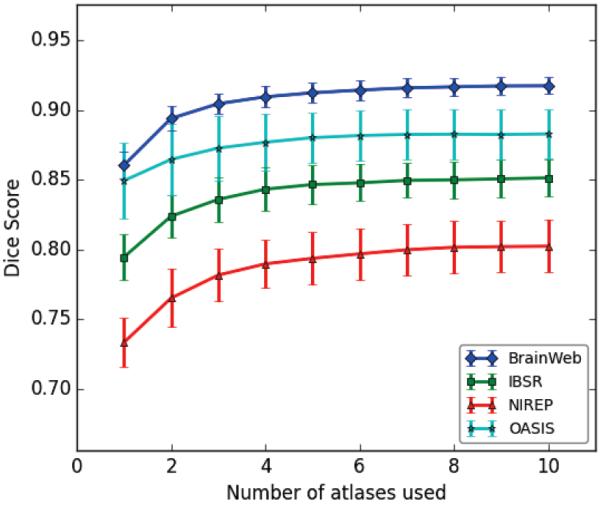
Dice scores obtained for label fusion using varying number of atlases.
3.4. Segmentation of midbrain structures in the OASIS Dataset
As part of the MICCAI 2013 segmentation challenge, a dataset with training and testing images from OASIS project with reference label maps was created for evaluating multi-atlas label fusion algorithms in segmentation of mid-brain structures. The reference labels for the final test set were kept undisclosed and the segmentation accuracy of participating methods was calculated by the organizers. Table 3 below presents a summary of the challenge results. The challenge attracted a wide range of methods, including MUSE (named in the challenge as UPENN-SBIA-MAM), the joint label fusion approach described in (Wang et al., 2012) (PICSL), a levelset-based label fusion and correction method (SBIA-LevelSet), a new label fusion method that uses a modality independent neighbourhood descriptor (Heinrich et al., 2012) (deedsMIND), and a label propagation method using random forests (Zikic et al., 2014)(MSRC). Consistently with our cross-validated segmentation accuracy on the training dataset, MUSE performed with high accuracy on the testing dataset and obtained the highest average Dice score. However, the scores of the three methods with the highest ranks were similar and comparable.
Table 3.
Segmentation of mid-brain structures.
| Average Dice Coefficient | Hausdorff Distance | |||
|---|---|---|---|---|
| Team Name | Mean | Median | Mean | Median |
| UPENN-SBIA-MAM | 0.8686 | 0.8772 | 3.3043 | 3.1006 |
| PICSL | 0.8663 | 0.8786 | 3.5381 | 3.2369 |
| SBIA-LevelSet | 0.8654 | 0.8775 | 3.4237 | 3.1429 |
| deedsMIND | 0.8402 | 0.8573 | 4.1027 | 3.8983 |
| PICSL-SV-MRF | 0.8343 | 0.8421 | 4.1749 | 3.9972 |
| MSRC-AtlasForest-Stage2 | 0.8282 | 0.8484 | 3.7411 | 3.5231 |
| DL-UB | 0.8243 | 0.8346 | 5.0941 | 4.5566 |
| PICSL-SV-MRF-baseline_3 | 0.8186 | 0.822 | 5.3519 | 5.1216 |
| MSRC-AF-NEW-STAPLE | 0.8063 | 0.8169 | 4.6494 | 4.376 |
| deedsMIND-no-marginals | 0.7216 | 0.7539 | 6.1614 | 5.512 |
Retrieved from http://masi.vuse.vanderbilt.edu/submission/leaderboard.html on 11/02/2015.
Unidentified or undocumented submissions, and repeat submissions are not shown.
For detailed method descriptions of listed submissions please see the challenge proceedings at https://masi.vuse.vanderbilt.edu/workshop2013/images/1/1b/SATA-2013-Proceedings.pdf
3.5. Application of MUSE on a multi-site dataset of healthy control subjects
For each subject of the pooled multi-site dataset ROI segmentation was performed by independently applying three different methods, MUSE, STAPLE (Warfield et al., 2004) and Joint Label Fusion (Wang et al., 2012). In each experiment we used 11 atlases selected from the set of 35 OASIS atlases with reference labels, and we used the complete ensemble of warps computed by applying DRAMMS and ANTS with the two smoothness values for each algorithm. Scatter plots of ROI volumes of all subjects for lateral ventricles, hippocampus, posterior cingulate gyri and superior frontal gyri, as well as for total GM and WM volumes, calculated using MUSE and the two other label fusion methods are shown in supplementary figures 2 and 3.
We used ROI volumes as input to a supervised learning framework for the prediction of brain age. We trained an ensemble of regressors on the ROI volumes using the complete dataset (n = 1029) with leave-one-out cross-validation, and predicted the age of each subject using the trained models. We calculated Pearson's correlation coefficient (r), concordance correlation coefficient (ccc) (Lin, 1989) and mean absolute error (MAE) as quantitative metrics of prediction accuracy. The quantitative evaluation results for the three methods are given in table 4. MUSE obtained the highest accuracy in terms of all three metrics. A plot of actual ages and predicted brain ages of all subjects are shown in figure 6.
Table 4.
Brain age prediction from ROI volumes computed using three alternative label fusion methods. The brain age is calculated with cross-validation using across study data. Pearson's correlation coefficient (r), concordance correlation coefficient (ccc) and mean absolute error (MAE) were calculated as quantitative metrics of prediction accuracy.
| STAPLE | JLF | MUSE | |||||||
|---|---|---|---|---|---|---|---|---|---|
| r | ccc | mae | r | ccc | mae | r | ccc | mae | |
| ADNI-1 | 0.34 | 0.21 | 7.37 | 0.45 | 0.31 | 6.13 | 0.47 | 0.40 | 4.91 |
| PNC | 0.40 | 0.21 | 6.37 | 0.51 | 0.28 | 5.86 | 0.59 | 0.47 | 3.47 |
| BBL-NC | 0.46 | 0.30 | 9.32 | 0.60 | 0.43 | 8.49 | 0.70 | 0.62 | 5.99 |
| BLSA | 0.79 | 0.77 | 6.85 | 0.81 | 0.79 | 6.79 | 0.80 | 0.78 | 6.59 |
| NiCK | 0.40 | 0.20 | 6.82 | 0.46 | 0.22 | 7.16 | 0.53 | 0.34 | 5.11 |
| AllStudies | 0.94 | 0.93 | 7.05 | 0.95 | 0.94 | 6.62 | 0.96 | 0.96 | 5.49 |
Figure 6.

Scatter plot of actual and predicted ages for the multi-study data of normal controls. The age prediction was performed using an ensemble regressor using as input volumetric imaging features obtained by applying three different label fusion methods.
4. Discussion
We presented a new method for ensemble-based brain parcelation. The main contribution of the proposed framework is that it represents each anatomy with a rich ensemble of warps that incorporates choice of the atlas, deformation algorithm and deformation parameters. Different registration methods, which generally use notably different image features, energy formulations and optimization algorithms, provide complementary information about the anatomy. Each method and parameter set can be relatively less or more accurate in certain areas of the brain, thereby rendering an ensemble-based segmentation advantageous. Moreover, our approach is effectively a patient- and regionally-specific application of MAS, as for each individual and each brain region the most suitable set of labeling estimates was used in the ensemble approach.
We demonstrated that the ensemble of a multitude of warps, particularly using appropriate techniques for fusing them together, has significantly improved the segmentation accuracy, and provided robust segmentations. The fact that ensemble fusion consistently outperforms segmentations using single registration algorithm/parameter combinations is particularly important. Selection of optimal algorithm/parameter value for MAS is an open question, as we don't have a priori correct value for it. As stated in Rohlfing and Maurer (2005), the ensemble approach efficiently solves this problem by covering a range of possible values without having to pick one, and in this way provides a robust segmentation tool. This approach is more and more required in the big data era where multi-site data with diverse scanner characteristics and subject demographics are increasingly used.
MUSE achieved consistently high Dice scores for the segmentation of important deep brain structures, such as hippocampus, thalamus and caudate, which have been previously shown to be associated with various neurodegenerative diseases (Laakso et al., 1996; Konick and Friedman, 2001; Levitt et al., 2002), and for which accurate segmentation is very important for the quantification of disease related changes. Importantly, MUSE achieved an accuracy comparable to a recent learning based approach (Wang et al., 2012), which incorporated massive training for each ROI using image patches and corresponding labels from the training set. A learning based approach is expected to improve the segmentation accuracy within a single dataset, however it may also overfit to a specific set of reference labels and thus may have lower generalizability to new datasets, compared to a pure label fusion based approach without learning. We tested the robustness of MUSE as a generic segmentation tool in our experiments using multi-site datasets. Imaging features derived using MUSE segmentation could accurately predict the brain age, which is promising for the exploration of large quantities of neuroimaging data from various studies with the aim of phenotyping the human brain.
In our internal validation experiments we demonstrated the contribution of the similarity ranking and the boundary modulation terms to segmentation performance. For one of the datasets, NIREP, the boundary modulation term did not improve the quantitative results. With a closer inspection, we observed that the decrease in the Dice score is mainly due to the low accuracy of the reference ROI masks. Specifically in the deep brain structures, the reference ROIs were under-segmented. The boundary modulation term thus tends to compensate for the under-segmented areas that have a similar intensity profile.
One of the limitations of MUSE is the high computational requirement, which is a general problem for MAS methods. While the use of multiple registration methods and atlases would linearly increase the computation time, this is not a hard constraint for the practical application of MUSE, because the registrations are very efficiently parallelizable, and notably, multi-scale implementation of registration algorithms can effectively generate warps of various smoothness levels for no additional cost. Furthermore, depending on the available computational resources, the user can easily limit the number of required registrations using the command line parameters.
In summary, we have presented a methodological framework for ensemble-based segmentation of brain MRI using a rich representation of brain anatomy via multiple atlases, warps and parameter sets, and via an adaptive and subject-specific ensemble-based segmentation. Our results showed that this approach outperforms methods that are based on single parameter sets and registration algorithms, and can therefore provide a foundation for robust segmentation.
We provide MUSE software both as a downloadable package, and as an application that can be run remotely on our web based platform. We believe that this would allow users with diverse needs, datasets, expertise and computational resources to be able to use MUSE both conveniently and efficiently. The web client will also allow users to use a very large atlas dataset for the segmentation. This dataset will incorporate datasets with considerable diversity in scanner and subject characteristics, and will be regularly expanded with new atlases in the future.
Supplementary Material
Highlights.
A new multiatlas segmentation framework using a broad ensemble of labeled templates;
Combines different atlases, warping algorithms, and regularization parameters;
Uses an adaptive fusion strategy through local similarity weighting and intensity based refinement;
Ensemble approach provides robustness to image variations and produces accurate segmentations;
Acknowledgments
This work was partially supported by the Intramural Research Program, National Institute on Aging, NIH. This work is also supported in part by the National Institutes of Health grant number R01-AG014971, and by contract HHSN271201300284.
Footnotes
Publisher's Disclaimer: This is a PDF file of an unedited manuscript that has been accepted for publication. As a service to our customers we are providing this early version of the manuscript. The manuscript will undergo copyediting, typesetting, and review of the resulting proof before it is published in its final citable form. Please note that during the production process errors may be discovered which could affect the content, and all legal disclaimers that apply to the journal pertain.
MICCAI 2013 SATA Challenge Leaderboard, retrieved 11/02/2015 from URL http://masi.vuse.vanderbilt.edu/submission/leaderboard.html
The beta release is accessible from http://ipp.cbica.upenn.edu
National Institute of Health supported Internet Brain Segmentation Repository (IBSR), http://www.cma.mgh.harvard.edu/ibsr
Brain Behavior Laboratory, UPENN, http://www.med.upenn.edu/bbl/bbl.shtml
References
- Aljabar P, Heckemann R, Hammers A, Hajnal J, Rueckert D. Multi-atlas based segmentation of brain images: Atlas selection and its effect on accuracy. NeuroImage. 2009 Jul;46(3):726–738. doi: 10.1016/j.neuroimage.2009.02.018. [DOI] [PubMed] [Google Scholar]
- Artaechevarria X, Munoz-Barrutia A, Ortiz-de Solorzano C. Combination strategies in multi-atlas image segmentation: application to brain MR data. IEEE Trans Med Imaging. 2009 Aug;28(8):1266–1277. doi: 10.1109/TMI.2009.2014372. [DOI] [PubMed] [Google Scholar]
- Asman AJ, Landman BA. Non-local statistical label fusion for multi-atlas segmentation. Medical Image Analysis. 2013 Feb;17(2):194–208. doi: 10.1016/j.media.2012.10.002. [DOI] [PMC free article] [PubMed] [Google Scholar]
- Aubert-Broche B, Evans AC, Collins L. A new improved version of the realistic digital brain phantom. Neuroimage. 2006 Aug;32(1):138–145. doi: 10.1016/j.neuroimage.2006.03.052. [DOI] [PubMed] [Google Scholar]
- Avants BB, Epstein CL, Grossman M, Gee JC. Symmetric diffeomorphic image registration with cross-correlation: evaluating automated labeling of elderly and neurodegenerative brain. Med Image Anal. 2008 Feb;12(1):26–41. doi: 10.1016/j.media.2007.06.004. [DOI] [PMC free article] [PubMed] [Google Scholar]
- Bai J, Trinh TLH, Chuang K-H, Qiu A. Atlas-based automatic mouse brain image segmentation revisited: model complexity vs. image registration. Magn Reson Imaging. 2012 Jul;30(6):789–798. doi: 10.1016/j.mri.2012.02.010. [DOI] [PubMed] [Google Scholar]
- Baloch S, Davatzikos C. Morphological appearance manifolds in computational anatomy: Groupwise registration and morphological analysis. NeuroImage. 2008 Nov;45(1 Suppl):S73–S85. doi: 10.1016/j.neuroimage.2008.10.048. [DOI] [PMC free article] [PubMed] [Google Scholar]
- Cardoso MJ, Leung K, Modat M, Keihaninejad S, Cash D, Barnes J, Fox NC, Ourselin S. STEPS: Similarity and Truth Estimation for Propagated Segmentations and its application to hippocampal segmentation and brain parcelation. Med Image Anal. 2013 Aug;17(6):671–684. doi: 10.1016/j.media.2013.02.006. [DOI] [PubMed] [Google Scholar]
- Christensen GE, Geng X, Kuhl JG, Bruss J, Grabowski TJ, Pirwani IA, Vannier MW, Allen JS, Damasio H. Introduction to the non-rigid image registration evaluation project (NIREP). Proceedings of the Third International Conference on Biomedical Image Registration. WBIR'06; Berlin, Heidelberg: Springer-Verlag; 2006. pp. 128–135. [Google Scholar]
- Coupé P, Manjón JV, Fonov V, Pruessner J, Robles M, Collins DL. Patch-based segmentation using expert priors: Application to hippocampus and ventricle segmentation. NeuroImage. 2011 Jan;54(2):940–954. doi: 10.1016/j.neuroimage.2010.09.018. [DOI] [PubMed] [Google Scholar]
- Dosenbach NU, Nardos B, Cohen AL, Fair DA, Power JD, Church JA, Nelson SM, Wig GS, Vogel AC, Lessov-Schlaggar CN, Barnes KA, Dubis JW, Feczko E, Coalson RS, Pruett JR, Barch DM, Petersen SE, Schlaggar BL. Prediction of individual brain maturity using fMRI. Science. 2010 Sep;329(5997):1358–1361. doi: 10.1126/science.1194144. [DOI] [PMC free article] [PubMed] [Google Scholar]
- Erus G, Battapady H, Satterthwaite TD, Hakonarson H, Gur RE, Davatzikos C, Gur RC. Imaging patterns of brain development and their relationship to cognition. Cerebral Cortex. 2014 doi: 10.1093/cercor/bht425. [DOI] [PMC free article] [PubMed] [Google Scholar]
- Franke K, Luders E, May A, Wilke M, Gaser C. Brain maturation: Predicting individual BrainAGE in children and adolescents using structural MRI. NeuroImage. 2012;63(3):1305–1312. doi: 10.1016/j.neuroimage.2012.08.001. [DOI] [PubMed] [Google Scholar]
- Good CD, Scahill RI, Fox NC, Ashburner J, Friston KJ, Chan D, Crum WR, Rossor MN, Frackowiak RS. Automatic differentiation of anatomical patterns in the human brain: Validation with studies of degenerative dementias. NeuroImage. 2002 Sep;17(1):29–46. doi: 10.1006/nimg.2002.1202. [DOI] [PubMed] [Google Scholar]
- Gousias I, Hammers A, Heckemann R, Counsell S, Dyet L, Boardman J, Edwards A, Rueckert D. Atlas selection strategy for automatic segmentation of pediatric brain MRIs into 83 ROIs. Imaging Systems and Techniques (IST), 2010 IEEE International Conference on.Jul, 2010. pp. 290–293. [Google Scholar]
- Hartung EA, Laney N, Kim JY, Ruebner RL, Detre JA, Liu H-S, Davatzikos C, Erus G, Doshi JJ, Schultz RT, Herrington JD, Jawad AF, Moodalbail DG, Gur RC, Port AM, Radcliffe J, Hooper SR, Furth SL. Design and methods of the NiCK study: neurocognitive assessment and magnetic resonance imaging analysis of children and young adults with chronic kidney disease. BMC Nephrol. 2015;16:66. doi: 10.1186/s12882-015-0061-1. [DOI] [PMC free article] [PubMed] [Google Scholar]
- Heinrich MP, Jenkinson M, Bhushan M, Matin T, Gleeson FV, Brady SM, Schnabel JA. Mind: Modality independent neighbourhood descriptor for multi-modal deformable registration. Medical Image Analysis. 2012;16(7):1423–1435. doi: 10.1016/j.media.2012.05.008. special Issue on the 2011 Conference on Medical Image Computing and Computer Assisted Intervention. [DOI] [PubMed] [Google Scholar]
- Hibar DP, Stein JL, Renteria M. E. e. a. Common genetic variants influence human subcortical brain structures. Nature. 2015 Apr;520(7546):224–229. doi: 10.1038/nature14101. [DOI] [PMC free article] [PubMed] [Google Scholar]
- Hoang Duc AK, Modat M, Leung KK, Cardoso MJ, Barnes J, Kadir T, Ourselin S, the Alzheimers Disease Neuroimaging Initiative Using manifold learning for atlas selection in multi-atlas segmentation. PLoS ONE. 2013 Aug;8(8):e70059. doi: 10.1371/journal.pone.0070059. [DOI] [PMC free article] [PubMed] [Google Scholar]
- Iglesias JE, Sabuncu MR. Multi-atlas segmentation of biomedical images: A survey. Medical Image Analysis. 2015;24(1):205–219. doi: 10.1016/j.media.2015.06.012. [DOI] [PMC free article] [PubMed] [Google Scholar]
- Isgum I, Staring M, Rutten A, Prokop M, Viergever MA, van Ginneken B. Multi-atlas-based segmentation with local decision fusion–application to cardiac and aortic segmentation in CT scans. IEEE Trans Med Imaging. 2009 Jul;28(7):1000–1010. doi: 10.1109/TMI.2008.2011480. [DOI] [PubMed] [Google Scholar]
- Jack CR, Jr, Bernstein MA, Fox NC, Thompson P, Alexander G, Harvey D, Borowski B, Britson PJ, L Whitwell J, Ward C, Dale AM, Felmlee JP, Gunter JL, Hill DLG, Killiany R, Schuff N, Fox-Bosetti S, Lin C, Studholme C, DeCarli CS, Krueger G, Ward HA, Metzger GJ, Scott KT, Mallozzi R, Blezek D, Levy J, Debbins JP, Fleisher AS, Albert M, Green R, Bartzokis G, Glover G, Mugler J, Weiner MW. The alzheimer's disease neuroimaging initiative (ADNI): MRI methods. J Magn Reson Imaging. 2008 Apr;27(4):685–691. doi: 10.1002/jmri.21049. [DOI] [PMC free article] [PubMed] [Google Scholar]
- Khan AR, Cherbuin N, Wen W, Anstey KJ, Sachdev P, Beg MF. Optimal weights for local multi-atlas fusion using supervised learning and dynamic information (SuperDyn): validation on hippocampus segmentation. Neuroimage. 2011 May;56(1):126–139. doi: 10.1016/j.neuroimage.2011.01.078. [DOI] [PubMed] [Google Scholar]
- Klein A, Andersson J, Ardekani BA, Ashburner J, Avants B, Chiang M-C, Christensen GE, Collins DL, Gee J, Hellier P, Song JH, Jenkinson M, Lepage C, Rueckert D, Thompson P, Vercauteren T, Woods RP, Mann JJ, Parsey RV. Evaluation of 14 non-linear deformation algorithms applied to human brain MRI registration. Neuroimage. 2009 Jul;46(3):786–802. doi: 10.1016/j.neuroimage.2008.12.037. [DOI] [PMC free article] [PubMed] [Google Scholar]
- Konick LC, Friedman L. Meta-analysis of thalamic size in schizophrenia. Biological Psychiatry. 2001 Jan;49(1):28–38. doi: 10.1016/s0006-3223(00)00974-4. [DOI] [PubMed] [Google Scholar]
- Konukoglu E, Glocker B, Zikic D, Criminisi A. Neighbourhood approximation using randomized forests. Medical Image Analysis. 2013 Oct;17(7):790–804. doi: 10.1016/j.media.2013.04.013. [DOI] [PubMed] [Google Scholar]
- Laakso MP, Partanen K, Riekkinen P, Lehtovirta M, Helkala EL, Hallikainen M, Hanninen T, Vainio P, Soininen H. Hippocampal volumes in Alzheimer's disease, Parkinson's disease with and without dementia, and in vascular dementia: An MRI study. Neurology. 1996 Mar;46(3):678–681. doi: 10.1212/wnl.46.3.678. [DOI] [PubMed] [Google Scholar]
- Landman BA, Asman AJ, Scoggins AG, Bogovic JA, Xing F, Prince JL. Robust statistical fusion of image labels. IEEE transactions on medical imaging. 2011 Oct;31(2):512–522. doi: 10.1109/TMI.2011.2172215. [DOI] [PMC free article] [PubMed] [Google Scholar]
- Leung KK, Barnes J, Modat M, Ridgway GR, Bartlett JW, Fox NC, Ourselin S. Brain MAPS: An automated, accurate and robust brain extraction technique using a template library. NeuroImage. 2011 Apr;55(3):1091–1108. doi: 10.1016/j.neuroimage.2010.12.067. [DOI] [PMC free article] [PubMed] [Google Scholar]
- Levitt JJ, McCarley RW, Dickey CC, Voglmaier MM, Niznikiewicz MA, Seidman LJ, Hirayasu Y, Ciszewski AA, Kikinis R, Jolesz FA, Shenton ME. MRI study of caudate nucleus volume and its cognitive correlates in neuroleptic-naive patients with schizotypal personality disorder. Am J Psychiatry. 2002 Jul;159(7):1190–1197. doi: 10.1176/appi.ajp.159.7.1190. [DOI] [PMC free article] [PubMed] [Google Scholar]
- Lin LI. A concordance correlation coefficient to evaluate reproducibility. Biometrics. 1989 Mar;45(1):255–268. [PubMed] [Google Scholar]
- Lötjönen JM, Wolz R, Koikkalainen JR, Thurfjell L, Waldemar G, Soininen H, Rueckert D. Fast and robust multi-atlas segmentation of brain magnetic resonance images. NeuroImage. 2010 Feb;49(3):2352–2365. doi: 10.1016/j.neuroimage.2009.10.026. [DOI] [PubMed] [Google Scholar]
- Marcus DS, Fotenos AF, Csernansky JG, Morris JC, Buckner RL. Open Access Series of Imaging Studies (OASIS): Longitudinal MRI data in nondemented and demented older adults. Journal of cognitive neuroscience. 2010 Dec;22(12):2677–2684. doi: 10.1162/jocn.2009.21407. [DOI] [PMC free article] [PubMed] [Google Scholar]
- Medland SE, Jahanshad N, Neale BM, Thompson PM. Whole-genome analyses of whole-brain data: working within an expanded search space. Nat Neurosci. 2014 Jun;17(6):791–800. doi: 10.1038/nn.3718. [DOI] [PMC free article] [PubMed] [Google Scholar]
- Ou Y, Akbari H, Bilello M, Da X, Davatzikos C. Comparative evaluation of registration algorithms in different brain databases with varying difficulty: results and insights. IEEE Trans Med Imaging. 2014 Oct;33(10):2039–2065. doi: 10.1109/TMI.2014.2330355. [DOI] [PMC free article] [PubMed] [Google Scholar]
- Ou Y, Sotiras A, Paragios N, Davatzikos C. DRAMMS: Deformable registration via attribute matching and mutual-saliency weighting. Med Image Anal. 2011 Aug;15(4):622–639. doi: 10.1016/j.media.2010.07.002. [DOI] [PMC free article] [PubMed] [Google Scholar]
- Pipitone J, Park MT, Winterburn J, Lett TA, Lerch JP, Pruessner JC, Lepage M, Voineskos AN, Chakravarty MM, Initiative AD, et al. Multi-atlas segmentation of the whole hippocampus and subfields using multiple automatically generated templates. Neuroimage. 2014;101:494–512. doi: 10.1016/j.neuroimage.2014.04.054. [DOI] [PubMed] [Google Scholar]
- Poldrack RA. Region of interest analysis for fMRI. Social cognitive and affective neuroscience. 2007 Feb;2(1):67–70. doi: 10.1093/scan/nsm006. [DOI] [PMC free article] [PubMed] [Google Scholar]
- Resnick SM, Goldszal AF, Davatzikos C, Golski S, Kraut MA, Metter EJ, Bryan RN, Zonderman AB. One-year age changes in MRI brain volumes in older adults. Cereb Cortex. 2000 May;10(5):464–472. doi: 10.1093/cercor/10.5.464. [DOI] [PubMed] [Google Scholar]
- Resnick SM, Pham DL, Kraut MA, Zonderman AB, Davatzikos C. Longitudinal magnetic resonance imaging studies of older adults: a shrinking brain. J Neurosci. 2003 Apr;23(8):3295–3301. doi: 10.1523/JNEUROSCI.23-08-03295.2003. [DOI] [PMC free article] [PubMed] [Google Scholar]
- Rohlfing T, Maurer CR., Jr. Multi-classifier framework for atlas-based image segmentation. Pattern Recogn. Lett. 2005 Oct;26(13):2070–2079. [Google Scholar]
- Sabuncu MR, Yeo BTT, Van Leemput K, Fischl B, Golland P. A generative model for image segmentation based on label fusion. IEEE Trans Med Imaging. 2010 Oct;29(10):1714–1729. doi: 10.1109/TMI.2010.2050897. [DOI] [PMC free article] [PubMed] [Google Scholar]
- Sanroma G, Wu G, Gao Y, Shen D. Learning to rank atlases for multiple-atlas segmentation. IEEE Trans Med Imaging. 2014 Oct;33(10):1939–1953. doi: 10.1109/TMI.2014.2327516. [DOI] [PMC free article] [PubMed] [Google Scholar]
- Satterthwaite TD, Elliott MA, Ruparel K, Loughead J, Prabhakaran K, Calkins ME, Hopson R, Jackson C, Keefe J, Riley M, Mentch FD, Sleiman P, Verma R, Davatzikos C, Hakonarson H, Gur RC, Gur RE. Neuroimaging of the Philadelphia neurodevelopmental cohort. Neuroimage. 2014 Feb;86:544–553. doi: 10.1016/j.neuroimage.2013.07.064. [DOI] [PMC free article] [PubMed] [Google Scholar]
- Sotiras A, Davatzikos C, Paragios N. Deformable medical image registration: A survey. IEEE transactions on medical imaging. 2013 May;32(7):1153–1190. doi: 10.1109/TMI.2013.2265603. [DOI] [PMC free article] [PubMed] [Google Scholar]
- Wang H, Pouch A, Takabe M, Jackson B, Gorman J, Gorman R, Yushkevich PA. Multi-atlas segmentation with robust label transfer and label fusion. Information processing in medical imaging. 2013;23:548–559. doi: 10.1007/978-3-642-38868-2_46. [DOI] [PMC free article] [PubMed] [Google Scholar]
- Wang H, Suh JW, Das SR, Pluta J, Craige C, Yushkevich PA. Multi-atlas segmentation with joint label fusion. IEEE Trans Pattern Anal Mach Intell. 2012 Jun; doi: 10.1109/TPAMI.2012.143. [DOI] [PMC free article] [PubMed] [Google Scholar]
- Warfield SK, Zou KH, Wells WM. Simultaneous truth and performance level estimation (STAPLE): an algorithm for the validation of image segmentation. IEEE Trans Med Imaging. 2004 Jul;23(7):903–921. doi: 10.1109/TMI.2004.828354. [DOI] [PMC free article] [PubMed] [Google Scholar]
- Wolz R, Aljabar P, Rueckert D, Heckemann R, Hammers A. Segmentation of subcortical structures and the hippocampus in brain MRI using graph-cuts and subject-specific a-priori information. Biomedical Imaging: From Nano to Macro, 2009. ISBI '09. IEEE International Symposium on.Jun, 2009. pp. 470–473. [Google Scholar]
- Wu G, Kim M, Sanroma G, Wang Q, Munsell BC, Shen D, A. D. N. I. Hierarchical multi-atlas label fusion with multi-scale feature representation and label-specific patch partition. Neuroimage. 2015 Feb;106:34–46. doi: 10.1016/j.neuroimage.2014.11.025. [DOI] [PMC free article] [PubMed] [Google Scholar]
- Wu M, Rosano C, Lopez-Garcia P, Carter CS, Aizenstein HJ. Optimum template selection for atlas-based segmentation. Neuroimage. 2007 Feb;34(4):1612–1618. doi: 10.1016/j.neuroimage.2006.07.050. [DOI] [PubMed] [Google Scholar]
- Zikic D, Glocker B, Criminisi A. Encoding atlases by randomized classification forests for efficient multi-atlas label propagation. Med Image Anal. 2014 Dec;18(8):1262–1273. doi: 10.1016/j.media.2014.06.010. [DOI] [PubMed] [Google Scholar]
Associated Data
This section collects any data citations, data availability statements, or supplementary materials included in this article.