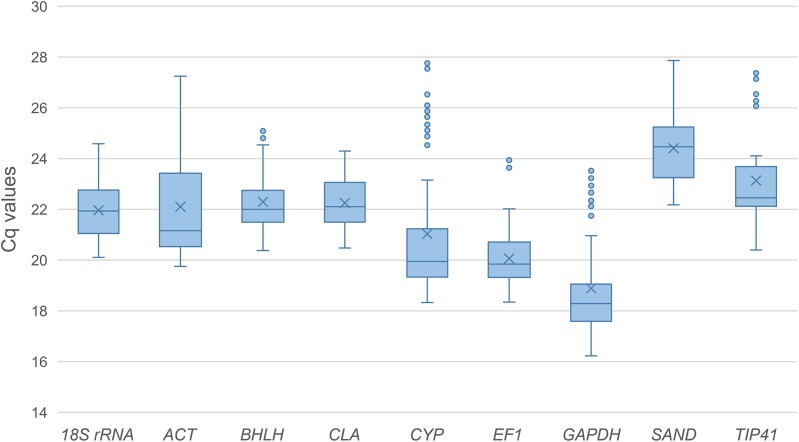
Figure 1. Quantification cycle (Cq) values of the nine candidate reference genes across all the experimental samples.
Whiskers represent the local maximum and minimum values, and points beyond the end of each whisker mark the outliers. Lower and upper boxes indicate the 25th to 75th percentile, and the midlines inside the boxes represent the medians. The means are denoted by “×” markers.

