Abstract
Enzymes are known to change among several conformational states during turnover. The role of such dynamic structural changes in catalysis is not fully understood. The influence of dynamics in catalysis can be inferred, but not proven, by comparison of equilibrium structures of protein variants and protein–ligand complexes. A more direct way to establish connections between protein dynamics and the catalytic cycle is to probe the kinetics of specific protein motions in comparison to progress along the reaction coordinate. We have examined the enzyme model system dihydrofolate reductase (DHFR) from Escherichia coli with tryptophan fluorescence-probed temperature-jump spectroscopy. We aimed to observe the kinetics of the ligand binding and ligand-induced conformational changes of three DHFR complexes to establish the relationship among these catalytic steps. Surprisingly, in all three complexes, the observed kinetics do not match a simple sequential two-step process. Through analysis of the relationship between ligand concentration and observed rate, we conclude that the observed kinetics correspond to the ligand binding step of the reaction and a noncoupled enzyme conformational change. The kinetics of the conformational change vary with the ligand's identity and presence but do not appear to be directly related to progress along the reaction coordinate. These results emphasize the need for kinetic studies of DHFR with highly specific spectroscopic probes to determine which dynamic events are coupled to the catalytic cycle and which are not.
It is well-established that protein motions are critical for enzymatic catalysis.1,2 Studies have demonstrated when key motions are knocked out by mutations, the activity of the enzyme is affected.3–6 However, the exact role of enzyme dynamics in the catalytic cycle is not fully understood and continues to be an active area of research.7–17 Enzyme dynamics can be split into two categories: motions on the time scale of the chemistry step that may be coupled to crossing the transition state and slower motions related to bringing the enzyme to active conformations, particularly relating to substrate binding and activation. In this study, we focus on the latter class of enzyme dynamics by examining the protein motions of Escherichia coli dihydrofolate reductase (E. coli DHFR), an archetype for enzyme dynamics. A previous study of DHFR found there are protein motions on the millisecond time scale that are uncorrelated to the chemistry step;18 the focus of this study is on protein motions that occur on a time scale faster than what has been measured previously. The hydride transfer (crossing the transition state) actually occurs on the picosecond time scale, so it is the search for reactive structures that ultimately determines the time scale of the chemical step. Furthermore, the overall rate-determining step is product release, so steady state measurements on the millisecond time scale are dominated by this slow process. Using temperature-jump methods, we have probed protein motions on a time scale significantly shorter than the overall turnover rate, which allows us to probe all of the motions involved in cofactor and substrate binding and the search for reactive conformations. Thus, this study is also related to fundamental questions of substrate and transition state binding, i.e., induced fit or conformational selection models.19
DHFR is a ubiquitous enzyme that catalyzes the reduction of dihydrofolate (DHF) to tetrahydrofolate (THF) via a nicotinamide adenine dinucleotide phosphate (NADPH) cofactor. The crystal structure of E. coli DHFR is shown in Figure 1 with its native fluorophore tryptophans highlighted. DHFR has three flexible loops: the Met20 loop, the FG loop, and the GH loop. The Met20 loop is known for its distinct conformational changes during the reaction. In reactant-like states, such as the holoenzyme (DHFR·NADPH) and the Michaelis complex (DHFR·NADPH·DHF), the Met20 loop exists in the “closed” state where it closes over the active site. The closed conformation seals the active site from solvent and assists the positioning of the nicotinamide ring through hydrogen bonding interactions.20 The product-bound states (DHFR·NADP+·THF, DHFR·THF, and DHFR·NADPH· THF) exist in the “occluded” conformation, where the Met20 loop protrudes into the active site, preventing the nicotinamide ring of the cofactor from accessing the active site.20
Figure 1.
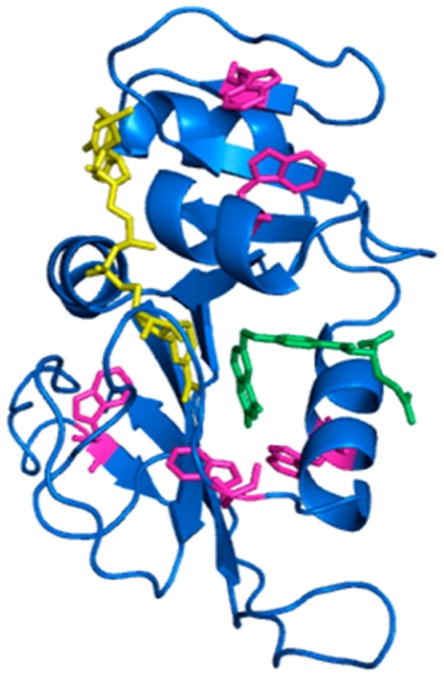
Crystal structure of E. coli DHFR (blue) in complex with the cofactor NADP+ (yellow) and the substrate folate (green). The five native tryptophans are colored pink (PDB entry 1RX2).
Protein crystallography, NMR, hydrogen–deuterium exchange, ultraviolet photodissociation, and molecular dynamics studies have provided useful insights into the regions of flexibility in DHFR and how that flexibility changes depending on which ligands are bound and which enzyme variants are studied.3,21–30 While these studies combine to improve the understanding of DHFR catalysis, these techniques are limited to equilibrium fluctuations. They are not capable of directly observing the coupling of motion to the catalytic cycle. There are two main challenges associated with solving this problem. The first is how to initiate the catalytic cycle on a time scale that is fast enough to observe all of the relevant steps and associated protein motions. The second challenge is that critical fast steps can be “hidden” by a slower step, such as substrate diffusion. However, laser-induced temperature-jump spectroscopy is able to overcome both of these obstacles.
Temperature-jump spectroscopy is a relaxation method that uses a laser pulse to rapidly heat the system. Relaxation methods measure the response to a shift in equilibrium of a reversible reaction caused by some environmental change such as temperature. The observed relaxation rates are actually a complex combination of all of the microscopic rate constants involved in reestablishing the equilibrium. An important consequence of this complexity is that even though a rise in temperature shifts the equilibrium toward one side of the reaction, the relaxation data include information about rate constants for both forward and reverse processes.31,32 Thus, while it is clear that an increase in temperature shifts the cofactor and substrate binding equilibria of DHFR toward the unbound state (this is certain on the basis of the thermodynamics determined from ITC data), the relaxation kinetics cannot be interpreted solely in terms of ligand release but have some contribution from the binding kinetics. Additionally, the temperature-jump method allows for observation of any related protein conformational changes. Herein, we examine ligand binding pathways of three complexes, DHFR·folate, DHFR·NADP+, and DHFR·NADP+·folate, which are models for the binary product complex, the holoenzyme, and the Michaelis complex, respectively.20 We observe two kinetic events in the temperature-jump transients of each of the three complexes. A simple model is applied to analyze the transients that includes a reversible ligand binding step followed by a protein conformational change, as is implied by crystallographic studies.20 By analyzing the correlation between the rates of these events and ligand concentration, we are able to determine that this model does not fit the data and that these rates represent two unrelated reaction pathways. This study highlights the need for kinetic studies of enzyme systems that directly establish the relationships between dynamics and the catalytic cycle instead of inferring dynamics from equilibrium studies.
Experimental Procedures
Protein Expression and Purification
The C-terminal six-histidine-tagged E. coli DHFR was cloned and expressed in E. coli strain BL21(DE3) with Luria-Bertani (LB) medium containing 100 μg/mL ampicillin. A single ampicillin-resistant colony was picked and inoculated into 20 mL of LB medium at 30 °C overnight. This starter culture of 1 mL was then inoculated into 1000 mL of LB medium, and the bacteria were allowed to grow until the OD600 reached 0.6–0.8 at 37 °C. Next, isopropyl β-d-thiogalactopyranoside (IPTG) was added to a final concentration of 1 mM, and the culture was allowed to grow overnight at 30 °C on a shaking incubator at 200 rpm. The bacteria were harvested by centrifugation at 5000g for 15 min at 4 °C and stored at −80 °C.
The pellets of bacteria were thawed and resuspended in 50 mM Tris, 150 mM NaCl, 5 mM β-mercaptoethanol (pH 8.0), 1 tablet of protease inhibitor/50 mL of cell lysis buffer, and 1 mg/mL lysosome, stirred on ice for 1 h, and finally sonicated on ice (Sonic Dissemble model 500, Fisher Scientific, Pittsburgh, PA). Insoluble debris was removed by centrifugation at 13000 rpm for 30 min at 4 °C. The supernatant was further filtered through a 0.22 μm filter and applied to a HisPrep affinity column on an AKTA FPLC system (GE Healthcare, Pittsburgh, PA). The column was equilibrated with 50 mM Tris-HCl, 150 mM NaCl, 10 mM imidazole, and 5 mM β-mercaptoethanol (pH 8.0). The DHFR protein was eluted through a gradient to 25% elution buffer [50 mM Tris-HCl, 150 mM NaCl, 500 mM imidazole, and 5 mM β-mercaptoethanol (pH 8.0)] over 15 column volumes. The eluted protein was pooled and concentrated using an Amicon concentrator with a 10000 Da molecular weight cutoff (Millipore, Billerica, MA). The concentrated DHFR was exchanged into 50 mM sodium phosphate, 100 mM NaCl, 5 mM DTT, and 5% glycerol (pH 7.0) using a HiPrep Desalting column (GE Healthcare). Protein purity was determined by sodium dodecyl sulfate–polyacrylamide gel electrophoresis followed by staining with Coomassie blue.
Equilibrium Fluorescence
Fluorescence measurements were taken with a Horiba (Kyoto, Japan) Dual-Fl fluorometer of four complexes: apoenzyme, DHFR·folate, DHFR·NADP+, and DHFR·NADP+·folate. In all samples, the DHFR concentration was 3 μM. In the binary complexes, the folate and NADP+ concentrations were 6 μM. In the tertiary complex, the folate concentration was 6 μM and the NADP+ concentration was 300 μM. The buffer used is the same as for the temperature-jump experiments [50 mM sodium phosphate and 100 mM NaCl (pH 7)]. The data collection parameters were as follows: 1.16 nm resolution, fixed 5 nm slits, a CCD gain setting of “medium”, an integration time of 0.5 s, average of five scans, and an excitation wavelength of 280 nm. Temperature-dependent spectra were recorded from 12 to 60 °C in 3 °C increments. To determine the temperature-dependent trends of each complex, the tryptophan fluorescence was integrated from 327 to 353 nm, normalized to 1 at the lowest temperature, and then corrected for tryptophan's temperature-dependent quantum yield by subtracting the normalized integrated fluorescence of 3 μM tryptophan.
Temperature-Jump Kinetic Methods
Fluorescence temperature-jump relaxation experiments were conducted on a custom-built instrument. A similar instrument has been described previously;33 the major difference here is the source of the heating pulse. The temperature-jump pump pulse is created by a Q-switched, Tm:fiber-pumped Ho:YAG laser, run at 50 Hz to create a 7 mJ, ∼10 ns pulse of 1908 nm light (AQS-Ho-YAG, IPG Phototonics Corp., Oxford, MA). The repetition rate of these pulses is further reduced to 12.5 Hz by an optical chopper (Thorlabs, Newton, NJ). The probing method is tryptophan emission excited around 280 nm. The excitation source is the quasi-continuous frequency-tripled output of a Mira 900 Ti:sapphire laser (845 nm) pumped by a Verdi V12 DPSS high-power laser (Coherent, Santa Clara, CA). The sample emission is focused through an appropriate bandpass filter (Semrock, Rochester, NY) before being measured on a Hamamatsu R7518 photomultiplier tube (Hamamatsu Photonics K. K., Hamamatsu, Japan). The signal is collected, digitized, and averaged (2000 shots) using a Teledyne LeCroy (Chestnut Ridge, NY) Wavesurfer 62Xs-B oscilloscope. Data collection is managed by an in-house routine using the LabVIEW computer program (National Instruments, Austin, TX). The sample thickness is 250 μm. To maintain an even transmittance of the pump pulse through this spacer thickness, the pump beam is split using a 50/50 beamsplitter (Thorlabs) and oriented to heat the sample from both sides. The temperature change in all of our samples shown here is from 29 to 36 °C. The initial temperature of the sample is maintained by contact with the sample stage that is temperature-controlled by a recirculating water bath.
All of the temperature-jump experiments described utilized a sample containing 100 μM DHFR and appropriate ligand in a 50 mM sodium phosphate and 100 mM NaCl D2O buffer at pD 7 (uncorrected pH meter reading). The ligand concentrations were varied from 100 to 200 μM to determine the concentration dependence of the observed rates. The DHFR· NADP+·folate samples contained an excess of NADP+ to favor cofactor binding and encourage release of substrate from the ternary complex during the temperature jump. DHFR·NADP+· folate has been used previously as a mimic for the Michaelis complex of the enzyme.20 The rebinding of folate to the oxidized cofactor-bound complex allows us to examine the pathway of binding of substrate to the holoenzyme present in the natural DHFR reaction cycle.
The observed temperature-jump transients include two types of responses to the heating pulse: the sample reequilibration after heating and the intrinsic fluorescence change of the fluorophore tryptophan due to temperature change. The intrinsic fluorescence change does not report on conformational dynamics and, thus, needs to be removed from the data. To do so, in addition to each sample DHFR transient we acquired, we also acquired a temperature-jump transient from a reference sample of approximately 200 μM tryptophan (Sigma-Aldrich, St. Louis, MO) under the same conditions. This reference transient shows a significant change in fluorescence due to the heating but of a magnitude different from that of the protein samples. We removed any offset difference between the reference and sample by shifting the data so that the early time signal was set to 0. Then, we numerically scaled the reference transient data so that the magnitude of the response to heating was the same as that of the protein sample, and we then subtracted the scaled reference transient from the protein sample transient. This procedure had the effect of removing the contribution to the observed signal from the change in intrinsic tryptophan fluorescence due to heating. To regain a useful scale for comparison, we then shifted the corrected sample transient back to its previous magnitude and normalized the transient to 100 by dividing the entire transient by its initial intensity. These normalized transients are presented as our results.
Results and Discussion
Equilibrium Fluorescence
The tryptophan fluorescence was characterized for four different complexes: apoenzyme, DHFR·folate, DHFR·NADP+, and DHFR·NADP+·folate. We chose DHFR·NADP+ to represent the holoenzyme complex over the usual choice of DHFR·NADPH for three reasons. First, to use the same cofactor to study both the binary and ternary complexes it was necessary to use NADP+ because the DHFR·NADPH·folate complex reacts slowly and is therefore not stable during the course of the experiment.34 Second, we hoped to take advantage of the enhanced structural flexibility of DHFR·NADP+ complexes to observe more ligand-related conformational changes. Third, we wanted to minimize additional spectroscopic interactions, such as Förster resonance energy transfer from tryptophan to NADPH, from complicating our interpretation. Although this last point is not an insurmountable problem and might even lead to interesting observations, this study focused on the intrinsic tryptophan fluorescence because it is a probe that does not alter the protein activity and can be examined throughout the entire catalytic reaction.
Upon comparison of relative fluorescence intensities (Figure 2), there is very little difference between the apoenzyme and DHFR·NADP+ complex. When folate binds to the apoenzyme, however, there is a significant drop in fluorescence, likely due to the transfer of energy from tryptophan to folate. The fluorescence drops further with the binding of NADP+ to form the tertiary complex. Because the fluorescence does not change much upon binding NADP+, the reduction of fluorescence between DHFR·folate and the tertiary complex can be explained by the different conformation of the enzyme in these two complexes. DHFR·folate is in the occluded conformation, whereas DHFR·NADP+·folate is in the closed conformation as determined by crystallography studies.20
Figure 2.
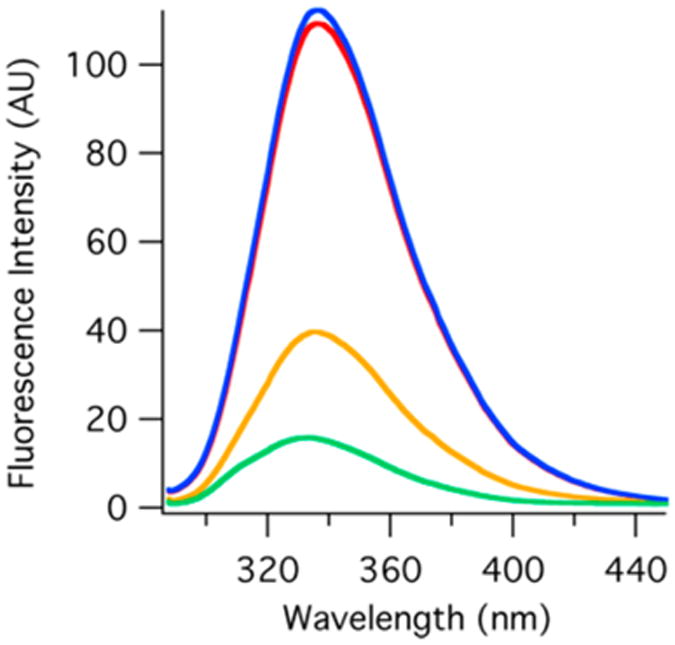
Relative equilibrium tryptophan fluorescence (excitation at 280 nm) of the DHFR apoenzyme (red), DHFR·folate (yellow), DHFR·NADP+ (blue), and DHFR·NADP+·folate (green). These spectra were recorded at 20 °C with 3 μM enzyme.
The difference fluorescence spectra of all four complexes were also obtained over a range of temperatures (Figure 3). In all four complexes, the fluorescence increases as temperature increases. The fluorescence of the two folate complexes increases dramatically with increasing temperature as compared to that of the apoenzyme or the binary complex with NADP+. This is unsurprising considering that as the temperature increases, the binding affinity decreases, which causes folate to dissociate from the enzyme. Defining a melting temperature for the complexes is not straightforward because DHFR unfolding may include more than two states.35–37 The addition of ligands to the protein will likely complicate the unfolding mechanism even more. Therefore, we simply note that the fluorescence response to heating for the apoenzyme and its complexes is consistent with ligand dissociation and this process becomes convolved with unfolding of DHFR above 50 °C.35
Figure 3.
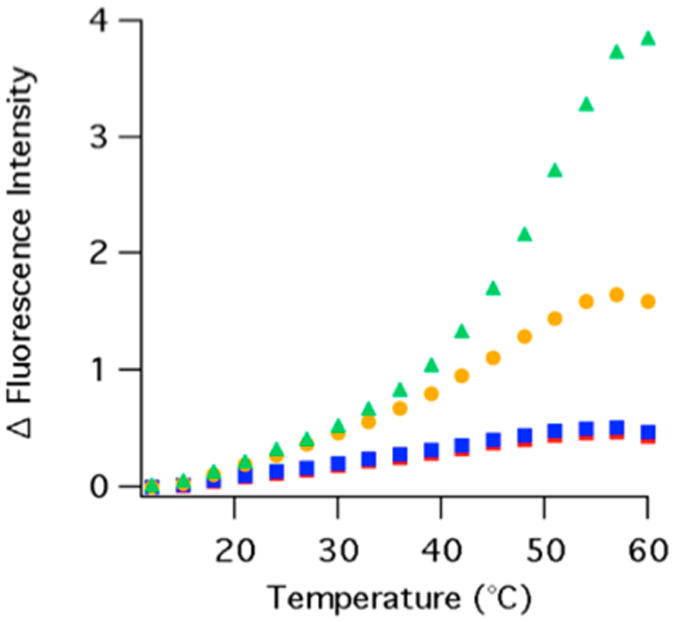
Difference temperature-dependent equilibrium fluorescence (excitation at 280 nm) of the DHFR apoenzyme (red diamonds), DHFR·NADP+ (blue squares), DHFR·folate (yellow circles), and DHFR·NADP+·folate (green triangles) from 12 to 60 °C. The tryptophan emission intensity (∼340 nm peak maximum) is integrated from 327 to 353 nm. The integrated peak areas are normalized to 1 by the integrated peak area at the lowest temperature studied and corrected for the temperature-dependent quantum yield by subtracting the normalized fluorescence of free tryptophan.
Temperature-Jump Kinetics
Temperature-jump transients of two binary complexes and one tertiary complex were collected with several ligand concentrations (Figure 4). The observation time window is from 10 μs to 5 ms. Our temperature-jump system can resolve transients with rise times as short as 10 ns, but we found no significant signals at time scales faster than 10 μs and therefore limited the range to maximize the signal-to-noise ratio. All three complexes show a substantial increase in fluorescence in response to a temperature jump from 29 to 36 °C. The increase in fluorescence is consistent with a net dissociation of the substrate at the higher temperature, as seen in Figure 3. Interpreting the signal change as dissociation of the ligand due to an increase in temperature is also consistent with the exothermic nature of binding of a ligand to DHFR (Table S1). It is important to note that while ligand dissociation is the direction of the overall change in the equilibrium, the relaxation kinetics of establishing the new equilibrium includes contributions from both the ligand binding and dissociation processes.
Figure 4.
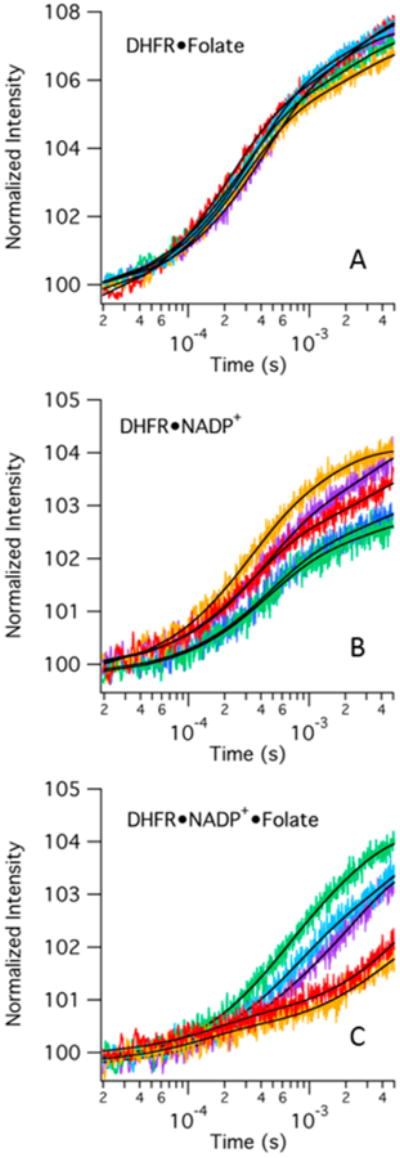
Representative fluorescence temperature-jump transients of three DHFR complexes for a jump from 29 to 36 °C. Tryptophan fluorescence is excited at 280 nm and integrated from 327 to 353 nm. Colors refer to either folate or NADP+ concentrations: purple for 100 μM, blue for 125 μM, green for 150 μM, orange for 175 μM, and red for 200 μM: (A) 100 μM DHFR with varying folate concentrations, (B) 100 μM DHFR with varying NADP+ concentrations, and (C) 100 μM DHFR and 1000 μM NADP+ with varying folate concentrations. The black lines indicate the lines of best fit for each transient when fit to a double-exponential curve.
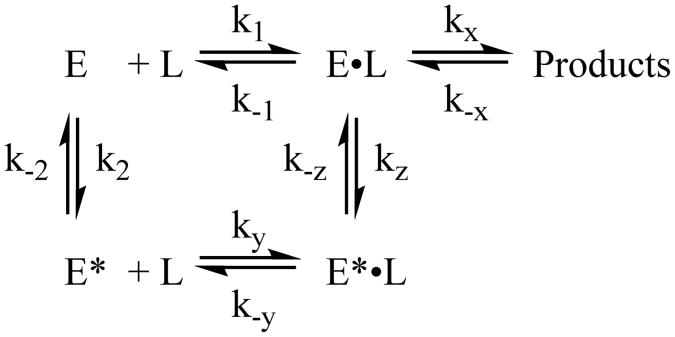
With each complex, we observe two events in the temperature-jump transients. There is a faster event with an observed relaxation rate around 2000–4000 s−1 and a slower event with an observed relaxation rate around 300–400 s−1 (see Table 1 for example fits at one concentration and Table S2 for average data for all concentrations studied). Typical models of DHFR catalysis include loop movement, or more generally conformational rearrangement, as ligands react or bind and dissociate throughout the reaction cycle.20,38 Therefore, we first postulated the most likely model for understanding the two observed events in our relaxation transients consisted of sequential ligand binding and conformational rearrangement steps. Scheme 1 summarizes this model with E indicating a generic enzyme state (i.e., apoenzyme or binary complex with NADP+) and L indicating a ligand. Scheme 1 also introduces the nomenclature of E* to refer to the enzyme complex before and after its substrate binding-induced conformational change, without implying a specific loop motion.
Table 1. Example Fit Relaxation Rates and Amplitudes for Temperature-Jump Data.
| DHFR·folatea | DHFR·NADP+a | DHFR·NADP+·folateb | DHFR apoenzyme | |
|---|---|---|---|---|
| slow rate (s−1) | 400 ± 70 | 300 ± 100 | 400 ± 100 | 240 ± 40 |
| slow rate amplitude | 2.7 ± 0.3 | 1.2 ± 0.2 | 2.4 ± 0.2 | 2.3 ± 0.5 |
| fast rate (s−1) | 3800 ± 200 | 2500 ± 91 | 2200 ± 500 | 5000 ± 1000 |
| fast rate amplitude | 4.9 ± 0.5 | 2.0 ± 0.2 | 1.8 ± 0.5 | 0.6 ± 0.08 |
Reported values are the average of the data taken at 100 μM DHFR and 150 μM ligand.
Reported values are the average of the data taken at 100 μM DHFR, 1000 μM NADP+, and 150 μM folate.
Scheme 1.
The relationship between the observed relaxation rates and the microscopic rate constants for a kinetic model like Scheme 1 that includes sequential bimolecular and unimolecular transformations has been previously solved with the assumption that the perturbation is small, a <5% change in equilibrium concentration.32 The 7 °C temperature jump herein induces a change in the equilibrium concentration of <5%. In such cases, the microscopic rate constants can be determined by plotting the sum of the relaxation rates versus the sum of the free concentrations of E and L and plotting the product of the relaxation rates versus the sum of the free concentrations of E and L. The free concentrations indicated are those of the final temperature of the temperature jump. If the data fit this proposed model, each plot should yield a linear relationship. Equations 1–4 display the predicted relationship between the linear fit parameters from these plots and the rate constants in Scheme 1, where ms and bs are the slope and intercept of the plot of the sum of rates, respectively, and mp and bp are the slope and intercept of the product of the rates, respectively.
| (1) |
| (2) |
| (3) |
| (4) |
We tested the applicability of the model in Scheme 1 to our data by making the necessary plots (Figure S3). We solved for the free enzyme and ligand concentrations using thermodynamic equilibrium constants (Table S1) determined previously by isothermal titration calorimetry (ITC) for the interaction of DHFR with folate and DHFR with NADP+.39 We were unable to find the necessary equilibrium constants for the binding of folate to DHFR·NADP+ in the literature; therefore, we determined this value ourselves using ITC (Figure S2 and Table S1).
Upon analyzing the data, we found the model to be inadequate for describing our results. This is most clearly evident from the analysis by the estimation of one negative rate constant for each of the three protein complexes studied (Table S3). As long as the second relaxation phase represents a unimolecular process following the bimolecular event, then the analysis should be valid, even in the extreme case of one the reactions occurring much faster than the other; however, a negative value for a reaction rate is nonsensical and implies our model is incorrect.32 Both the DHFR·folate and the DHFR· NADP+·folate complexes have a predicted negative value for k2; the DHFR·NADP+ complex has a predicted negative value for k−2. Because the negative value was found in the second reaction in all three cases, which would be dominated by the slower relaxation rate, we hypothesized the error in the model had to do with our interpretation of the slower relaxation event.
We can learn more about the nature of each of the observed relaxation events by looking at their concentration dependence. If a relaxation rate is representative of a reaction that is a bimolecular reaction or coupled to a bimolecular reaction, then the relaxation rate should have a positive linear correlation with the sum of the free concentrations of the bimolecular step.32 If the fast and slow processes are sequential steps as postulated, we would expect to find some correlation between the sum of the free enzyme and ligand concentrations for both kinetic phases. In addition to the model presented in Scheme 1, if we consider the alternative model of the conformational change preceding the binding event, as has been proposed by NMR studies,19 the stepwise nature of the reaction would still induce a dependence on concentration for both steps, because they are coupled.32 Figure 5 shows the correlation plots for both the fast and slow relaxation rates versus the sum of the free concentrations for all three DHFR complexes studied.
Figure 5.
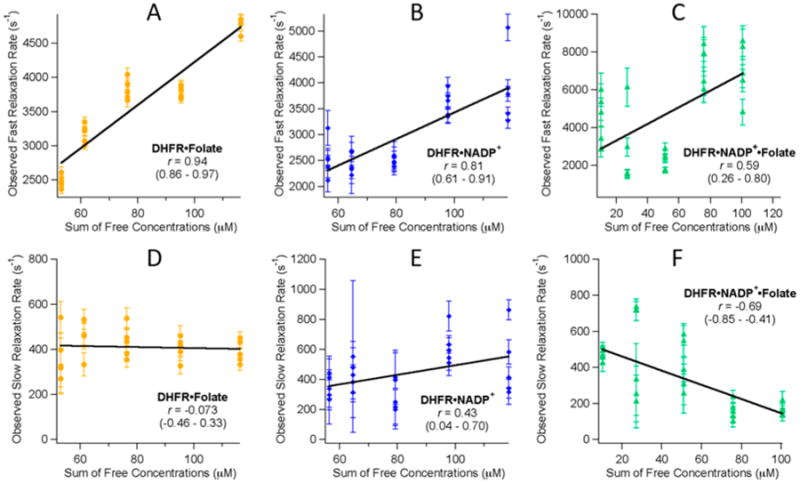
Correlation plots detailing the linear correlation of the observed temperature-jump relaxation rates vs the sum of the free concentrations of enzyme and ligand. Plots A–C show the correlation of the observed faster relaxation rate. Plots D–F show the correlation of the observed slower relaxation rates. The linear correlation coefficient, r, is given in each plot along with the 95% confidence interval for each correlation coefficient given in parentheses.
The correlation plots in Figure 5 reveal that all of the fast relaxation rates show a positive correlation with the sum of the free concentrations. The slow rates show a mixture of correlations where the folate binary complex seems to have no correlation, the NADP+ binary complex has a positive correlation, and the tertiary complex has a negative correlation. The strength of the correlation is quantitatively represented by Pearson's product moment correlation coefficient, also known as the linear correlation coefficient r. r ranges from −1.0 to +1.0 and can be tested for significance at a given probability level. The correlation coefficient cutoff value for significance at a 99% confidence level for this data is 0.505 (DF = 23). This means that any r value whose absolute value is above 0.505 displays a significant correlation under this relatively strict standard.40 The fast relaxation rates of all three complexes show a significant quantitative positive correlation. The entire 95% confidence interval of both of the binary plots meets this significance standard, while the tertiary complex's range does not. This is a strong indication that the faster event is either a bimolecular reaction step or is strongly coupled to one. For the slow rates, only the tertiary complex shows a significant correlation; however, because this r value is negative, it indicates a negative correlation between the relaxation rate and the sum of the free concentrations. A negative correlation is nonsensical and is equivalent to concluding the rates do not depend on the free concentrations of enzymes and ligand. The correlation analysis gives us more evidence that the fast rate is related to ligand binding and that the slow rate is not. Thus, a kinetic model having sequential ligand binding and conformational rearrangement steps is not consistent with this analysis, regardless of the order of the steps.
While the fast relaxation event can be ascribed to the reversible ligand binding process, the molecular origin of the slow relaxation rate is not clear. Our probe method for this study is intrinsic tryptophan fluorescence. The fluorescence intensity can be altered by several mechanisms such as quenching interactions specific to enzyme conformation, interactions with the substrate, solvent accessibility, and coupling between tryptophans. Additionally, DHFR has five native tryptophans that are spread throughout the enzyme's structure (Figure 1). This makes it hard to use this fluorophore to determine the origin of the observed signal change. One possible interpretation of a nonligand binding reaction pathway could be heat-induced protein conformational change. The temperature-jump technique does not necessarily induce a reaction along a reaction cycle-like pathway. Because an increase in temperature favors protein motion, the temperature-jump pulse could be altering the conformational space of the protein in addition to perturbing the ligand binding equilibrium. The heat-induced conformational change is likely not related to protein unfolding because the final temperature of the temperature jump was 36 °C for all transients compared to the apoenzyme melting temperature of 49.3 °C.36 Because the binding of substrates tends to increase the thermal stability of the protein, the final temperature jump is even further below the melting temperatures of the protein complexes.43 We can examine whether the slow event in the transients is related to a noncatalytic protein conformational change by comparison to the temperature-jump transient of the apoenzyme under similar conditions. Figure 6 shows the results of a temperature jump on the DHFR apoenzyme.
Figure 6.
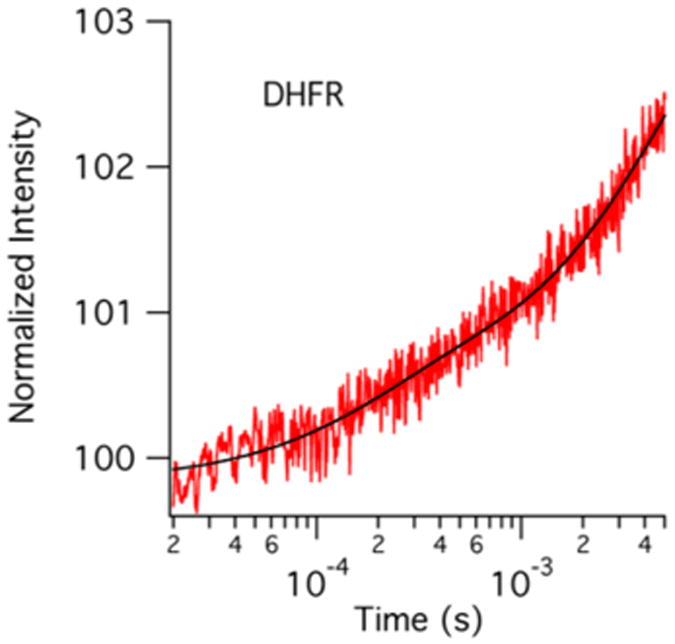
Fluorescence temperature-jump transient of the DHFR apoenzyme. The protein concentration is 100 μM, and the temperature jump is from 29 to 36 °C. These conditions mimic those of the enzyme complex transients shown in Figure 4.
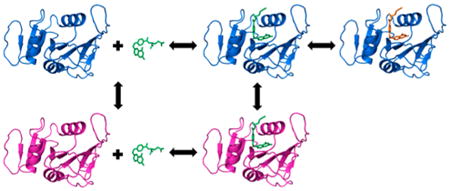
As can be seen by comparing Figures 4 and 6, the temperature-jump transient of the DHFR apoenzyme is distinct from the transients for the DHFR complexes with respect to both the amplitude and the lifetimes observed. The apoenzyme transient is best fit by a double-exponential curve with a fast rate of 5000 s−1 and a slow rate of 200 s−1 compared to the rates of 2000–4000 and 300–400 s−1 from the enzyme complexes. The temperature jump induces a smaller change in the fluorescence signal in the apoenzyme than in the enzyme complexes. The fast event from the enzyme complex transients has an amplitude change greater than or equal to that of the slower event, further supporting its assignment to ligand binding and dissociation. Conversely, the slower event is the dominant event in the apoenzyme transient. Interestingly, the slower event has a similar amplitude, approximately 2% of the initial intensity, in all four enzyme complexes studied (see Table 1 and Table S2). It therefore seems reasonable to assign the slow event in all of the transients to a similar molecular event. The rate of the slower relaxation event depends on the presence and identity of a ligand bound to the enzyme. We therefore conclude that the observed slower event is due primarily to a conformational rearrangement unrelated to progress along the reaction coordinate as shown in Scheme 2.
Scheme 2.
Because the fast rate is related to the ligand binding step and also not directly coupled to the slow rate, we can estimate the rate constants for binding and dissociation of the ligands using a simple two-state model. A linear fit to a plot of the fast rates versus the sum of the free concentrations of enzyme and ligand yields these rate constants. The slope of the line is equivalent to the binding rate constant (kon), and the y-intercept is equivalent to the dissociation rate constant (koff).32 These plots have already been presented in Figure 5A–C. We present the slopes and y-intercepts as these rate constants in Table 2. The values we obtain from this analysis for kon of the two binary complexes is similar to what has been reported in the literature previously (57 ± 5 μM−1 s−1 for DHFR·folate34 and 13 μM−1 s−1 for DHFR·NADP+41). We are not aware of a similar measurement for the ternary complex studied here; however, the value of kon for the normal substrate dihydrofolate binding to the holoenzyme complex is reported as 5 μM−1 s−1.41 The order of magnitude difference here might be explained by the difference in cofactor oxidation state and substrate. The koff values are more surprising. koff values for substrates of DHFR have been calculated to be in the range of 1–70 s−1, with the exception being NADP+ having a koff value of 200–300 s−1.34,41,42 We observe significantly faster values for koff. This difference may be due to the higher time resolution of the temperature-jump measurement, because previous experiments have relied on stopped-flow mixing and may have been limited by the dead time of the measurement. It may also be due to the model, because it approximates the fast kinetic phase as a two-state reversible binding event. However, the substrate binding/ dissociation relaxation kinetics is convolved with an additional, unresolved loop motion step, which probably affects the observed rate. Additional evidence of this interpretation is the higher koff determined for the ternary complex, for which the Met20 loop motion should have the greatest contribution to the observed relaxation rate. The inability to resolve the loop motion step is not due to the temporal resolution of the temperature-jump experiment but instead is likely due to the insensitivity of the Trp fluorescence to loop conformation. A more specific fluorescence probe would aid in sorting out this interesting observation.
Table 2. Rate Constants for Ligand Binding and Dissociation Determined from Temperature-Jump Measurements.
| DHFR·folate | DHFR·NADP+ | DHFR·NADP+·folate | |
|---|---|---|---|
| kon (μM−1 s−1) | 31 ± 2 | 26 ± 4 | 40 ± 10 |
| koff (s−1) | 1100 ± 200 | 900 ± 300 | 2400 ± 800 |
This work was motivated by the question of how conformational rearrangements of DHFR are linked to ligand binding and dissociation. The apoenzyme and the three different enzyme–ligand complexes chosen for this study represent different parts of the DHFR reaction cycle, having different loop conformations. Using time-resolved fluorescence temperature-jump spectroscopy, we observed two relaxation events. Upon analyzing the fast relaxation rate, we determine that there is likely an additional conformational change that is coupled to ligand association and dissociation. However, a more direct method for probing protein dynamics with specificity that is better than that of intrinsic tryptophan fluorescence will be required to separate the loop motion dynamics from the ligand binding event, to more fully understand the nature of conformational changes in DHFR. For example, the loop conformations could be probed using the reduced cofactor absorbance or fluorescence or by one of the site-specific labeled DHFR variants that have been reported in the literature but have not been applied to kinetics on this time scale.44–47
The slow off-pathway conformational rearrangement can be interpreted as evidence of conformational selection as a mechanism for ligand binding. The millisecond conformational fluctuations observed using Trp fluorescence are not coupled to the binding event as would be expected for an induced fit model of ligand binding. The presence of the slow event regardless of ligand state suggests that it corresponds to fluctuations of the protein that would be necessary for the conformational search process. Finally, the dependence of the rate of the slow event on the ligand identity is consistent with a ligand-dependent population shift to a favored conformation, consistent with previous NMR results.38
Direct evidence of how loop motions couple to steps along the reaction pathway remains elusive. Our data suggest that there is a conformational rearrangement coupled to the ligand binding steps, but additional kinetic studies are necessary with site-specific probes to confirm these findings. Numerous studies of DHFR mutants or ligand complexes have compared equilibrium structures and their fluctuations using X-ray crystallography, NMR spectroscopy, and molecular dynamics simulations. While these studies are important because they serve to indicate regions of the structure where motions likely play a role in catalysis, they do not directly establish the connection between specific protein motions and progress along the reaction coordinate. We believe the emphasis placed on the conformational flexibility of key loops in DHFR by these studies is key for understanding the role of enzyme dynamics in DHFR catalysis; however, our data indicate that not all observed motions are due to an effect on the reaction pathway. Thus, our results serve as an additional caution that claims about DHFR flexibility and catalysis need to be supported by direct observation of coupling between specific protein motions and progress along the reaction pathway.
Supplementary Material
Acknowledgments
Funding: This work was supported by National Institutes of Health Grant GM068036 (R.B.D.) and by National Science Foundation Graduate Fellowship DGE-0940903 (M.J.R.).
Abbreviations
- DHFR
dihydrofolate reductase
- NADPH
reduced nicotinamide adenine dinucleotide phosphate
- NADP+
oxidized nicotinamide adenine dinucleotide phosphate
- DHF
dihydrofolate
- THF
tetrahydrofolate
- DF
degrees of freedom
- PDB
Protein Data Bank
Footnotes
ITC data used for equilibrium constant determination of the DHFR·NADP+ + folate reaction and temperature-jump transients analyzed as the sum and product of the observed relaxation rates versus the sum of the free concentrations (PDF)
Notes: The authors declare no competing financial interest.
Supporting Information: The Supporting Information is available free of charge on the ACS Publications website at DOI: 10.1021/acs.bio-chem.5b01364.
References
- 1.Gulotta M, Deng H, Deng H, Dyer RB, Callender RH. Toward an Understanding of the Role of Dynamics on Enzymatic Catalysis in Lactate Dehydrogenase. Biochemistry. 2002;41:3353–3363. doi: 10.1021/bi016009a. [DOI] [PubMed] [Google Scholar]
- 2.Callender R, Dyer RB. The Dynamical Nature of Enzymatic Catalysis. Acc Chem Res. 2015;48:407–413. doi: 10.1021/ar5002928. [DOI] [PMC free article] [PubMed] [Google Scholar]
- 3.Bhabha G, Lee J, Ekiert DC, Gam J, Wilson IA, Dyson HJ, Benkovic SJ, Wright PE. A Dynamic Knockout Reveals That Conformational Fluctuations Influence the Chemical Step of Enzyme Catalysis. Science. 2011;332:234–238. doi: 10.1126/science.1198542. [DOI] [PMC free article] [PubMed] [Google Scholar]
- 4.Cameron CE, Benkovic SJ. Evidence for a Functional Role of the Dynamics of Glycine-121 of Escherichia Coli Dihydrofolate Reductase Obtained from Kinetic Analysis of a Site-Directed Mutant. Biochemistry. 1997;36:15792–15800. doi: 10.1021/bi9716231. [DOI] [PubMed] [Google Scholar]
- 5.Arora K, Brooks CL. Multiple Intermediates, Diverse Conformations, and Cooperative Conformational Changes Underlie the Catalytic Hydride Transfer Reaction of Dihydrofolate Reductase. In: Klinman J, Hammes-Schiffer S, editors. Dynamics in Enzyme Catalysis. Springer; New York: 2013. pp. 165–187. [DOI] [PMC free article] [PubMed] [Google Scholar]
- 6.Benkovic SJ, Hammes-Schiffer S. A Perspective on Enzyme Catalysis. Science. 2003;301:1196–1202. doi: 10.1126/science.1085515. [DOI] [PubMed] [Google Scholar]
- 7.Oyen D, Fenwick RB, Stanfield RL, Dyson HJ, Wright PE. Cofactor-Mediated Conformational Dynamics Promote Product Release from Escherichia Coli Dihydrofolate Reductase Via an Allosteric Pathway. J Am Chem Soc. 2015;137:9459–9468. doi: 10.1021/jacs.5b05707. [DOI] [PMC free article] [PubMed] [Google Scholar]
- 8.Klinman JP. An Integrated Model for Enzyme Catalysis Emerges from Studies of Hydrogen Tunneling. Chem Phys Lett. 2009;471:179–193. doi: 10.1016/j.cplett.2009.01.038. [DOI] [PMC free article] [PubMed] [Google Scholar]
- 9.Klinman JP, Kohen A. Hydrogen Tunneling LinksProtein Dynamics to Enzyme Catalysis. Annu Rev Biochem. 2013;82:471–496. doi: 10.1146/annurev-biochem-051710-133623. [DOI] [PMC free article] [PubMed] [Google Scholar]
- 10.Hammes-Schiffer S, Benkovic SJ. Relating Protein Motion to Catalysis. Annu Rev Biochem. 2006;75:519–541. doi: 10.1146/annurev.biochem.75.103004.142800. [DOI] [PubMed] [Google Scholar]
- 11.Rajagopalan PT, Benkovic SJ. Preorganization and Protein Dynamics in Enzyme Catalysis. Chem Rec. 2002;2:24–36. doi: 10.1002/tcr.10009. [DOI] [PubMed] [Google Scholar]
- 12.Reddish MJ, Peng HL, Deng H, Panwar KS, Callender R, Dyer RB. Direct Evidence of Catalytic Heterogeneity in Lactate Dehydrogenase by Temperature Jump Infrared Spectroscopy. J Phys Chem B. 2014;118:10854–10862. doi: 10.1021/jp5050546. [DOI] [PMC free article] [PubMed] [Google Scholar]
- 13.Pushie MJ, George GN. Active-Site Dynamics and Large-Scale Domain Motions of Sulfite Oxidase: A Molecular Dynamics Study. J Phys Chem B. 2010;114:3266–3275. doi: 10.1021/jp908731f. [DOI] [PubMed] [Google Scholar]
- 14.Bandaria JN, Dutta S, Nydegger MW, Rock W, Kohen A, Cheatum CM. Characterizing the Dynamics of Functionally Relevant Complexes of Formate Dehydrogenase. Proc Natl Acad Sci U S A. 2010;107:17974–17979. doi: 10.1073/pnas.0912190107. [DOI] [PMC free article] [PubMed] [Google Scholar]
- 15.Eisenmesser EZ, Bosco DA, Akke M, Kern D. Enzyme Dynamics During Catalysis. Science. 2002;295:1520–1523. doi: 10.1126/science.1066176. [DOI] [PubMed] [Google Scholar]
- 16.Eisenmesser EZ, Millet O, Labeikovsky W, Korzhnev DM, Wolf-Watz M, Bosco DA, Skalicky JJ, Kay LE, Kern D. Intrinsic Dynamics of an Enzyme Underlies Catalysis. Nature. 2005;438:117–121. doi: 10.1038/nature04105. [DOI] [PubMed] [Google Scholar]
- 17.Newby Z, Lee TT, Morse RJ, Liu Y, Liu L, Venkatraman P, Santi DV, Finer-Moore JS, Stroud RM. The Role of Protein Dynamics in Thymidylate Synthase Catalysis: Variants of Conserved 2′-Deoxyuridine 5′-Monophosphate (Dump)-Binding Tyr-261. Biochemistry. 2006;45:7415–7428. doi: 10.1021/bi060152s. [DOI] [PMC free article] [PubMed] [Google Scholar]
- 18.Liu CT, Wang L, Goodey NM, Hanoian P, Benkovic SJ. Temporally Overlapped but Uncoupled Motions in Dihydrofolate Reductase Catalysis. Biochemistry. 2013;52:5332–5334. doi: 10.1021/bi400858m. [DOI] [PMC free article] [PubMed] [Google Scholar]
- 19.Boehr DD, Nussinov R, Wright PE. The Role of Dynamic Conformational Ensembles in Biomolecular Recognition. Nat Chem Biol. 2009;5:789–796. doi: 10.1038/nchembio.232. [DOI] [PMC free article] [PubMed] [Google Scholar]
- 20.Sawaya MR, Kraut J. Loop and Subdomain Movements in the Mechanism of Escherichia Coli Dihydrofolate Reductase: Crystallographic Evidence. Biochemistry. 1997;36:586–603. doi: 10.1021/bi962337c. [DOI] [PubMed] [Google Scholar]
- 21.Boekelheide N, Salomón-Ferrer R, Miller TF. Dynamics and Dissipation in Enzyme Catalysis. Proc Natl Acad Sci U S A. 2011;108:16159–16163. doi: 10.1073/pnas.1106397108. [DOI] [PMC free article] [PubMed] [Google Scholar]
- 22.Oyeyemi OA, Sours KM, Lee T, Resing KA, Ahn NG, Klinman JP. Temperature Dependence of Protein Motions in a Thermophilic Dihydrofolate Reductase and Its Relationship to Catalytic Efficiency. Proc Natl Acad Sci U S A. 2010;107:10074–10079. doi: 10.1073/pnas.1003678107. [DOI] [PMC free article] [PubMed] [Google Scholar]
- 23.Alakent B, Baskan S, Doruker P. Effect of Ligand Binding on the Intraminimum Dynamics of Proteins. J Comput Chem. 2011;32:483–496. doi: 10.1002/jcc.21636. [DOI] [PubMed] [Google Scholar]
- 24.Fan Y, Cembran A, Ma SH, Gao JL. Connecting Protein Conformational Dynamics with Catalytic Function as Illustrated in Dihydrofolate Reductase. Biochemistry. 2013;52:2036–2049. doi: 10.1021/bi301559q. [DOI] [PMC free article] [PubMed] [Google Scholar]
- 25.Tuttle LM, Dyson HJ, Wright PE. Side-Chain Conformational Heterogeneity of Intermediates in the Escherichia Coli Dihydrofolate Reductase Catalytic Cycle. Biochemistry. 2013;52:3464–3477. doi: 10.1021/bi400322e. [DOI] [PMC free article] [PubMed] [Google Scholar]
- 26.Radkiewicz JL, Brooks CL. Protein Dynamics in Enzymatic Catalysis: Exploration of Dihydrofolate Reductase. J Am Chem Soc. 2000;122:225–231. [Google Scholar]
- 27.Cammarata MB, Thyer R, Rosenberg J, Ellington A, Brodbelt JS. Structural Characterization of Dihydrofolate Reductase Complexes by Top-Down Ultraviolet Photodissociation Mass Spectrometry. J Am Chem Soc. 2015;137:9128–9135. doi: 10.1021/jacs.5b04628. [DOI] [PubMed] [Google Scholar]
- 28.Mauldin RV, Lee AL. Nuclear Magnetic Resonance Study of the Role of M42 in the Solution Dynamics of Escherichia Coli Dihydrofolate Reductase. Biochemistry. 2010;49:1606–1615. doi: 10.1021/bi901798g. [DOI] [PMC free article] [PubMed] [Google Scholar]
- 29.Lamb KM, G-Dayanandan N, Wright DL, Anderson AC. Elucidating Features That Drive the Design of Selective Antifolates Using Crystal Structures of Human Dihydrofolate Reductase. Biochemistry. 2013;52:7318–7326. doi: 10.1021/bi400852h. [DOI] [PMC free article] [PubMed] [Google Scholar]
- 30.Feeney J, Birdsall B, Kovalevskaya NV, Smurnyy YD, Navarro Peran EM, Polshakov VI. Nmr Structures of Apo L. Casei Dihydrofolate Reductase and Its Complexes with Trimethoprim and Nadph: Contributions to Positive Cooperative Binding from Ligand-Induced Refolding, Conformational Changes, and Interligand Hydrophobic Interactions. Biochemistry. 2011;50:3609–3620. doi: 10.1021/bi200067t. [DOI] [PMC free article] [PubMed] [Google Scholar]
- 31.Callender R, Dyer RB. Advances in Time-Resolved Approaches to Characterize the Dynamical Nature of Enzymatic Catalysis. Chem Rev. 2006;106:3031–3042. doi: 10.1021/cr050284b. [DOI] [PubMed] [Google Scholar]
- 32.Bernasconi CF. Relaxation Kinetics. Academic Press; New York: 1976. [Google Scholar]
- 33.Davis CM, Dyer RB. Ww Domain Folding Complexity Revealed by Infrared Spectroscopy. Biochemistry. 2014;53:5476–5484. doi: 10.1021/bi500556h. [DOI] [PMC free article] [PubMed] [Google Scholar]
- 34.Posner BA, Li L, Bethell R, Tsuji T, Benkovic SJ. Engineering Specificity for Folate into Dihydrofolate Reductase from Escherichia Coli. Biochemistry. 1996;35:1653–1663. doi: 10.1021/bi9518095. [DOI] [PubMed] [Google Scholar]
- 35.Ohmae E, Kurumiya T, Makino S, Gekko K. Acid and Thermal Unfolding of Escherichia Coli Dihydrofolate Reductase. J Biochem. 1996;120:946–953. doi: 10.1093/oxfordjournals.jbchem.a021511. [DOI] [PubMed] [Google Scholar]
- 36.Gekko K, Yamagami K, Kunori Y, Ichihara S, Kodama M, Iwakura M. Effects of Point Mutation in a Flexible Loop on the Stability and Enzymatic Function of Escherichia Coli Dihydrofolate Reductase. J Biochem. 1993;113:74–80. doi: 10.1093/oxfordjournals.jbchem.a124007. [DOI] [PubMed] [Google Scholar]
- 37.Ionescu RM, Smith VF, O'Neil JC, Matthews CR. Multistate Equilibrium Unfolding of Escherichia Coli Dihydrofolate Reductase: Thermodynamic and Spectroscopic Description of the Native, Intermediate, and Unfolded Ensembles. Biochemistry. 2000;39:9540–9550. doi: 10.1021/bi000511y. [DOI] [PubMed] [Google Scholar]
- 38.Boehr DD, McElheny D, Dyson HJ, Wright PE. The Dynamic Energy Landscape of Dihydrofolate Reductase Catalysis. Science. 2006;313:1638–1642. doi: 10.1126/science.1130258. [DOI] [PubMed] [Google Scholar]
- 39.Grubbs J, Rahmanian S, DeLuca A, Padmashali C, Jackson M, Duff MR, Howell EE. Thermodynamics and Solvent Effects on Substrate and Cofactor Binding in Escherichia Coli Chromosomal Dihydrofolate Reductase. Biochemistry. 2011;50:3673–3685. doi: 10.1021/bi2002373. [DOI] [PubMed] [Google Scholar]
- 40.Kobayashi K. Correlation Analysis. In: Pillai KS, Ebooks C, editors. A Handbook of Applied Statistics in Pharmacology. CRC Press/Taylor Francis Group; Boca Raton, FL: 2012. pp. 67–73. [Google Scholar]
- 41.Fierke CA, Johnson KA, Benkovic SJ. Construction and Evaluation of the Kinetic Scheme Associated withDihydrofolate-Reductase from Escherichia-Coli. Biochemistry. 1987;26:4085–4092. doi: 10.1021/bi00387a052. [DOI] [PubMed] [Google Scholar]
- 42.Cayley PJ, Dunn SMJ, King RW. Kinetics of Substrate, Coenzyme, and Inhibitor Binding to Escherichia-Coli Dihydrofolate-Reductase. Biochemistry. 1981;20:874–879. doi: 10.1021/bi00507a034. [DOI] [PubMed] [Google Scholar]
- 43.Sasso S, Protasevich I, Gilli R, Makarov A, Briand C. Thermal-Denaturation of Bacterial and Bovine Dihydrofolate Reductases and Their Complexes with Nadph, Trimethoprim, and Methotrexate. J Biomol Struct Dyn. 1995;12:1023–1032. doi: 10.1080/07391102.1995.10508794. [DOI] [PubMed] [Google Scholar]
- 44.Chen S, Wang L, Fahmi NE, Benkovic SJ, Hecht SM. Two Pyrenylalanines in Dihydrofolate Reductase Form an Excimer Enabling the Study of Protein Dynamics. J Am Chem Soc. 2012;134:18883–18885. doi: 10.1021/ja307179q. [DOI] [PMC free article] [PubMed] [Google Scholar]
- 45.Chen S, Fahmi NE, Wang L, Bhattacharya C, Benkovic SJ, Hecht SM. Detection of Dihydrofolate Reductase Conformational Change by Fret Using Two Fluorescent Amino Acids. J Am Chem Soc. 2013;135:12924–12927. doi: 10.1021/ja403007r. [DOI] [PMC free article] [PubMed] [Google Scholar]
- 46.Antikainen NM, Smiley RD, Benkovic SJ, Hammes GG. Conformation Coupled Enzyme Catalysis: Single-Molecule and Transient Kinetics Investigation of Dihydrofolate Reductase. Biochemistry. 2005;44:16835–16843. doi: 10.1021/bi051378i. [DOI] [PubMed] [Google Scholar]
- 47.Liu CT, Layfield JP, Stewart RJ, French JB, Hanoian P, Asbury JB, Hammes-Schiffer S, Benkovic SJ. Probing the Electrostatics of Active Site Microenvironments Along the Catalytic Cycle for Escherichia Coli Dihydrofolate Reductase. J Am Chem Soc. 2014;136:10349–10360. doi: 10.1021/ja5038947. [DOI] [PMC free article] [PubMed] [Google Scholar]
Associated Data
This section collects any data citations, data availability statements, or supplementary materials included in this article.


