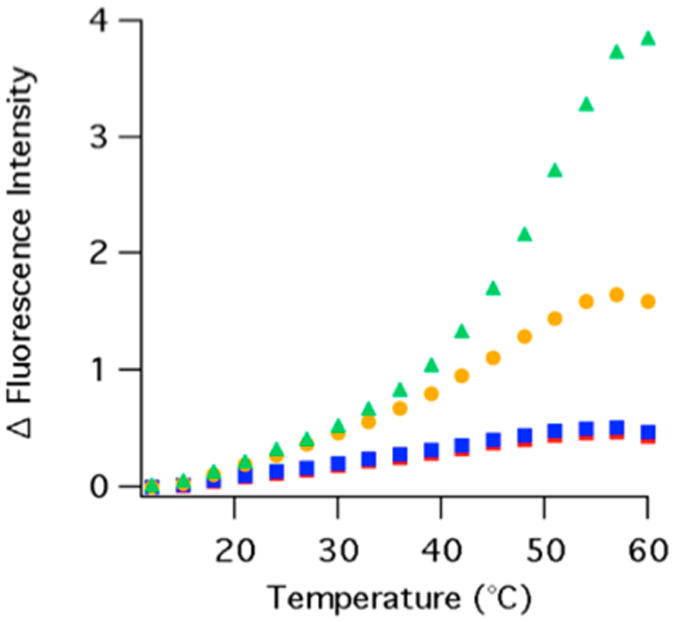
Figure 3.

Difference temperature-dependent equilibrium fluorescence (excitation at 280 nm) of the DHFR apoenzyme (red diamonds), DHFR·NADP+ (blue squares), DHFR·folate (yellow circles), and DHFR·NADP+·folate (green triangles) from 12 to 60 °C. The tryptophan emission intensity (∼340 nm peak maximum) is integrated from 327 to 353 nm. The integrated peak areas are normalized to 1 by the integrated peak area at the lowest temperature studied and corrected for the temperature-dependent quantum yield by subtracting the normalized fluorescence of free tryptophan.
