

See Sorg and Grothe (doi:10.1093/brain/awv302) for a scientific commentary on this article.
Early studies reported inconsistencies between amyloid plaque location and regional dysfunction implied by clinical course. Recent PET studies, however, highlight the overlap between amyloid deposition and regions affected early in Alzheimer’s disease. Altmann et al. report that regional hypometabolism is in fact related to cortex-wide rather than regional plaque burden.
Keywords: Alzheimer’s disease, amyloid imaging, glucose metabolism, positron emission tomography
See Sorg and Grothe (doi:10.1093/brain/awv302) for a scientific commentary on this article.
Early studies reported inconsistencies between amyloid plaque location and regional dysfunction implied by clinical course. Recent PET studies, however, highlight the overlap between amyloid deposition and regions affected early in Alzheimer’s disease. Altmann et al. report that regional hypometabolism is in fact related to cortex-wide rather than regional plaque burden.
Abstract
See Sorg and Grothe (doi:10.1093/brain/awv302) for a scientific commentary on this article.
In its original form, the amyloid cascade hypothesis of Alzheimer’s disease holds that fibrillar deposits of amyloid are an early, driving force in pathological events leading ultimately to neuronal death. Early clinicopathological investigations highlighted a number of inconsistencies leading to an updated hypothesis in which amyloid plaques give way to amyloid oligomers as the driving force in pathogenesis. Rather than focusing on the inconsistencies, amyloid imaging studies have tended to highlight the overlap between regions that show early amyloid plaque signal on positron emission tomography and that also happen to be affected early in Alzheimer’s disease. Recent imaging studies investigating the regional dependency between metabolism and amyloid plaque deposition have arrived at conflicting results, with some showing regional associations and other not. We extracted multimodal neuroimaging data from the Alzheimer’s disease neuroimaging database for 227 healthy controls and 434 subjects with mild cognitive impairment. We analysed regional patterns of amyloid deposition, regional glucose metabolism and regional atrophy using florbetapir (18F) positron emission tomography, 18F-fluordeoxyglucose positron emission tomography and T1-weighted magnetic resonance imaging, respectively. Specifically, we derived grey matter density and standardized uptake value ratios for both positron emission tomography tracers in 404 functionally defined regions of interest. We examined the relation between regional glucose metabolism and amyloid plaques using linear models. For each region of interest, correcting for regional grey matter density, age, education and disease status, we tested the association of regional glucose metabolism with (i) cortex-wide florbetapir uptake; (ii) regional (i.e. in the same region of interest) florbetapir uptake; and (iii) regional florbetapir uptake while correcting in addition for cortex-wide florbetapir uptake. P-values for each setting were Bonferroni corrected for 404 tests. Regions showing significant hypometabolism with increasing cortex-wide amyloid burden were classic Alzheimer’s disease-related regions: the medial and lateral parietal cortices. The associations between regional amyloid burden and regional metabolism were more heterogeneous: there were significant hypometabolic effects in posterior cingulate, precuneus, and parietal regions but also significant positive associations in bilateral hippocampus and entorhinal cortex. However, after correcting for global amyloid burden, few of the negative associations remained and the number of positive associations increased. Given the wide-spread distribution of amyloid plaques, if the canonical cascade hypothesis were true, we would expect wide-spread, cortical hypometabolism. Instead, cortical hypometabolism appears to be linked to global amyloid burden. Thus we conclude that regional fibrillar amyloid deposition has little to no association with regional hypometabolism.
Introduction
The amyloid cascade hypothesis of Alzheimer’s disease, in its original, unmodified form, posits that the protein amyloid-β is the starting point for a series of pathogenic changes that lead from neuronal dysfunction and synapse loss to cell death (Hardy and Allsop, 1991; Hardy and Higgins, 1992). Particular weight is given, in the unmodified version of the hypothesis, to the large fibrillar aggregates of amyloid-β known as amyloid plaques. The link between amyloid-β, in some form, and Alzheimer’s disease is unassailable. Disease-causing mutations in the three genes that lead to autosomal dominant Alzheimer’s disease have been shown to promote the formation of the putatively neurotoxic form of amyloid-β, a peptide of 42 amino acids (Suzuki et al., 1994; Scheuner et al., 1996; Gomez-Isla et al., 1999).
While amyloid-β is, irrefutably, an initiating factor in Alzheimer’s disease pathogenesis, the remainder of the amyloid cascade hypothesis is much less firmly established. Amyloid plaques are, along with tau-based neurofibrillary tangles, one of the pathological hallmarks of Alzheimer’s disease (Braak and Braak, 1991). They are large, abundant, and easily seen with basic microscopy stains and, as such, were initially assumed to have a key role in the pathogenic cascade (Hardy and Higgins, 1992). From the earliest days of clinicopathological investigations, however, a number of glaring inconsistencies arose. Chief among these is the oft-replicated finding that there is little association between where amyloid plaques are found at autopsy and which brain regions were dysfunctional in the patient’s clinical course (Price et al., 1991; Arriagada et al., 1992; Giannakopoulos et al., 1997; Hardy and Selkoe, 2002). This discordance is most obvious in the entorhinal cortex and hippocampus. These medial temporal lobe structures, crucial to episodic memory function, are the first to fail clinically and the first to develop neurofibrillary tangle pathology. Amyloid plaque deposition, however, does not occur in these regions until relatively late in the course (Price et al., 1991; Arriagada et al., 1992; Giannakopoulos et al., 1997). Conversely, other regions, such as the medial prefrontal cortex, typically show abundant amyloid plaque pathology at autopsy despite being relatively functionally spared clinically (Price et al., 1991; Arriagada et al., 1992; Giannakopoulos et al., 1997). As the field wrestled with these inconsistencies, evidence began to accrue suggesting that amyloid-β was still the key driver but that its pathogenic properties were related to smaller soluble aggregates of the peptide referred to as oligomers (Lambert et al., 1998; Hartley et al., 1999). These findings have allowed for an updated, reconciled version of the amyloid cascade hypothesis in which amyloid plaques give way to amyloid oligomers as the driving force in pathogenesis (Hardy and Selkoe, 2002).
The advent of amyloid PET (18F-florbetapir PET) imaging should have reinforced this update to the hypothesis. The correlation between plaque quantity and distribution as measured with PET and plaque quantity and distribution at autopsy is extraordinarily high (Ikonomovic et al., 2008; Hatsuta et al., 2015). Unsurprisingly, therefore, imaging studies of Alzheimer’s began to show many of the same patterns that the neuropathology literature had been documenting for the last several decades. After age 70, roughly 25% of healthy older controls without cognitive complaints or deficits on testing harbour a large burden of amyloid plaques on PET imaging (Rowe et al., 2010; Chetelat et al., 2013; Jack et al., 2014). The medial prefrontal cortex is among the first regions to show high signal on amyloid PET scans in healthy older controls despite remaining clinically unaffected even late into the course of Alzheimer’s disease (Jack et al., 2008). Conversely, even late into the course of Alzheimer’s disease cognitive symptoms, the medial temporal lobes tend to show little to no increased signal on amyloid PET (Jack et al., 2008). Despite its role in reintroducing these decades-old arguments against the primacy of plaques in Alzheimer’s disease pathogenesis, amyloid PET imaging has, oddly, seemed to have the opposite effect on the field. Rather than focusing on the inconsistencies, studies have tended to highlight the overlap between regions that show early amyloid plaque signal on PET and that happen to be affected early in Alzheimer’s disease (Buckner et al., 2005; Sperling et al., 2009; Koch et al., 2014). The posterior cingulate and inferolateral parietal cortices are most commonly cited in this regard. The posterior cingulate and inferolateral parietal cortices form the posterior aspect of the brain’s default mode network (DMN), a set of functionally connected regions—which also includes the medial prefrontal cortex and medial temporal lobe structures—that relates to memory function and appears to be targeted early by Alzheimer’s disease pathology (Raichle et al., 2001; Greicius et al., 2003, 2004; Shirer et al., 2012). One highly cited early study in this vein pointed out the qualitative similarity between a resting-state functional MRI map of the DMN, a map of glucose hypometabolism in patients with Alzheimer’s disease, and a map of amyloid deposition in Alzheimer’s disease patients (Buckner et al., 2005). This led to the oversimplified interpretation that amyloid plaque deposition occurs in the DMN and results in the dysfunction of this network. No attention was given to the findings, evident from the images, that patients with Alzheimer’s disease typically have normal metabolism in the medial prefrontal cortex despite having abundant amyloid deposition. Similarly, while the medial temporal lobe is a key component of the DMN and its metabolism is already reduced in the earliest clinical stages of Alzheimer’s disease, the amyloid map in this study (as in most subsequent amyloid PET studies) shows no uptake in the hippocampus (Buckner et al., 2005; Kemppainen et al., 2006; Edison et al., 2007; Jack et al., 2008), though with rare exceptions (Frisoni et al., 2009; Sepulcre et al., 2013).
A few multimodal imaging studies using 18F-fluorodeoxyglucose (FDG) PET and amyloid PET approached the question of whether local amyloid plaque deposition is correlated with local levels of glucose metabolism. These studies produced conflicting results with some showing an association between local amyloid plaque deposition and glucose hypometabolism in some brain regions (Engler et al., 2006; Edison et al., 2007; Cohen et al., 2009; Lowe et al., 2014) and others showing the absence of any correlation (Li et al., 2008; Rabinovici et al., 2010; Furst et al., 2012). Further work showed that the dependency may be more complex and relationship between plaques and metabolism may change depending on disease stages (Cohen et al., 2009) or brain regions (La Joie et al., 2012). Discrepancies in the findings may originate from the different subject populations that were studied. For instance, Lowe et al. (2014) studied only healthy controls, whereas Furst et al. (2012) focused on subjects with Alzheimer’s disease. A second source for the discrepancies may be the limited sample sizes of most studies: with the exception of Lowe et al. (2014), previous studies comprised fewer than 100 subjects and the specific regional analysis within a single disease group did typically not exceed two dozen subjects (Engler et al., 2006; Edison et al. 2007; Li et al., 2008; Cohen et al., 2009; La Joie et al., 2012). Moreover, many studies relied on a plain correlation analysis between the regional tracer intensities without correcting for cofounders such as age, sex, education and extent of amyloid pathology.
Here we investigated the relationship between regional amyloid plaque deposition and regional glucose hypometabolism, using a large data set comprising hundreds of subjects [healthy controls and patients with mild cognitive impairment (MCI)] obtained from the Alzheimer’s disease neuroimaging initiative (ADNI) database, who were imaged with both amyloid PET and FDG PET.
Materials and methods
Subjects
Data used in the preparation of this article were obtained from the ADNI database (http://adni.loni.usc.edu). The ADNI was launched in 2003 as a public-private partnership, led by Principal Investigator Michael W. Weiner, MD. The primary goal of the ADNI has been to test whether serial MRI, PET, other biological markers, and clinical and neuropsychological assessment can be combined to measure the progression of MCI and early Alzheimer’s disease. For up-to-date information, see www.adni-info.org.
We extracted T1-weighted structural scans, as well as florbetapir and FDG PET scans for 661 subjects from the ADNI database. The subjects were either healthy older controls (n = 227) or patients with MCI (n = 434), covering both early and late MCI. The FDG PET scan and the structural T1-weighted scan were acquired at most 60 days before or after the subjects’ first florbetapir PET scan. The closest diagnosis within 90 days of the florbetapir PET scan served as the current diagnosis. Further, CSF amyloid-β values obtained within 90 days of amyloid imaging were available for 544 subjects. Subject IDs and image IDs for all three modalities and subject specific information are available in Supplementary Table 1. For additional information on ADNI protocols see http://adni.loni.usc.edu/methods/documents/ and for PET analysis in particular see Jagust et al. (2010, 2012) and http://adni.loni.usc.edu/methods/pet-analysis/.
Regions of interest
Anatomically defined brain regions often comprise multiple, functionally independent regions and have proven inferior to functionally-defined regions in classification of cognitive states (Shirer et al., 2012) and in temporal and spatial clustering of brain regions (Craddock et al., 2012). Thus, for this analysis, we used a cortex-wide parcellation based on functional connectivity during rest rather than a structure-based parcellation such as the AAL (automated anatomical labeling) atlas (Tzourio-Mazoyer et al., 2002). More precisely, the regions of interest are based on a set of 90 functional regions derived from resting state functional MRI covering 14 major networks (Shirer et al., 2012). To further subdivide these regions, and extend the atlas to whole-brain coverage, we first divided the brain into 91 regions: 90 from the Shirer atlas and the rest of the grey matter voxels were treated as a single region. We then divided each region into round(nN/p) parcels using Ward clustering (Michel et al., 2012), where n is the number of grey matter voxels in the given region, p is the total number of grey matter voxels in the brain, and N is the user-defined number of parcels, set to 500 in accordance to the literature (Van Essen and Ugurbil, 2012). To constrain the parcels to be spatially-contiguous, only Pearson’s correlations between functional MRI time courses of spatially-adjacent voxels were considered during Ward clustering. The resting state functional MRI data used to estimate the Pearson’s correlations between voxels were obtained from a publicly available source comprising 21 subjects and 7-min scan time with a repetition time of 2000 ms (Landman et al., 2011).
This original set of 499 functionally defined regions of interest was modified to fit the specifics of this analysis. First, we applied a strict grey matter mask (mean grey matter of ≥0.4 in the study sample) to the regions of interest to reduce the influence of white matter on the average PET intensities in the regions of interest, which is a challenge when working with florbetapir PET. Second, we excluded cerebellar regions of interest (n = 59) and regions smaller than six voxels (2 mm isotropic; n = 36). This resulted in a final set of 404 regions of interest in MNI space covering the cortical grey matter (Fig. 1A). Further regions of interest were a joint pons-vermis region (for FDG PET normalization), a whole cerebellum region (for florbetapir PET normalization) and a whole cortex grey matter region. All regions of interest are available in the Supplementary material.
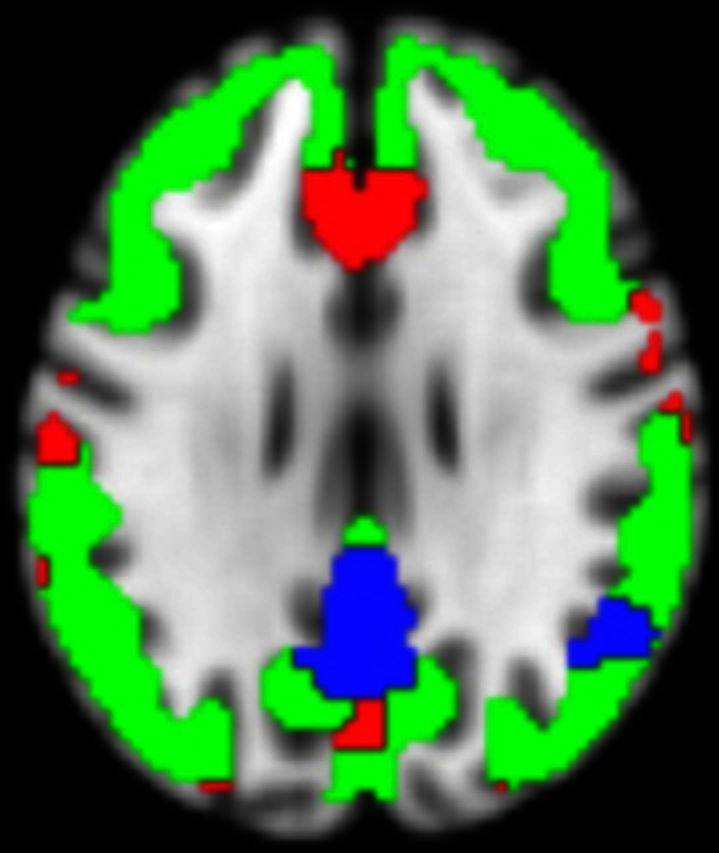
Figure 1.

Regions of interest and effects of diagnosis on imaging modalities. The 404 regions of interest used in the analysis (A), regions of interest with reduced grey matter in MCIs are shown in cyan (B); regions of interest with hypometabolism in MCI are shown in blue (C); regions of interest with increased amyloid plaque deposition in MCI are shown in red and yellow (D). All slices are in neurological convention (left side of the image corresponds to the left side of the brain).
Image processing
The structural T1 images were segmented into grey matter, white matter, and CSF using the New Segment algorithm in SPM8 (Ashburner and Friston, 2005). The DARTEL algorithm in SPM8 was used to normalize the images to MNI 152 space (Ashburner, 2007). To accelerate processing, a randomly selected subset of 100 images was used to create the DARTEL template. The resulting warping for each subject’s T1 image was applied to the grey matter segmented images; images were modulated following the spatial normalization. Further, images were smoothed using an 8 mm full-width at half-maximum Gaussian kernel. Finally, average grey matter density was computed for each of the 404 functional regions of interest and the whole cortex grey matter. The resulting values were divided by the subjects’ intracranial volume for normalization.
The PET images, which were acquired from the ADNI database, were smoothed to 8 mm resolution and the florbetapir and FDG PET images were coregistered for each subject. Due to technical challenges in normalizing florbetapir PET images to MNI space (Saint-Aubert et al., 2014), we analysed all PET data in subject space: SPM’s MNI PET template was spatially normalized to each subject’s FDG PET image using the Normalise algorithm in SPM8 (Ashburner et al., 1997). The resulting warping was applied to all regions of interest. Next, we extracted the average FDG and florbetapir tracer uptake for each of the functional 404 regions of interest and the whole cortex grey matter region of interest. We computed the standardized uptake value ratio (SUVR) by dividing the FDG and florbetapir intensities to the mean signal in the joint pons-vermis region of interest and the whole cerebellum region of interest, respectively.
Association between diagnosis and imaging modalities
For each of the three modalities and for each of the 404 functional regions of interest we estimated a linear regression model with the signal intensity being the dependent variable and diagnosis, age, sex, education, intracranial volume and APOE-ε4 status as the independent predictors. P-values for the diagnosis coefficient were Bonferroni corrected for each modality, i.e. assuming 404 tests within each modality. To rule out that changes observed in FDG PET and florbetapir PET were solely due to grey matter loss, in a second analysis, we added regional grey matter volume as a covariate to the linear model. Further, to assess the cortex-wide effect, we conducted this analysis with average biomarker intensity in the whole cortex grey matter region of interest for each modality.
Association between global amyloid burden and regional glucose metabolism
Increased global presence of amyloid plaques in the brain and decline of amyloid-β levels in the CSF are signs of disease progression from healthy ageing towards MCI and Alzheimer’s disease. With the next model, collapsing across diagnosis, we tested the association of global amyloid burden and local glucose metabolism. Global amyloid burden was defined as the mean florbetapir SUVR in the whole cortex grey matter region of interest. For each of the 404 functional regions of interest we estimated a linear model with the FDG PET SUVR as the dependent variable and diagnosis, age, sex, education, regional grey matter and global amyloid as independent predictors. The P-values for the association of global amyloid with regional FDG uptake were Bonferroni corrected for 404 tests. We repeated this analysis with a subset of subjects (n = 544) for which CSF amyloid-β was available close to the amyloid imaging. We used the continuous CSF amyloid-β value as replacement for cortex-wide florbetapir SUVR. Due to the strong association between APOE-ε4 carrier status and changes in amyloid-β in the CSF and in the cortex, we did not correct for APOE-ε4 carrier status in the linear model.
Association between regional amyloid burden and regional glucose metabolism
The effect of regional amyloid on regional glucose metabolism was tested with the same linear regression setup as for global amyloid but instead using the florbetapir SUVR of the same region of interest. As before, we were not correcting the model for APOE-ε4 carrier status. The P-values for this regional amyloid burden coefficient were Bonferroni corrected for 404 tests. Technically, we were assessing the significance of the semi-partial correlation between regional FDG SUVR and regional florbetapir SUVR.
Analysing these data region of interest by region of interest is technically valid and in fact often done in related work (Cohen et al., 2009; La Joie et al., 2012; Lowe et al., 2014). However, this local approach treats regions of interest independently from each other and disregards the high correlations between local levels of amyloid and global level of amyloid burden. Thus, to test for the local specificity of the association we conducted two additional computations: (i) estimating the linear regression as above, but correcting in addition for global amyloid burden by adding the cortex-wide florbetapir SUVR as an additional predictor (and, alternatively, CSF amyloid-β or the indicator variable for CSF amyloid-β ≤ 192 pg/ml); and (ii) conducting a permutation test examining the association strength to non-local amyloid burden (see below).
Permutation test
We define ‘local’ linear regression as the linear regression models used above where we test for the regional association between glucose metabolism in region of interest i and the regional amyloid plaque deposition in the same region of interest i. Conversely, we define ‘non-local’ linear regression as models where we test for the association between glucose metabolism in region of interest i and the amyloid plaque deposition in a different region of interest j ≠ i. In this permutation test we compared the association strength (t-score) of the local linear regression with the association strength from all non-local linear regressions. In particular, we computed how many non-local models showed a stronger association between glucose metabolism and amyloid plaques than the local model. In this one-sided permutation test the direction of the effect (sign of the t-value) in the local model determined whether stronger meant ‘more positive’ or ‘more negative’. To minimize possible confounding effects of neighbouring regions (i.e. regions adjacent to the local region of interest), all regions of interest adjacent to the examined region were excluded from the permutation test. That is, if the examined region of interest had five neighbours, we compared it to the association strength in the 398 (=403 − 5) remaining regions of interest. In addition, the number of regions imposed a lower bound on the P-value, i.e. P-values could not get lower than 1/404 (≈0.0025). Given this limitation, P-values were not corrected for multiple testing. Small P-values indicate local specificity of the association as only few non-local regions of interest show an equal or stronger association. Of note, at P = 0.05 there may still be as many as 19 non-local regions that show a stronger association.
Amyloid-positive scans
To define a cut-off for amyloid-positive scans, we used cortex-wide florbetapir SUVR values from a reference subgroup of all 661 subjects: 99 control subjects with a normal CSF amyloid-β level (>192 pg/ml) (Shaw et al., 2009). We computed mean and standard deviation (SD) of the global florbetapir SUVR in these subjects and used these values to compute a Z-score for global amyloid burden in all subjects. We considered a Z-score of 1.65 or more to be an indication of a positive amyloid scan. This cut-off corresponds to a P-value of 0.05 in a one-sided test. In our study sample, this Z-score translates into a cortex-wide florbetapir SUVR threshold of 1.263.
Rabinovici et al. (2010) reported a disappearance of regional associations once the study group was restricted to subjects with the same diagnosis. Thus, we repeated the test for association between regional florbetapir SUVR and regional FDG SUVR in the subset of subjects (n = 267) with amyloid-positive scans.
Sliding window analysis
To further investigate the effect of subject groupings on the significant regional associations, we conducted a sliding window approach. For this analysis all subjects were ranked according to their global amyloid burden from least burden to most burden. We used a window size of 100 subjects, which was shifted by 10 subjects; resulting in 58 groupings with 100 subjects each and increasing average global amyloid burden. For each window we conducted the regional association analysis, as we did for the entire sample set, and counted the number of negatively associated regions of interest.
Results
From the ADNI database we extracted imaging data for 661 subjects (controls: 227; MCI: 434). The data set contained more males (53.9%) and the average age at imaging was 73.4 years (SD 7.59). Compared to the control subjects, MCI subjects were significantly younger, had a significantly lower Mini-Mental State Examination score and were more likely to be carriers of an APOE-ε4 allele (Table 1).
Table 1.
Subject demographics
| Sex (males) | Age (SD) | Education (SD) | MMSE (SD) | APOE4 + (%) | |
|---|---|---|---|---|---|
| Controls (n = 227) | 111 | 75.3 (6.68) | 16.3 (2.6) | 29.1 (1.2) | 61 (26.9) |
| MCI (n = 434) | 245 | 72.5 (7.97) | 16.1 (2.7) | 28.1 (1.7) | 200 (46.1) |
| P-value | 0.077* | 2.3 × 10⁻⁶** | 0.25** | <2.2 × 10⁻¹⁶** | 2.3 × 10⁻⁶* |
*P-values based on Fisher’s exact test.
**P-values based on two-sided t-test.
MCI subjects show regional and global changes in all three imaging modalities
First, we examined the association between disease status (control versus MCI) and cortex-wide changes in imaging modalities. After adjusting for age, sex, intracranial volume, education, and APOE-ε4 carrier status, compared to control subjects, MCI subjects showed a significant cortex-wide increase in amyloid (T = 4.91; df = 652; P = 1.15 × 10⁻⁶), while glucose metabolism (T = −3.69; df = 652; P = 0.00024) and grey matter density (T = −2.11; df = 652; P = 0.035) were significantly decreased (Supplementary Fig. 1).
Using linear regression analysis, we examined the association between clinical diagnosis and regional imaging modality intensities for all 404 regions of interest (Fig. 1A). Compared to controls, MCIs showed significantly (Pbonf < 0.05) reduced grey matter density in four regions of interest (bilateral hippocampus and right inferior temporal gyrus; Fig. 1B) and significantly reduced glucose metabolism in 29 regions of interest (Fig. 1C). We refer to these regions of interest as diagnosis-associated regions of interest (ROIDX). The ROIDX cover the bilateral hippocampus, the posterior cingulate cortex/precuneus, right angular gyrus, and paracingulate gyrus. When correcting the linear model in addition for regional grey matter density, 25 ROIDX remained significant and three additional regions of interest showed significantly reduced glucose metabolism in MCIs compared to controls. Notably, two regions of interest showed significant reductions in both grey matter density and glucose metabolism: left and right hippocampus.
Further, compared to controls, MCIs showed significantly increased amyloid plaque deposition in 234 regions of interest (57.9% of all tested regions of interest) distributed across the entire cortex (Fig. 1D). Remarkably, no region of interest showed significant changes in all three modalities. When correcting the linear model in addition by regional grey matter density, 229 of the 234 regions of interest remained significant and eight additional regions of interest were significant. Detailed results for all regions of interest and the three modalities are summarized in Supplementary Fig. 2.
Changes in regional glucose metabolism are associated with global amyloid pathology
A total of 26 regions of interest (6.4%) showed a significant decrease of glucose metabolism with increasing global amyloid burden (Fig. 2A). We refer to these regions of interest as global amyloid regions of interest (ROIamyloid). These regions of interest cover the posterior cingulate cortex/precuneus, both lateral occipital cortices, bilateral inferior temporal gyri, and parts of the bilateral hippocampi. Using CSF amyloid-β levels instead of global amyloid burden resulted in qualitatively the same results (46 regions of interest; 25 shared with global amyloid and 21 new regions of interest extending the previous regions; Fig. 2B). We refer to these regions of interest as CSFamyloid-β regions of interest (ROICSF). As expected, CSF amyloid-β levels were highly correlated with global amyloid burden (r = −0.64; P < 5.6 × 10−64; Supplementary Fig. 3).
Figure 2.

Regional hypometabolism correlates of global amyloid biomarkers. Regions of interest showing significant reduction in glucose metabolism with increases in cortex-wide amyloid burden (A) or with decreases in CSF amyloid-β (B).
Regional hypometabolism is associated with global amyloid burden rather than regional amyloid burden
The main focus of this study was to investigate the association between the presence of local amyloid plaques and local glucose hypometabolism. Of particular interest were regions of interest that are linked to Alzheimer’s disease pathology (ROIDX, ROIamyloid, and ROICSF) along with regions of interest belonging to the DMN (Supplementary Fig. 4), which is known to be primarily affected in Alzheimer’s disease (Greicius et al., 2004; Seeley et al., 2009). Using linear regression, we found a significant association between the two PET modalities in 141 regions of interest. Half of these were negative relationships (n = 71; the higher the amyloid PET SUVR the lower the glucose metabolism) and the other half were positive (n = 70; the higher the amyloid PET SUVR the higher the glucose metabolism; Fig. 3A). Negative associations were mainly found in the posterior cingulate cortex/precuneus and the bilateral occipital gyri, while positive association were located in the bilateral hippocampi, entorhinal cortices, the thalamus, paracingulate gyrus and the supplementary motor cortex. The negatively associated regions of interest largely overlap with ROIDX (10 of 29), ROIamyloid (20 of 26) and ROICSF (27 of 46) (Table 2).
Figure 3.

Regional metabolism correlates of regional amyloid plaque deposition. Regions of interest with significant positive association are shown in yellow (increased metabolism with increased amyloid plaque deposition) and regions of interest with significant negative association are shown in blue (decreased metabolism with increased amyloid plaque deposition). The figure displays axial and coronal slices for three sets of results: regions of interest that exhibit a significant association between regional amyloid burden and glucose metabolism after correcting for diagnosis association (DX), sex, age, education and regional grey matter (A); the same as before but additionally corrected for global amyloid burden (B); results from (A) that survived the permutation test for local specificity (C).
Table 2.
Number of regions of interest with significant positive (+) or negative (−) association between regional florbetapir SUVR and regional FDG SUVR.
| Whole cortex n = 404 | ROIDX n = 29 | ROIamyloid n = 26 | ROICSF n = 46 | ROIDMN n = 34 | ||||||
|---|---|---|---|---|---|---|---|---|---|---|
| + | − | + | − | + | − | + | − | + | − | |
| Local | 70 | 71 | 11 | 10 | 2 | 20 | 6 | 27 | 4 | 8 |
| Local + global | 146 | 39 | 14 | 3 | 2 | 2 | 8 | 6 | 15 | 3 |
| Local + CSF | 97 | 31 | 12 | 2 | 2 | 4 | 6 | 6 | 7 | 3 |
| Local + CSF192 | 103 | 29 | 12 | 2 | 2 | 4 | 6 | 7 | 7 | 3 |
| Permutation | 70 | 42 | 11 | 3 | 2 | 3 | 6 | 8 | 4 | 3 |
| Amyloid+ | 71 | 1 | 11 | 0 | 2 | 0 | 6 | 0 | 6 | 0 |
The columns correspond to different sets of regions of interest being considered: all 404 regions of interest (whole cortex), regions of interest showing hypometabolism in MCIs (ROIDX), regions of interest showing hypometabolism with increases in global amyloid burden (ROIamyloid) or decreases in CSF amyloid-β (ROICSF), and regions of interest belonging to the DMN (ROIDMN). The rows correspond to different analysis setups: ‘Local’ refers to the regional analysis of association between amyloid and metabolism; ‘Local + global’, ‘Local + CSF’, and ‘Local + CSF192’ are in addition corrected for global amyloid burden, CSF amyloid-β levels, and an indicator for CSF amyloid-β ≤ 192 pg/ml, respectively. Permutation indicates regions of interest from the ‘Local’ analysis that survive the permutation test; Amyloid+ is ‘Local’ but restricted to all subjects with an amyloid positive scan.
Regional florbetapir SUVR was highly correlated with cortex-wide florbetapir SUVR: 349 regions of interest (86.4%) showed a Pearson’s r ≥ 0.7 (P < 8.14 × 10−99; Supplementary Fig. 5). After adding global florbetapir SUVR as an additional covariate to the linear model, 185 regions of interest showed a significant association between the regional florbetapir SUVR and regional glucose metabolism. The number of regions of interest with a negative dependency was markedly reduced (from 71 to 39; Table 2). In particular, the negative associations in the posterior cingulate cortex/precuneus as well as the lateral occipital gyri largely disappeared, while the regions with positive associations in the entorhinal cortices and the hippocampi increased (Fig. 3B). This effect also translated to fewer negative dependencies in Alzheimer’s disease linked regions of interest and the DMN (three regions of interest instead of eight; Table 2). Repeating the analysis using CSF amyloid-β and dichotomized CSF amyloid-β (≤192 pg/ml) instead of global amyloid burden to correct for global amyloid pathology led to qualitatively unchanged results and confirmed markedly fewer negative dependencies in the whole brain and Alzheimer’s disease linked regions (Table 2).
Next, we used a spatial permutation test for assessing the local specificity of the association between amyloid plaque deposition and glucose metabolism. All of the 70 positively associated regions of interest remained spatially specific, while only 42 of the 71 negatively associated regions of interest maintained spatial specificity (Table 2). As with global amyloid correction, the negative association in the regions of interest in the posterior cingulate cortex/precuneus and the bilateral lateral occipital cortices mostly disappeared (Fig. 3C).
No regional associations in subjects with a positive amyloid scan
Further, when we restricted the analysis to subjects showing a positive amyloid scan (n = 267; see ‘Materials and methods’ section) only one region of interest of all 404 showed a negative association between amyloid plaque deposition and metabolism (Table 2).
The sliding window analysis resulted in 58 groupings with 100 subjects each and increasing average global amyloid burden. With increasing global amyloid burden the number of regions of interest with negative association between regional amyloid plaque deposition and metabolism decreases (Fig. 4).
Figure 4.

Number of significant negative associations in relation to global amyloid level. Bottom: Median of the global amyloid level for all 58 groupings of 100 subjects and the resulting number of regions of interest with significant negative association between regional amyloid deposition and regional metabolism. A fitted spline with 4 df is shown in blue. The grey vertical line depicts the threshold for amyloid positive scans. The axial slices on top show the pattern of negative associated regions of interest for three groupings: low global amyloid (blue), half amyloid positive and half amyloid negative (red) and high global amyloid (yellow). The groupings are highlighted in the graph below with the same colour code. Overlaps between red and blue are shown in violet.
Discussion
Our analysis confirmed previously reported differences in imaging biomarkers between healthy controls and subjects with MCI. The availability of both PET modalities in all subjects allowed us to analyse the regional association of amyloid plaque burden and glucose metabolism. At first glance, our analysis appeared to largely confirm the qualitative similarity between a map of glucose hypometabolism and a map of amyloid deposition in patients with Alzheimer’s disease. However, only a minority of regions of interest followed the prediction of the amyloid hypothesis in its original form, where increase in amyloid plaques are linked to reductions in glucose metabolism. If the unmodified amyloid hypothesis held true, given the widespread increase of amyloid plaques in MCI subjects, there should have been a widespread decrease in glucose metabolism. Further, glucose metabolism in one of the prime regions of amyloid deposition, the prefrontal cortex, showed no significant association with regional levels of amyloid. The hippocampus, on the other hand, showed hypometabolism without significant enrichment of amyloid plaques. If these data support a regional association between amyloid plaque burden and metabolism, it is for the somewhat heretical inversion of the amyloid hypothesis. That is, regional amyloid plaque deposition is protective, possibly by pulling the more toxic amyloid oligomers out of circulation and binding them up in inert plaques, or via other mechanisms (Cuajungco et al., 2000; Lee et al., 2004; Wolfe and Cyr, 2011). A similar pattern has been observed in APP/PSEN1 mouse models: older transgenic mice showed increased FDG uptake in the hippocampus and other cortical regions when compared to age-matched controls. Follow-up experiments showed that these glucose uptake increases were located in the proximity of plaques rather than in amyloid-free tissue (Poisnel et al., 2012). However, given the resolution of PET and the applied smoothing, we cannot rule out that positive association in ventral areas and subcortical areas are the result of co-registration artefacts. Our additional analyses, which were aimed at elucidating the local specificity of the association, suggest that the pattern of hypometabolism is mainly dependent on the cortex-wide increase in amyloid burden and not due to regional deposits of fibrillar amyloid plaques.
The question of whether local deposits of fibrillar amyloid have a bearing on local glucose metabolism has been met with conflicting results. Until now, few studies have directly compared the regional association between these two modalities side-by-side in the same subjects, with some work reporting a regional association of amyloid plaques and hypometabolism (Engler et al., 2006; Edison et al., 2007; Cohen et al., 2009; Lowe et al., 2014) and other work reporting no significant association (Li et al., 2008; Rabinovici et al., 2010; Furst et al., 2012). These discrepancies may, in part, originate from the fact that most studies examined a low number of subjects and had thus reduced power to detect an association. An additional key factor is the subject group studied. Rabinovici et al. (2010) noted that the initially significant regional association disappeared once healthy subjects were removed from the analysis, which further highlights the necessity to control for global amyloid levels in the regional analysis. In addition, most previous studies focused the regional analysis on a small set of brain regions such as the precuneus that are typically affected in Alzheimer’s disease. Given the high correlation of local amyloid burden with global amyloid burden, picking a select set of regions of interest runs the risk of accentuating the spurious effect of local amyloid on local metabolism when it is in fact linked to disease progression (as indicated by global amyloid burden). Further, our sliding window analysis showed that a preselection of amyloid-positive subjects reduced the likelihood of observing negative associations between the two modalities. In fact, the negative associations were most pronounced in subject groups that were mainly amyloid negative, i.e. at the beginning of the disease spectrum, and therefore in line with the findings by Lowe et al. (2014) who studied older cognitively normal subjects exhibiting a wide range of global amyloid burden. Further, the lack of significant regions of interest in subjects with substantial amyloid tracer retention can be regarded as further evidence for neurodegeneration being independent from amyloid-β pathology in advanced stages of the disease (Hyman, 2011).
Clearly, amyloid imaging is a valuable clinical tool. Like levels of amyloid-β in the CSF, a longstanding biomarker for Alzheimer’s disease, global amyloid plaque burden is a useful marker for disease onset and progression (Okello et al., 2009; Villemagne et al., 2011; Jack et al., 2014). Like many others, our study showed that subjects with a positive amyloid scan were more likely to show dysfunction (hypometabolism here) in Alzheimer’s disease-related regions (Greicius et al., 2004; Sorg et al., 2007; Seeley et al., 2009). However, according to our results there appears to be no added clinical or research value in studying the regional distribution of amyloid plaques. This confirms early clinicopathological investigations (Price et al., 1991; Arriagada et al., 1992; Giannakopoulos et al., 1997) and recent imaging studies (Rabinovici et al., 2008; Lehmann et al., 2013; Laforce et al., 2014), all of which found no link between the regional pattern of amyloid plaques and the dysfunctional brain regions in the patient’s clinical course. Tau imaging (Villemagne and Okamura, 2014) may be more suitable to provide clinically relevant regional information. One criticism that our interpretation is likely to encounter is that there may be a time lag between regional amyloid plaque deposition and a given region later becoming dysfunctional (Forster et al., 2012). This would probably hold up for regions like the posterior cingulate cortex but would not explain regions like the medial prefrontal cortex (early plaques like the posterior cingulate cortex but much later metabolism changes) or the hippocampus (early hypometabolism, late plaques).
In conclusion, given the wide-spread distribution of amyloid plaques, if the canonical cascade hypothesis were true, we would expect wide-spread, cortical hypometabolism and cortex-wide negative associations between amyloid plaques and metabolism. Instead, cortical hypometabolism appears to be mainly linked to global amyloid burden. Global amyloid plaque burden is an important biomarker of Alzheimer’s disease risk. Regional amyloid plaque deposition, however, has little to no association with regional hypometabolism.
Supplementary Material
Acknowledgements
Data used in preparation of this article were obtained from the Alzheimer’s Disease Neuroimaging Initiative (ADNI) database (adni.loni.usc.edu). As such, the investigators within the ADNI contributed to the design and implementation of ADNI and/or provided data but did not participate in analysis or writing of this report. A complete listing of ADNI investigators can be found at: http://adni.loni.usc.edu/wp-content/uploads/how_to_apply/ADNI_Acknowledgement_List.pdf.
Glossary
Abbreviations
- ADNI
Alzheimer’s disease neuroimaging initiative
- DMN
default mode network
- FDG
18F-fluorodeoxyglucose
- MCI
mild cognitive impairment
- SUVR
standard uptake value ratio
Funding
The JNA Foundation. The Feldman Family Foundation. The National Institutes of Health: NS073498.
ADNI: Data collection and sharing for this project was funded by the Alzheimer's Disease Neuroimaging Initiative (ADNI) (National Institutes of Health Grant U01 AG024904) and DOD ADNI (Department of Defense award number W81XWH-12-2-0012). ADNI is funded by the National Institute on Aging, the National Institute of Biomedical Imaging and Bioengineering, and through generous contributions from the following: AbbVie, Alzheimer’s Association; Alzheimer’s Drug Discovery Foundation; Araclon Biotech; BioClinica, Inc.; Biogen; Bristol-Myers Squibb Company; CereSpir, Inc.; Eisai Inc.; Elan Pharmaceuticals, Inc.; Eli Lilly and Company; EuroImmun; F. Hoffmann-La Roche Ltd and its affiliated company Genentech, Inc.; Fujirebio; GE Healthcare; IXICO Ltd.; Janssen Alzheimer Immunotherapy Research & Development, LLC.; Johnson & Johnson Pharmaceutical Research & Development LLC.; Lumosity; Lundbeck; Merck & Co., Inc.; Meso Scale Diagnostics, LLC.; NeuroRx Research; Neurotrack Technologies; Novartis Pharmaceuticals Corporation; Pfizer Inc.; Piramal Imaging; Servier; Takeda Pharmaceutical Company; and Transition Therapeutics. The Canadian Institutes of Health Research is providing funds to support ADNI clinical sites in Canada. Private sector contributions are facilitated by the Foundation for the National Institutes of Health (www.fnih.org). The grantee organization is the Northern California Institute for Research and Education, and the study is coordinated by the Alzheimer's Disease Cooperative Study at the University of California, San Diego. ADNI data are disseminated by the Laboratory for Neuro Imaging at the University of Southern California.
Supplementary material
Supplementary material is available at Brain online.
References
- Arriagada PV, Growdon JH, Hedley-Whyte ET, Hyman BT. Neurofibrillary tangles but not senile plaques parallel duration and severity of Alzheimer's disease. Neurology 1992; 42(3 Pt 1): 631–9. [DOI] [PubMed] [Google Scholar]
- Ashburner J. A fast diffeomorphic image registration algorithm. Neuroimage 2007; 38: 95–113. [DOI] [PubMed] [Google Scholar]
- Ashburner J, Friston KJ. Unified segmentation. Neuroimage 2005; 26: 839–51. [DOI] [PubMed] [Google Scholar]
- Ashburner J, Neelin P, Collins DL, Evans A, Friston K. Incorporating prior knowledge into image registration. Neuroimage 1997; 6: 344–52. [DOI] [PubMed] [Google Scholar]
- Braak H, Braak E. Neuropathological stageing of Alzheimer-related changes. Acta Neuropathol 1991; 82: 239–59. [DOI] [PubMed] [Google Scholar]
- Buckner RL, Snyder AZ, Shannon BJ, LaRossa G, Sachs R, Fotenos AF, et al. Molecular, structural, and functional characterization of Alzheimer's disease: evidence for a relationship between default activity, amyloid, and memory. J Neurosci 2005; 25: 7709–17. [DOI] [PMC free article] [PubMed] [Google Scholar]
- Chetelat G, La Joie R, Villain N, Perrotin A, de La Sayette V, Eustache F, et al. Amyloid imaging in cognitively normal individuals, at-risk populations and preclinical Alzheimer's disease. Neuroimage Clin 2013; 2: 356–65. [DOI] [PMC free article] [PubMed] [Google Scholar]
- Cohen AD, Price JC, Weissfeld LA, James J, Rosario BL, Bi W, et al. Basal cerebral metabolism may modulate the cognitive effects of Abeta in mild cognitive impairment: an example of brain reserve. J Neurosci 2009; 29: 14770–8. [DOI] [PMC free article] [PubMed] [Google Scholar]
- Craddock RC, James GA, Holtzheimer PE, 3rd, Hu XP, Mayberg HS. A whole brain fMRI atlas generated via spatially constrained spectral clustering. Hum Brain Mapp 2012; 33: 1914–28. [DOI] [PMC free article] [PubMed] [Google Scholar]
- Cuajungco MP, Goldstein LE, Nunomura A, Smith MA, Lim JT, Atwood CS, et al. Evidence that the beta-amyloid plaques of Alzheimer's disease represent the redox-silencing and entombment of abeta by zinc. J Biol Chem 2000; 275: 19439–42. [DOI] [PubMed] [Google Scholar]
- Edison P, Archer HA, Hinz R, Hammers A, Pavese N, Tai YF, et al. Amyloid, hypometabolism, and cognition in Alzheimer disease: an [11C]PIB and [18F]FDG PET study. Neurology 2007; 68: 501–8. [DOI] [PubMed] [Google Scholar]
- Engler H, Forsberg A, Almkvist O, Blomquist G, Larsson E, Savitcheva I, et al. Two-year follow-up of amyloid deposition in patients with Alzheimer's disease. Brain 2006; 129 (Pt 11): 2856–66. [DOI] [PubMed] [Google Scholar]
- Forster S, Yousefi BH, Wester HJ, Klupp E, Rominger A, Forstl H, et al. Quantitative longitudinal interrelationships between brain metabolism and amyloid deposition during a 2-year follow-up in patients with early Alzheimer's disease. Euro J Nucl Med Mol Imaging 2012; 39: 1927–36. [DOI] [PubMed] [Google Scholar]
- Frisoni GB, Lorenzi M, Caroli A, Kemppainen N, Nagren K, Rinne JO. In vivo mapping of amyloid toxicity in Alzheimer disease. Neurology 2009; 72: 1504–11. [DOI] [PubMed] [Google Scholar]
- Furst AJ, Rabinovici GD, Rostomian AH, Steed T, Alkalay A, Racine C, et al. Cognition, glucose metabolism and amyloid burden in Alzheimer's disease. Neurobiol Aging 2012; 33: 215–25. [DOI] [PMC free article] [PubMed] [Google Scholar]
- Giannakopoulos P, Hof PR, Michel JP, Guimon J, Bouras C. Cerebral cortex pathology in aging and Alzheimer's disease: a quantitative survey of large hospital-based geriatric and psychiatric cohorts. Brain Res Brain Res Rev 1997; 25: 217–45. [DOI] [PubMed] [Google Scholar]
- Gomez-Isla T, Growdon WB, McNamara MJ, Nochlin D, Bird TD, Arango JC, et al. The impact of different presenilin 1 andpresenilin 2 mutations on amyloid deposition, neurofibrillary changes and neuronal loss in the familial Alzheimer's disease brain: evidence for other phenotype-modifying factors. Brain 1999; 122 (Pt 9): 1709–19. [DOI] [PubMed] [Google Scholar]
- Greicius MD, Krasnow B, Reiss AL, Menon V. Functional connectivity in the resting brain: a network analysis of the default mode hypothesis. Proc Natl Acad Sci USA 2003; 100: 253–8. [DOI] [PMC free article] [PubMed] [Google Scholar]
- Greicius MD, Srivastava G, Reiss AL, Menon V. Default-mode network activity distinguishes Alzheimer's disease from healthy aging: evidence from functional MRI. Proc Natl Acad Sci USA 2004; 101: 4637–42. [DOI] [PMC free article] [PubMed] [Google Scholar]
- Hardy J, Allsop D. Amyloid deposition as the central event in the aetiology of Alzheimer's disease. Trends Pharmacol Sci 1991; 12: 383–8. [DOI] [PubMed] [Google Scholar]
- Hardy J, Selkoe DJ. The amyloid hypothesis of Alzheimer's disease: progress and problems on the road to therapeutics. Science 2002; 297: 353–6. [DOI] [PubMed] [Google Scholar]
- Hardy JA, Higgins GA. Alzheimer's disease: the amyloid cascade hypothesis. Science 1992; 256: 184–5. [DOI] [PubMed] [Google Scholar]
- Hartley DM, Walsh DM, Ye CP, Diehl T, Vasquez S, Vassilev PM, et al. Protofibrillar intermediates of amyloid beta-protein induce acute electrophysiological changes and progressive neurotoxicity in cortical neurons. J Neurosci 1999; 19: 8876–84. [DOI] [PMC free article] [PubMed] [Google Scholar]
- Hatsuta H, Takao M, Ishii K, Ishiwata K, Saito Y, Kanemaru K, et al. Amyloid beta accumulation assessed with 11C-Pittsburgh compound B PET and postmortem neuropathology. Curr Alzheimer Res 2015; 12: 278–86. [DOI] [PubMed] [Google Scholar]
- Hyman BT. Amyloid-dependent and amyloid-independent stages of Alzheimer disease. ArchNeurol 2011; 68: 1062–4. [DOI] [PubMed] [Google Scholar]
- Ikonomovic MD, Klunk WE, Abrahamson EE, Mathis CA, Price JC, Tsopelas ND, et al. Post-mortem correlates of in vivo PiB-PET amyloid imaging in a typical case of Alzheimer's disease. Brain 2008; 131Pt 6): 1630–45. [DOI] [PMC free article] [PubMed] [Google Scholar]
- Jack CR, Jr., Lowe VJ, Senjem ML, Weigand SD, Kemp BJ, Shiung MM, et al. 11C PiB and structural MRI provide complementary information in imaging of Alzheimer's disease and amnestic mild cognitive impairment. Brain 2008; 131 (Pt 3): 665–80. [DOI] [PMC free article] [PubMed] [Google Scholar]
- Jack CR, Jr., Wiste HJ, Weigand SD, Rocca WA, Knopman DS, Mielke MM, et al. Age-specific population frequencies of cerebral beta-amyloidosis and neurodegeneration among people with normal cognitive function aged 50–89 years: a cross-sectional study. Lancet Neurol 2014; 13: 997–1005. [DOI] [PMC free article] [PubMed] [Google Scholar]
- Jagust WJ, Bandy D, Chen K, Foster NL, Landau SM, Mathis CA, et al. The Alzheimer's Disease Neuroimaging Initiative positron emission tomography core. Alzheimer's Dement 2010; 6: 221–9. [DOI] [PMC free article] [PubMed] [Google Scholar]
- Jagust WJ, Landau SM, Alzheimer's Disease Neuroimaging I. Apolipoprotein E, not fibrillar beta-amyloid, reduces cerebral glucose metabolism in normal aging. J Neurosci 2012; 32: 18227–33. [DOI] [PMC free article] [PubMed] [Google Scholar]
- Kemppainen NM, Aalto S, Wilson IA, Nagren K, Helin S, Bruck A, et al. Voxel-based analysis of PET amyloid ligand [11C]PIB uptake in Alzheimer disease. Neurology 2006; 67: 1575–80. [DOI] [PubMed] [Google Scholar]
- Koch K, Myers NE, Gottler J, Pasquini L, Grimmer T, Forster S, et al. Disrupted intrinsic networks link amyloid-beta pathology and impaired cognition in prodromal Alzheimer's disease. Cereb Cortex 2014. Advance Access published on July 4, 2014, doi: 10.1093/cercor/bhu151. [DOI] [PMC free article] [PubMed] [Google Scholar]
- La Joie R, Perrotin A, Barre L, Hommet C, Mezenge F, Ibazizene M, et al. Region-specific hierarchy between atrophy, hypometabolism, and beta-amyloid (Abeta) load in Alzheimer's disease dementia. J Neurosci 2012; 32: 16265–73. [DOI] [PMC free article] [PubMed] [Google Scholar]
- Laforce R, Jr., Tosun D, Ghosh P, Lehmann M, Madison CM, Weiner MW, et al. Parallel ICA of FDG-PET and PiB-PET in three conditions with underlying Alzheimer's pathology. Neuroimage Clin 2014; 4: 508–16. [DOI] [PMC free article] [PubMed] [Google Scholar]
- Lambert MP, Barlow AK, Chromy BA, Edwards C, Freed R, Liosatos M, et al. Diffusible, nonfibrillar ligands derived from Abeta1‐42 are potent central nervous system neurotoxins. Proc Natl Acad Sci USA 1998; 95: 6448–53. [DOI] [PMC free article] [PubMed] [Google Scholar]
- Landman BA, Huang AJ, Gifford A, Vikram DS, Lim IA, Farrell JA, et al. Multi-parametric neuroimaging reproducibility: a 3-T resource study. Neuroimage 2011; 54: 2854–66. [DOI] [PMC free article] [PubMed] [Google Scholar]
- Lee HG, Casadesus G, Zhu X, Takeda A, Perry G, Smith MA. Challenging the amyloid cascade hypothesis: senile plaques and amyloid-beta as protective adaptations to Alzheimer disease. Ann N Y Acad Sci 2004; 1019: 1–4. [DOI] [PubMed] [Google Scholar]
- Lehmann M, Ghosh PM, Madison C, Laforce R, Jr., Corbetta-Rastelli C, Weiner MW, et al. Diverging patterns of amyloid deposition and hypometabolism in clinical variants of probable Alzheimer's disease. Brain 2013; 136 (Pt 3): 844–58. [DOI] [PMC free article] [PubMed] [Google Scholar]
- Li Y, Rinne JO, Mosconi L, Pirraglia E, Rusinek H, DeSanti S, et al. Regional analysis of FDG and PIB-PET images in normal aging, mild cognitive impairment, and Alzheimer's disease. Euro J Nucl Med Mol Imaging 2008; 35: 2169–81. [DOI] [PMC free article] [PubMed] [Google Scholar]
- Lowe VJ, Weigand SD, Senjem ML, Vemuri P, Jordan L, Kantarci K, et al. Association of hypometabolism and amyloid levels in aging, normal subjects. Neurology 2014; 82: 1959–67. [DOI] [PMC free article] [PubMed] [Google Scholar]
- Michel V, Gramfort A, Varoquaux G, Eger E, Keribin C, Thirion B. A supervised clustering approach for fMRI-based inference of brain states. Pattern Recognit 2012; 45: 2041–9. [Google Scholar]
- Okello A, Koivunen J, Edison P, Archer HA, Turkheimer FE, Nagren K, et al. Conversion of amyloid positive and negative MCI to AD over 3 years: an 11C-PIB PET study. Neurology 2009; 73: 754–60. [DOI] [PMC free article] [PubMed] [Google Scholar]
- Poisnel G, Herard AS, El Tannir El Tayara N, Bourrin E, Volk A, Kober F, et al. Increased regional cerebral glucose uptake in an APP/PS1 model of Alzheimer's disease. Neurobiol aging 2012; 33: 1995–2005. [DOI] [PMC free article] [PubMed] [Google Scholar]
- Price JL, Davis PB, Morris JC, White DL. The distribution of tangles, plaques and related immunohistochemical markers in healthy aging and Alzheimer's disease. Neurobiol Aging 1991; 12: 295–312. [DOI] [PubMed] [Google Scholar]
- Rabinovici GD, Furst AJ, Alkalay A, Racine CA, O'Neil JP, Janabi M, et al. Increased metabolic vulnerability in early-onset Alzheimer's disease is not related to amyloid burden. Brain 2010; 133 (Pt 2): 512–28. [DOI] [PMC free article] [PubMed] [Google Scholar]
- Rabinovici GD, Jagust WJ, Furst AJ, Ogar JM, Racine CA, Mormino EC, et al. Abeta amyloid and glucose metabolism in three variants of primary progressive aphasia. Ann Neurol 2008; 64: 388–401. [DOI] [PMC free article] [PubMed] [Google Scholar]
- Raichle ME, MacLeod AM, Snyder AZ, Powers WJ, Gusnard DA, Shulman GL. A default mode of brain function. Proc Natl Acad Sci USA 2001; 98: 676–82. [DOI] [PMC free article] [PubMed] [Google Scholar]
- Rowe CC, Ellis KA, Rimajova M, Bourgeat P, Pike KE, Jones G, et al. Amyloid imaging results from the Australian Imaging, Biomarkers and Lifestyle (AIBL) study of aging. Neurobiol Aging 2010; 31: 1275–83. [DOI] [PubMed] [Google Scholar]
- Saint-Aubert L, Nemmi F, Peran P, Barbeau EJ, Payoux P, Chollet F, et al. Comparison between PET template-based method and MRI-based method for cortical quantification of florbetapir (AV-45) uptake in vivo. Euro J Nucl Med Mol Imaging 2014; 41: 836–43. [DOI] [PMC free article] [PubMed] [Google Scholar]
- Scheuner D, Eckman C, Jensen M, Song X, Citron M, Suzuki N, et al. Secreted amyloid beta-protein similar to that in the senile plaques of Alzheimer's disease is increased in vivo by the presenilin 1 and 2 and APP mutations linked to familial Alzheimer's disease. Nat Med 1996; 2: 864–70. [DOI] [PubMed] [Google Scholar]
- Seeley WW, Crawford RK, Zhou J, Miller BL, Greicius MD. Neurodegenerative diseases target large-scale human brain networks. Neuron 2009; 62: 42–52. [DOI] [PMC free article] [PubMed] [Google Scholar]
- Sepulcre J, Sabuncu MR, Becker A, Sperling R, Johnson KA. In vivo characterization of the early states of the amyloid-beta network. Brain 2013; 136 (Pt 7): 2239–52. [DOI] [PMC free article] [PubMed] [Google Scholar]
- Shaw LM, Vanderstichele H, Knapik-Czajka M, Clark CM, Aisen PS, Petersen RC, et al. Cerebrospinal fluid biomarker signature in Alzheimer's disease neuroimaging initiative subjects. Ann Neurol 2009; 65: 403–13. [DOI] [PMC free article] [PubMed] [Google Scholar]
- Shirer WR, Ryali S, Rykhlevskaia E, Menon V, Greicius MD. Decoding subject-driven cognitive states with whole-brain connectivity patterns. Cereb Cortex 2012; 22: 158–65. [DOI] [PMC free article] [PubMed] [Google Scholar]
- Sorg C, Riedl V, Muhlau M, Calhoun VD, Eichele T, Laer L, et al. Selective changes of resting-state networks in individuals at risk for Alzheimer's disease. Proc Natl Acad Sci USA 2007; 104: 18760–5. [DOI] [PMC free article] [PubMed] [Google Scholar]
- Sperling RA, Laviolette PS, O'Keefe K, O'Brien J, Rentz DM, Pihlajamaki M, et al. Amyloid deposition is associated with impaired default network function in older persons without dementia. Neuron 2009; 63: 178–88. [DOI] [PMC free article] [PubMed] [Google Scholar]
- Suzuki N, Cheung TT, Cai XD, Odaka A, Otvos L, Jr., Eckman C, et al. An increased percentage of long amyloid beta protein secreted by familial amyloid beta protein precursor (beta APP717) mutants. Science 1994; 264: 1336–40. [DOI] [PubMed] [Google Scholar]
- Tzourio-Mazoyer N, Landeau B, Papathanassiou D, Crivello F, Etard O, Delcroix N, et al. Automated anatomical labeling of activations in SPM using a macroscopic anatomical parcellation of the MNI MRI single-subject brain. Neuroimage 2002; 15: 273–89. [DOI] [PubMed] [Google Scholar]
- Van Essen DC, Ugurbil K. The future of the human connectome. Neuroimage 2012; 62: 1299–310. [DOI] [PMC free article] [PubMed] [Google Scholar]
- Villemagne VL, Okamura N. In vivo tau imaging: obstacles and progress. Alzheimer's Dement 2014; 10: 3 SupplS254–64. [DOI] [PubMed] [Google Scholar]
- Villemagne VL, Pike KE, Chetelat G, Ellis KA, Mulligan RS, Bourgeat P, et al. Longitudinal assessment of Abeta and cognition in aging and Alzheimer disease. Ann Neurol 2011; 69: 181–92. [DOI] [PMC free article] [PubMed] [Google Scholar]
- Wolfe KJ, Cyr DM. Amyloid in neurodegenerative diseases: friend or foe? Semin Cell Dev Biol 2011; 22: 476–81. [DOI] [PMC free article] [PubMed] [Google Scholar]
Associated Data
This section collects any data citations, data availability statements, or supplementary materials included in this article.